
What is an Electric Power Retail Smart Meter Rollout Performance Dashboard?
An Electric Power Retail Smart Meter Rollout Performance Dashboard template is a centralized analytics platform used by power retail utilities to track, monitor, and manage large-scale smart meter deployment programs. It provides visibility into rollout progress, installation productivity, vendor execution, capital utilization, and billing enablement.
By consolidating operational, financial, and execution metrics into a single view, the dashboard wireframe helps retail utilities ensure smart meter programs stay on schedule, within budget, and aligned with billing and AMI activation goals.
How to Create an Electric Power Retail Smart Meter Rollout Performance Dashboard
You don’t need to build your report from scratch, just start with a ready-to-use Electric Power Retail Smart Meter Rollout Performance dashboard template from Mokkup. Add in your data and export it however you like. Here’s how to do it:
1. Create or Log in to Your Mokkup Account
Start by signing up on Mokkup.ai using your email. If you already have an account, just log in, and you’ll be good to go.
2. Choose and Customize Your Dashboard Template
Find the Electric Power Retail Smart Meter Rollout Performance Dashboard template in the Templates section. Use the drag-and-drop editor to adjust KPIs, edit filters, or add elements based on your data.
3. Export to Your BI Tool
Once your dashboard wireframe is ready, use the BI Tool Export feature to send it directly to Power BI or Tableau for further analysis and enhancements. You can also download the dashboard as a PDF, PNG, or JPEG, embed it on a platform, or invite your team to collaborate.
Note: This is a Pro template. You’ll need a Pro subscription on Mokkup to use and customize this dashboard wireframe. Upgrade anytime to unlock full access.
Electric Power Retail Smart Meter Rollout Performance Dashboard Example
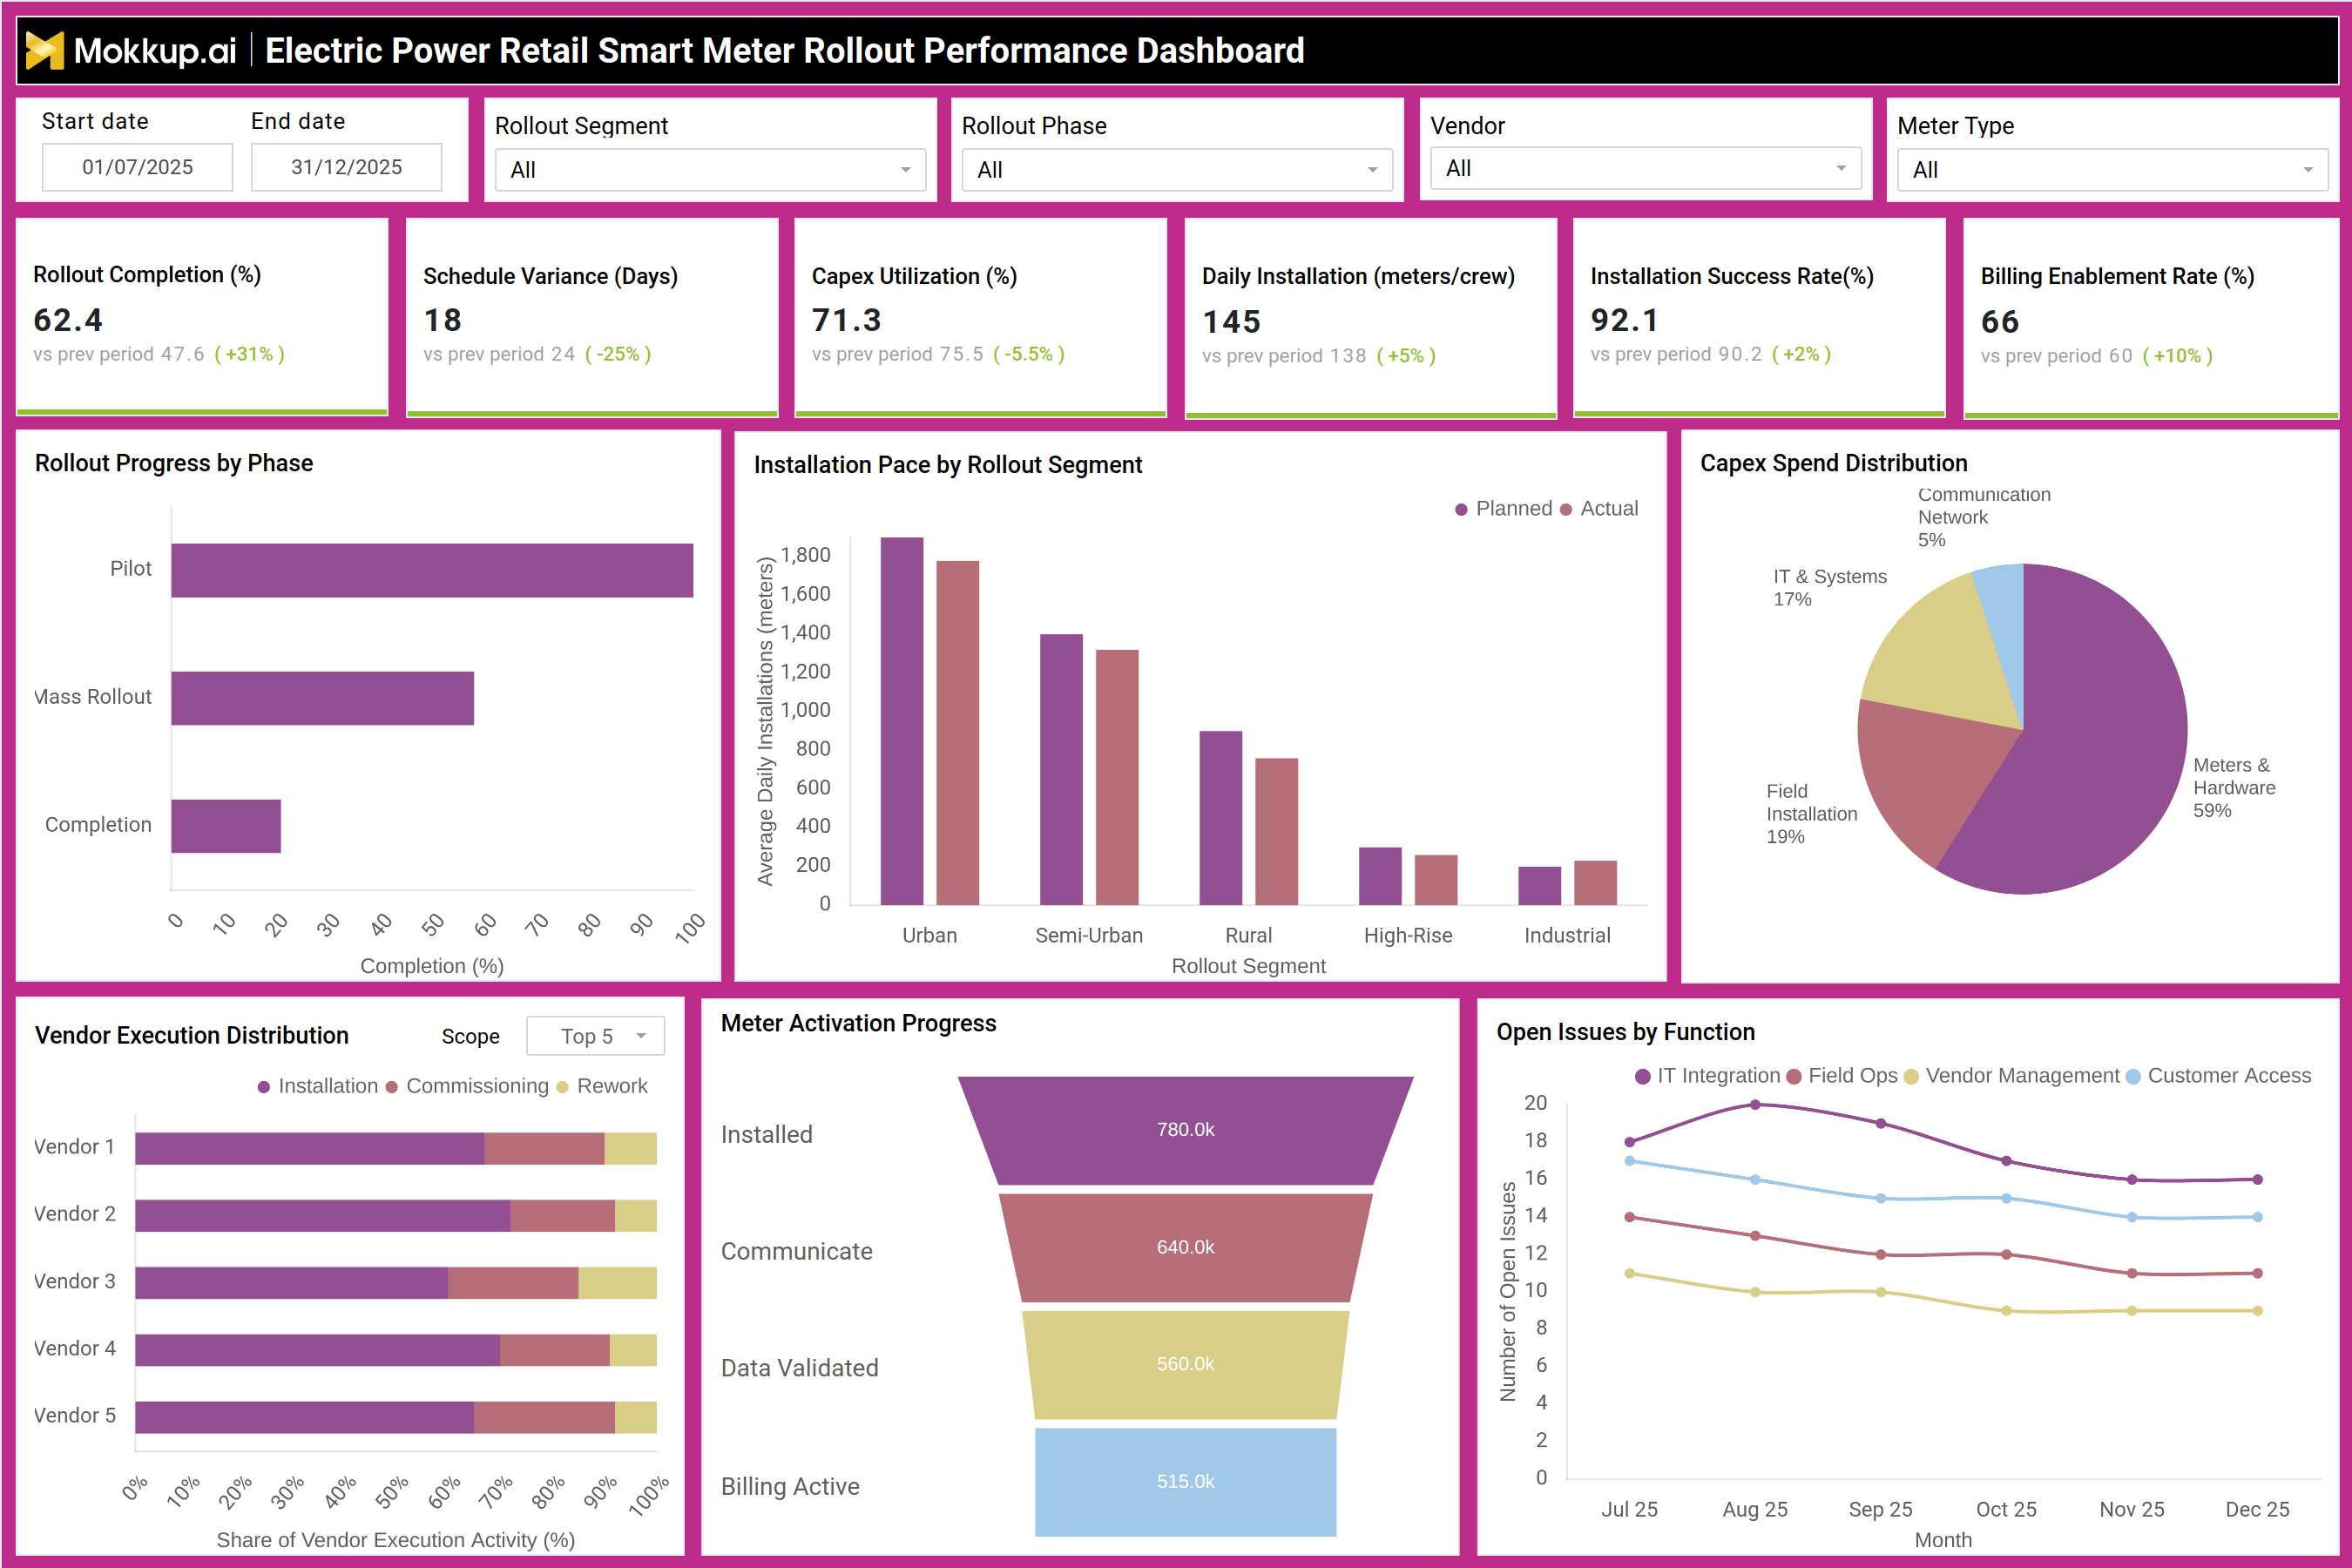
A typical electric utility smart meter rollout tracking dashboard presents a complete view of the rollout lifecycle from installation to billing activation. At the top level, executives can track rollout completion percentage, schedule variance, capex utilization, daily installation productivity, installation success rate, and billing enablement rate. Below this, visuals show rollout progress by phase, installation pace across urban and rural segments, capex spend distribution, vendor execution mix, meter activation funnel stages, and open issues by function. This structure allows leaders to quickly identify bottlenecks, execution risks, and readiness gaps across the smart meter program.
How to Analyze Data in Electric Power Retail Smart Meter Rollout Performance Dashboard
Here is how you can analyze data from this dashboard:
- Overall Rollout Progress: Review Rollout Completion (%) to understand overall program progress against plan.
- Schedule Control: Track Schedule Variance (Days) to identify timeline slippages or recovery trends.
- Capex Alignment: Monitor Capex Utilization (%) to assess alignment between spending and rollout progress.
- Field Productivity: Analyze Daily Installation (meters per crew) to evaluate crew efficiency and deployment capacity.
- Installation Quality: Compare Installation Success Rate (%) to detect quality issues and potential rework risks.
- Revenue Readiness: Track Billing Enablement Rate (%) to ensure installed meters are actively generating revenue value.
- Phase Progress Monitoring: Use Rollout Progress by Phase to identify delays between pilot, mass rollout, and final completion.
- Segment Performance Analysis: Evaluate Installation Pace by Rollout Segment to optimize urban, rural, and high rise deployment strategies.
- Capex Distribution Review: Review Capex Spend Distribution to ensure balanced investment across hardware, installation, IT, and communication infrastructure.
- Vendor Performance Tracking: Analyze Vendor Execution Distribution to identify vendor specific performance gaps or quality concerns.
- Activation Funnel Monitoring: Track Meter Activation Progress Funnel to locate drop-offs between installation, communication, validation, and billing.
- Issue Prioritization: Monitor Open Issues by Function to address IT integration, field operations, vendor management, or customer access risks.
Benefits of Electric Power Retail Smart Meter Rollout Performance Dashboard
The following are the benefits of using this dashboard:
- End-to-End Visibility: Improves visibility into complete smart meter rollout execution.
- Early Delay Detection: Enables early identification of schedule delays and execution bottlenecks.
- Capex Control: Supports better capital allocation and capex utilization management.
- Vendor Accountability: Enhances vendor performance monitoring and accountability.
- Improved Installation Quality: Increases installation success rates and reduces rework.
- Faster Billing Activation: Accelerates meter activation and billing readiness.
- Reduced Deployment Risk: Minimizes operational risk during large-scale AMI deployments.
- Cross-Functional Coordination: Improves coordination between field teams, IT, billing, and vendors.
- Data-Driven Optimization: Supports data-driven decision making for rollout optimization.
- Measurable Business Value: Ensures smart meter investments translate into tangible operational and financial benefits.
KPIs to Track in Electric Power Retail Smart Meter Rollout Performance Dashboard
The following key KPIs can be tracked by using this dashboard:
- Rollout Completion (%): Measures the percentage of smart meters deployed against the total rollout plan
- Schedule Variance (Days): Tracks deviation from the planned rollout timeline
- Capex Utilization (%): Measures how effectively allocated capital is being deployed
- Daily Installation (meters/crew): Indicates field crew productivity and installation efficiency
- Installation Success Rate (%): Tracks the percentage of installations completed without rework
- Billing Enablement Rate (%): Measures how many installed meters are successfully enabled for billing
- Rollout Progress by Phase (%): Tracks completion across pilot, mass rollout, and final stages
- Installation Pace by Rollout Segment: Compares installation speed across urban, semi-urban, rural, and industrial areas
- Capex Spend Distribution (%): Shows how rollout investment is split across meters, installation, IT, and communication
- Vendor Execution Share (%): Tracks installation, commissioning, and rework contribution by vendor
- Meter Activation Progress (Count): Measures transition from installed to billing-active meters
- Open Issues by Function (Count): Tracks unresolved issues across IT, field operations, vendor management, and customer access
Frequently Asked Questions
Q1. What is the purpose of a smart meter rollout performance dashboard?
It helps retail utilities track deployment progress, control costs, manage vendors, and ensure installed meters are billing-ready.
Q2. How does this dashboard support AMI programs?
It provides structured visibility into installation, communication, validation, and billing activation stages of AMI rollouts.
Q3. Who uses this dashboard in a power retail utility?
Executive leadership, program managers, AMI teams, field operations, IT integration teams, and vendor management teams.