
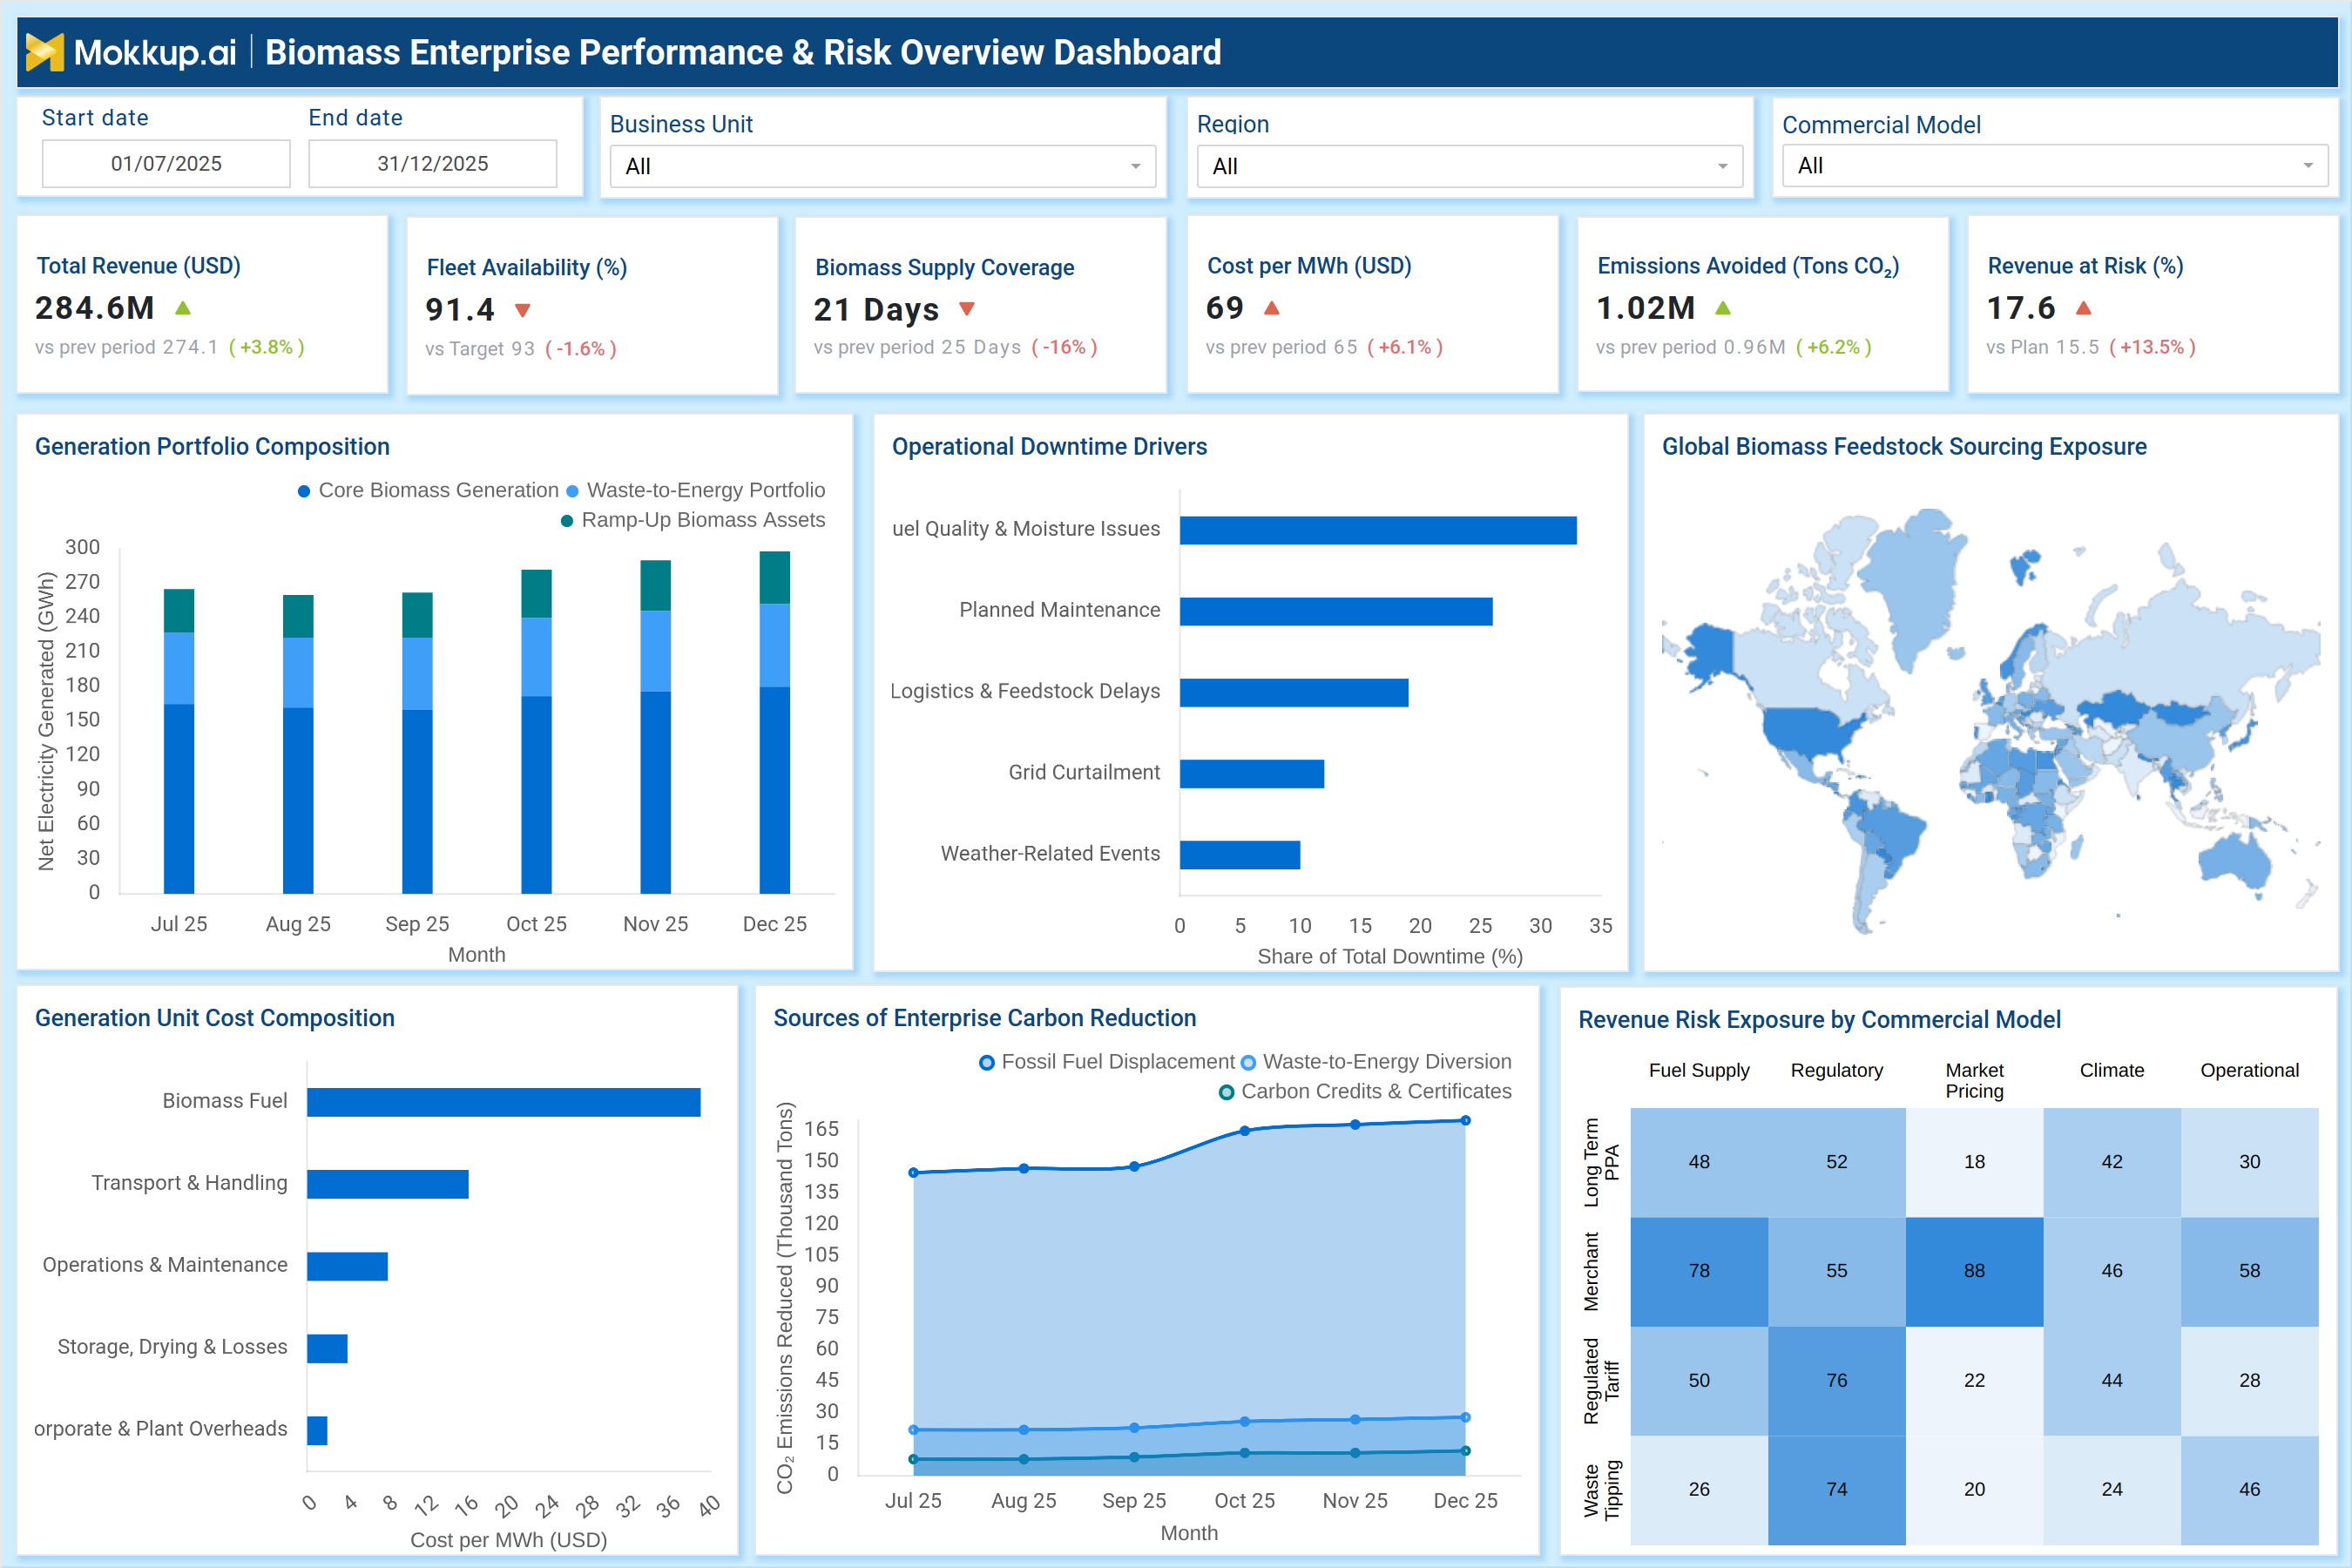
What is a Biomass Enterprise Performance & Risk Overview Dashboard?
A Biomass Enterprise Performance & Risk Overview Dashboard is a centralized analytics solution designed to monitor financial, operational, and risk performance across biomass and bioenergy power portfolios. It functions as a biomass enterprise performance dashboard, providing leadership with visibility into revenue, availability, cost efficiency, supply security, emissions impact, and risk exposure. The dashboard also acts as a biomass energy risk management dashboard, enabling utilities to track operational disruptions, fuel supply risks, cost volatility, and commercial exposure. By combining enterprise KPIs with risk indicators, it serves as a bioenergy enterprise performance monitoring tool, supporting strategic decision-making, performance benchmarking, and proactive risk control across biomass power operations.
How to Create a Biomass Enterprise Performance & Risk Overview Dashboard
You don’t need to build your report from scratch, just start with a ready-to-use dashboard template from Mokkup. Add in your data and export it however you like. Here’s how to do it:
1. Create or Log in to Your Mokkup Account
Start by signing up on Mokkup.ai using your email. If you already have an account, just log in, and you’ll be good to go.
2. Choose and Customize Your Dashboard Template
Find the Biomass Enterprise Performance & Risk Overview Dashboard template in the Templates section. Use the drag-and-drop editor to adjust KPIs, edit filters, or add elements based on your data.
3. Export to Your BI Tool
Once your dashboard wireframe is ready, use the BI Tool Export feature to send it directly to Power BI or Tableau for further analysis and enhancements. You can also download the dashboard as a PDF, PNG, or JPEG, embed it on a platform, or invite your team to collaborate.
Note: This is a Pro template. You’ll need a Pro subscription on Mokkup to use and customize this dashboard wireframe. Upgrade anytime to unlock full access.
Biomass Enterprise Performance & Risk Overview Dashboard Example
A typical dashboard begins with executive KPIs such as total revenue, fleet availability, biomass supply coverage, cost per MWh, emissions avoided, and revenue at risk. These metrics summarize enterprise-level performance and exposure at a glance. Portfolio composition visuals show electricity generation split across core biomass, waste-to-energy, and ramp-up assets. Operational downtime drivers highlight key sources of disruption, including fuel quality issues, planned maintenance, logistics delays, grid curtailment, and weather events. Global feedstock sourcing maps illustrate geographic exposure to biomass supply risk. Cost composition charts break down fuel, transport, storage, and operating costs. Carbon reduction trends demonstrate the contribution of enterprise sustainability, while revenue-risk heatmaps reveal exposure by commercial model. Together, these views deliver a complete biomass power financial performance overview and risk context.
How to Analyze Data in Biomass Enterprise Performance & Risk Overview Dashboard
Here is how you can analyze data from this dashboard:
- Start with total revenue to assess overall enterprise financial performance.
- Review fleet availability to identify reliability gaps across assets.
- Analyze biomass supply coverage days to assess fuel security risk.
- Track cost per MWh to monitor cost efficiency and margin pressure.
- Review emissions avoided to understand the sustainability impact.
- Monitor revenue at risk (%) to identify financial exposure.
- Analyze generation portfolio composition to evaluate asset mix balance.
- Review operational downtime drivers to identify dominant disruption causes.
- Study global feedstock sourcing exposure to assess supply concentration risk.
- Analyze generation unit cost composition to identify cost-reduction levers.
- Review enterprise carbon reduction sources for regulatory and ESG reporting.
- Use revenue risk exposure heatmaps to compare commercial model vulnerabilities.
Benefits of Biomass Enterprise Performance & Risk Overview Dashboard
The following are the benefits of using this dashboard:
- Provides a unified view of enterprise biomass performance.
- Improves visibility into operational and financial risk exposure.
- Supports proactive biomass utility operational risk analytics.
- Enhances fuel supply planning and sourcing decisions.
- Identifies cost drivers impacting profitability.
- Strengthens sustainability and emissions reporting.
- Enables early detection of revenue and margin risk.
- Supports executive-level performance monitoring.
- Improves strategic planning across biomass portfolios.
- Drives more resilient and data-driven enterprise operations.
KPIs to Track in Biomass Enterprise Performance & Risk Overview Dashboard
The following key KPIs can be tracked by using this dashboard:
- Total Revenue (USD) – Measures total enterprise-level revenue generated from biomass operations, indicating overall financial performance.
- Fleet Availability (%) – Shows the percentage of time biomass assets are operational and ready for generation, reflecting asset reliability and maintenance effectiveness.
- Biomass Supply Coverage (Days) – Indicates the number of days the current biomass inventory can support operations.
- Cost per MWh (USD) – Represents the average cost incurred to generate one megawatt-hour of electricity, highlighting operational and cost efficiency.
- Emissions Avoided (Tons CO₂) – Quantifies the amount of carbon emissions avoided by using biomass instead of fossil fuels, demonstrating sustainability impact.
- Revenue at Risk (%) – Estimates the percentage of revenue exposed to operational, market, or supply disruptions, signaling financial vulnerability.
- Generation by Portfolio Type – Breaks down energy generation across different biomass asset types or portfolios to evaluate asset mix performance.
Frequently Asked Questions
1. Who should use this dashboard?
Enterprise leaders, asset managers, finance teams, and risk managers in biomass utilities.
2. How does it support risk management?
By tracking supply, cost, operational, and commercial risk indicators together.
3. Can it support multi-region biomass portfolios?
Yes, it aggregates performance and risk data across regions and business units.