The Productivity Analytics Dashboard template offers organizations a comprehensive tool to assess and enhance their operational efficiency across various dimensions. By tracking key metrics such as the Kaizen Index, housekeeping standards, lean savings, and operational excellence, this dashboard wireframe provides valuable insights into productivity drivers and areas for improvement.
Productivity Analytics - Screen 1
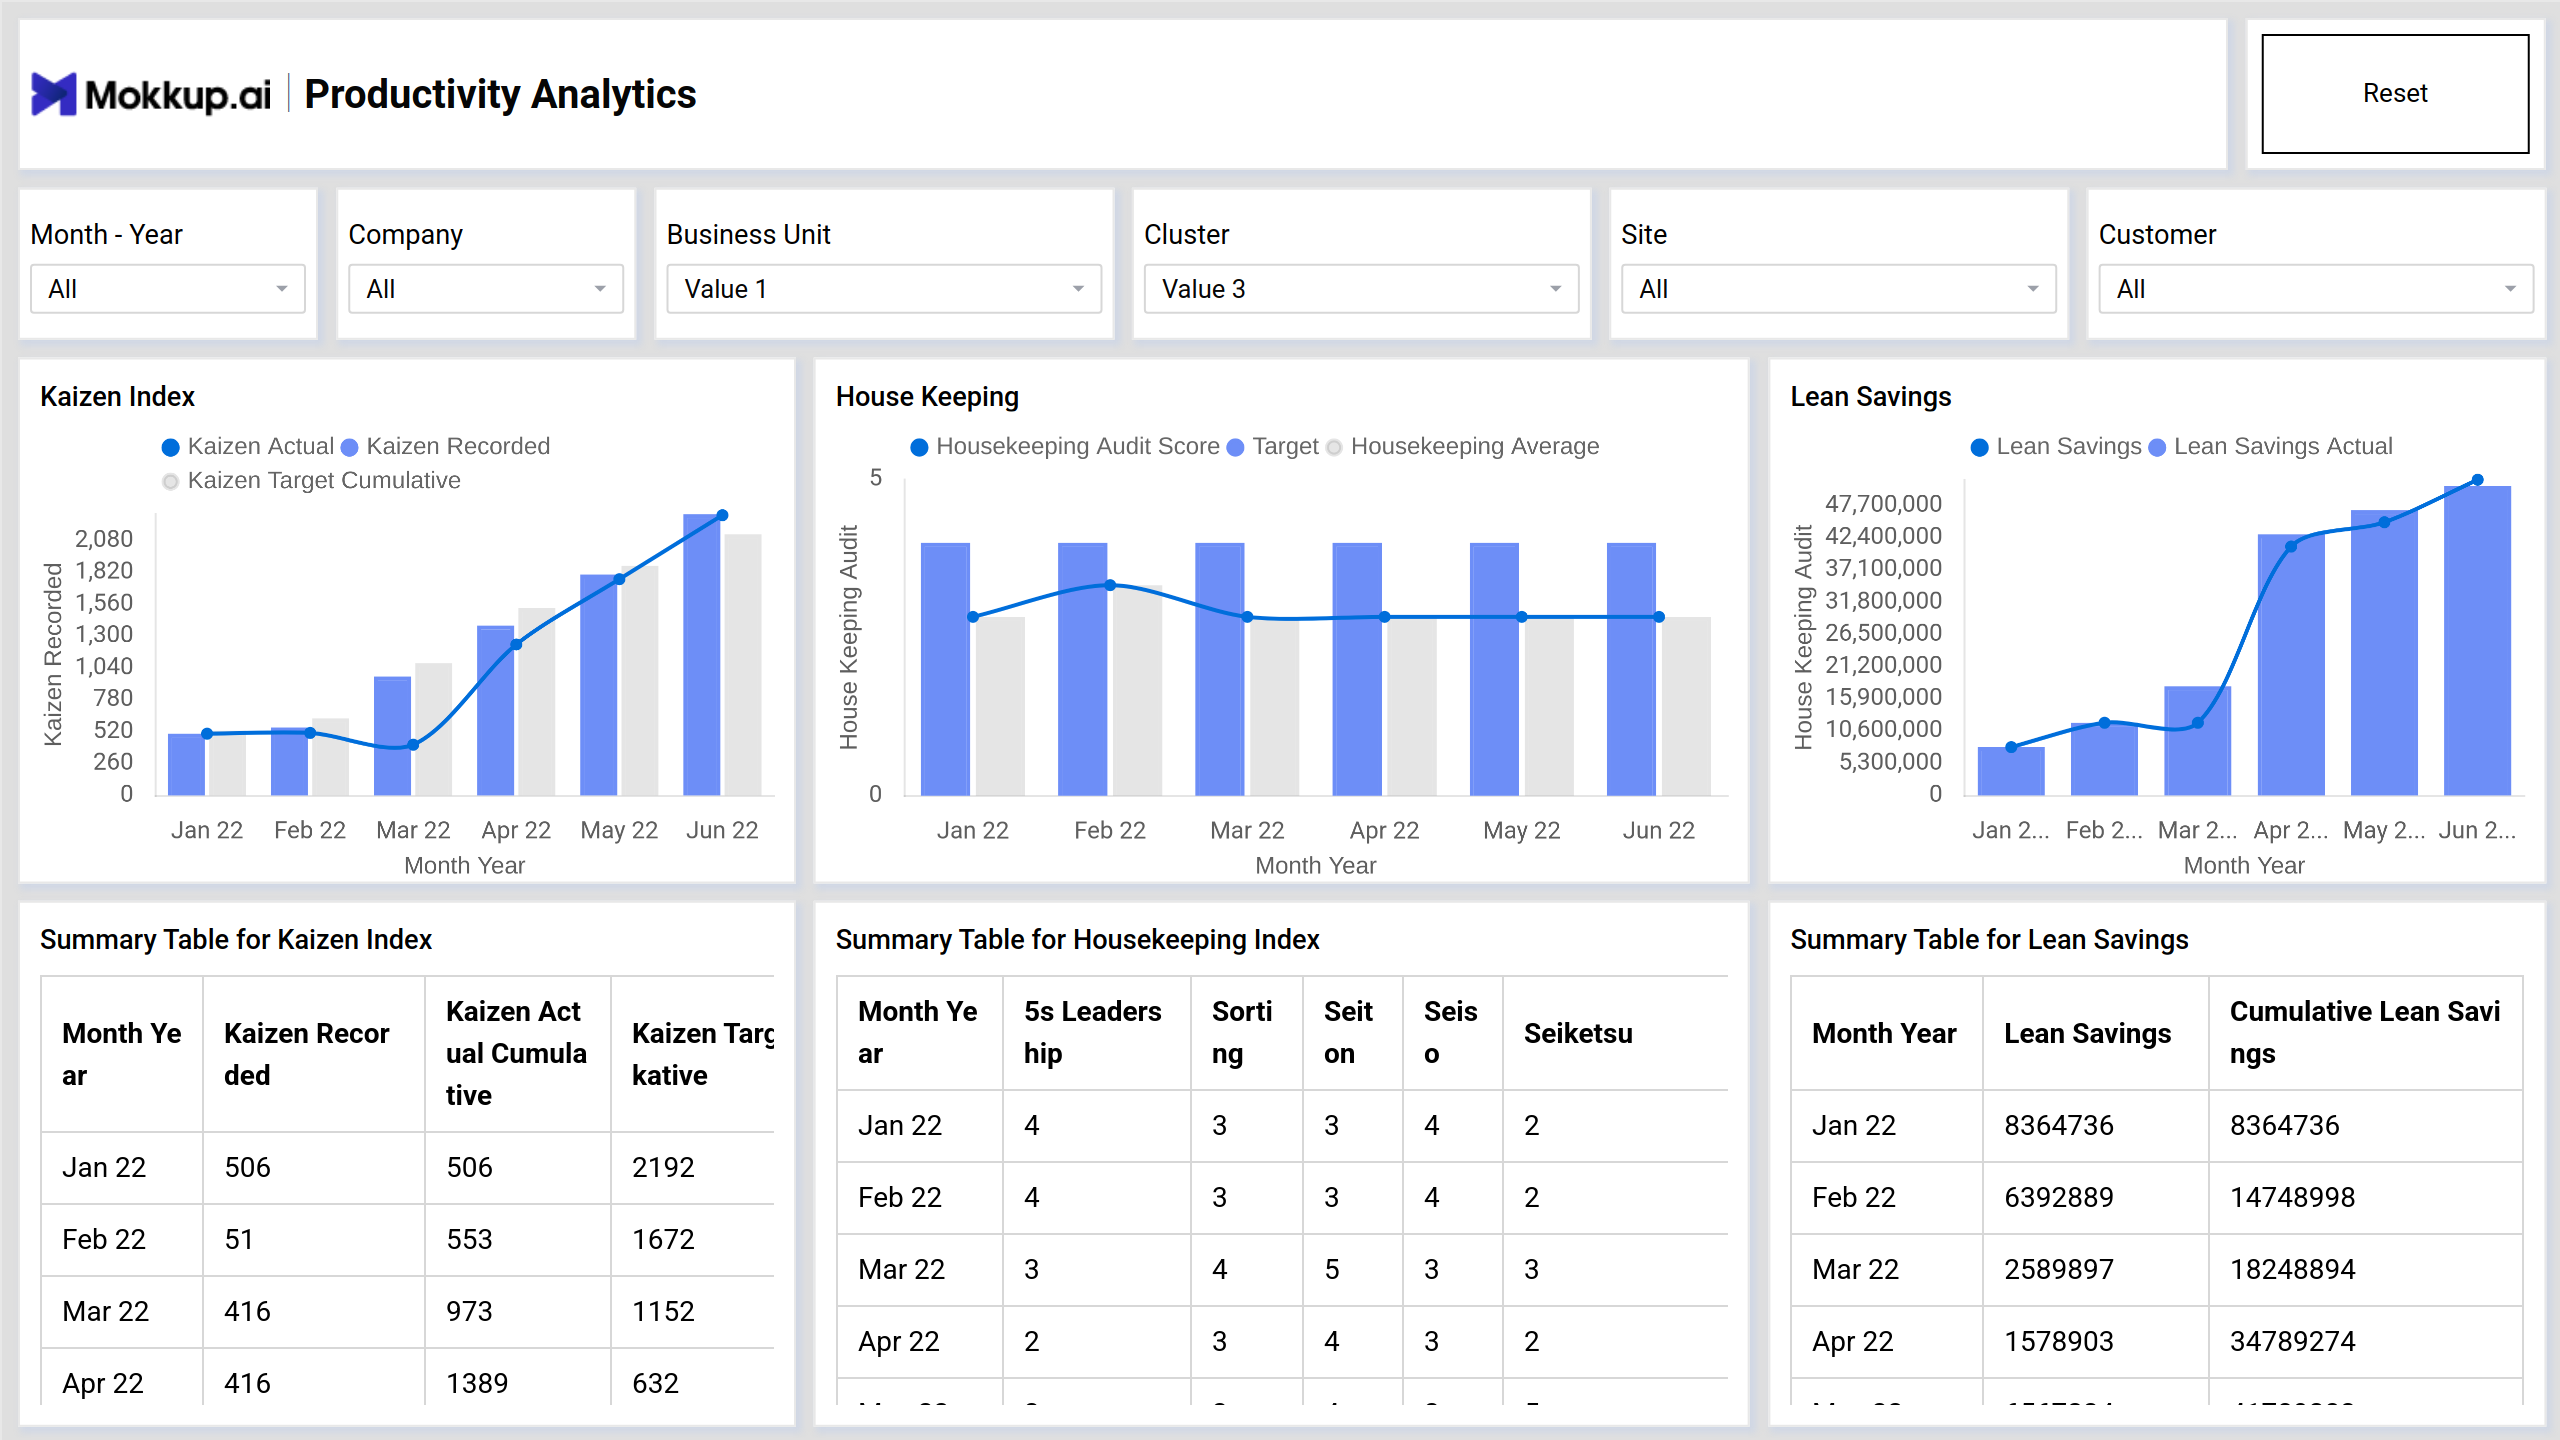
The Productivity Analytics screen provides concise details and summary tables that offer insights into critical productivity metrics, including the Kaizen Index, housekeeping standards, and lean savings.
Key Terms to Know
- Kaizen Index: Measures the effectiveness of continuous improvement efforts within the organization, tracking the implementation and impact of Kaizen initiatives on productivity and efficiency.
- Housekeeping: Evaluates the cleanliness and organization of workspaces, facilities, and equipment, which can directly impact employee morale, safety, and productivity.
- Lean Savings: Quantifies the cost savings and efficiency gains achieved through Lean manufacturing principles and practices, such as reducing waste, improving process flow, and optimizing resource utilization.
- Summary Tables: Showcase the Kaizen Index, housekeeping standards, and Lean savings. These tables provide a quick overview of continuous improvement efforts, housekeeping initiatives, and cost savings achieved through Lean practices.
Productivity Analytics - Screen 2
Productivity Analytics Screen 2 provides in-depth insights into the Operational Excellence Index (OEI), featuring a summary table with key performance indicators (KPIs), monthly targets, and achieved results for advanced 3PL, lower, and upper bounds.
It also includes trends for OEI identifiers and a table showing month-year trends in lean savings and cumulative savings, facilitating assessment of operational efficiency and supporting continuous improvement efforts.
Key Terms to Know
- Operational Excellence Index (OEI) Line Chart: Visualizes the OEI over time, providing a dynamic representation of operational performance.
- Summary Table: Presents key indicators of the OEI,including monthly target, advanced 3PL, lower, and upper bounds, offering a concise overview of performance metrics.
- OEI Identifiers Trend: Tracks trends in OEI identifiers, allowing organizations to identify patterns and areas for improvement in operational excellence.
- Trends Table: Displays month-year trends in lean savings and cumulative savings, enabling analysis of productivity enhancements and continuous improvement initiatives.
These metrics collectively offer valuable insights into operational efficiency, facilitating informed decision-making and driving ongoing optimization efforts.
Dashboard Template Insights
The dashboard wireframe provides comprehensive insights into:
- Key performance metrics such as the Operational Excellence Index (OEI), lean savings, and productivity indicators, enabling organizations to monitor and optimize operational performance effectively.
- By tracking trends in productivity metrics and identifying areas for improvement, businesses can implement targeted strategies to enhance efficiency, reduce costs, and drive continuous improvement initiatives.
- With access to detailed analytics and trend analysis, stakeholders can make informed decisions to streamline operations, allocate resources efficiently, and maximize productivity across various departments and processes.
Conclusion
The Productivity Analytics dashboard template serves as a vital tool for organizations seeking to optimize operational performance and drive sustainable growth. By leveraging data-driven insights and continuous monitoring of key metrics, businesses can identify opportunities for improvement and implement strategic initiatives.