What is an Electric Power Retail Green Energy Adoption Dashboard?
The Electric Power Retail Green Energy Adoption Dashboard is a structured analytics template designed for power retailers, energy program managers, and sustainability teams tracking the uptake of renewable energy offerings across their customer base. It functions as a green energy adoption dashboard for electric retailers, consolidating enrollment figures, emissions performance, billing impact, and compliance progress into a single unified view. The dashboard monitors how renewable products, including green tariffs, community solar, REC subscriptions, and EV charging plans, are performing across residential, commercial, and industrial segments. Teams managing ESG compliance achievement of electric power retail obligations, use this template to track progress against regulatory and voluntary sustainability targets without building custom reports from scratch. By combining financial, environmental, and customer metrics in one layout, this green energy adoption dashboard for electric retailers gives decision-makers a clear picture of where adoption is accelerating and where intervention is needed.
How to Create an Electric Power Retail Green Energy Adoption Dashboard
You don’t need to build your report from scratch; just start with a ready-to-use dashboard template from Mokkup. Add in your data and export it however you like. Here’s how to do it:
1. Create or Log in to Your Mokkup Account
Start by signing up on Mokkup.ai using your email. If you already have an account, just log in, and you'll be good to go.
2. Choose and Customize Your Dashboard Template
Find the Electric Power Retail Green Energy Adoption Dashboard template in the Templates section. Use the drag-and-drop editor to adjust KPIs, edit filters, or add elements based on your data.
3. Export to Your BI Tool
Once your dashboard wireframe is ready, use the BI Tool Export feature to send it directly to Power BI or Tableau for further analysis and enhancements. You can also download the dashboard as a PDF, PNG, or JPEG, embed it on a platform, or invite your team to collaborate.
Note: This is a Pro template. You'll need a Pro subscription on Mokkup to use and customize this dashboard wireframe. Upgrade anytime to unlock full access.
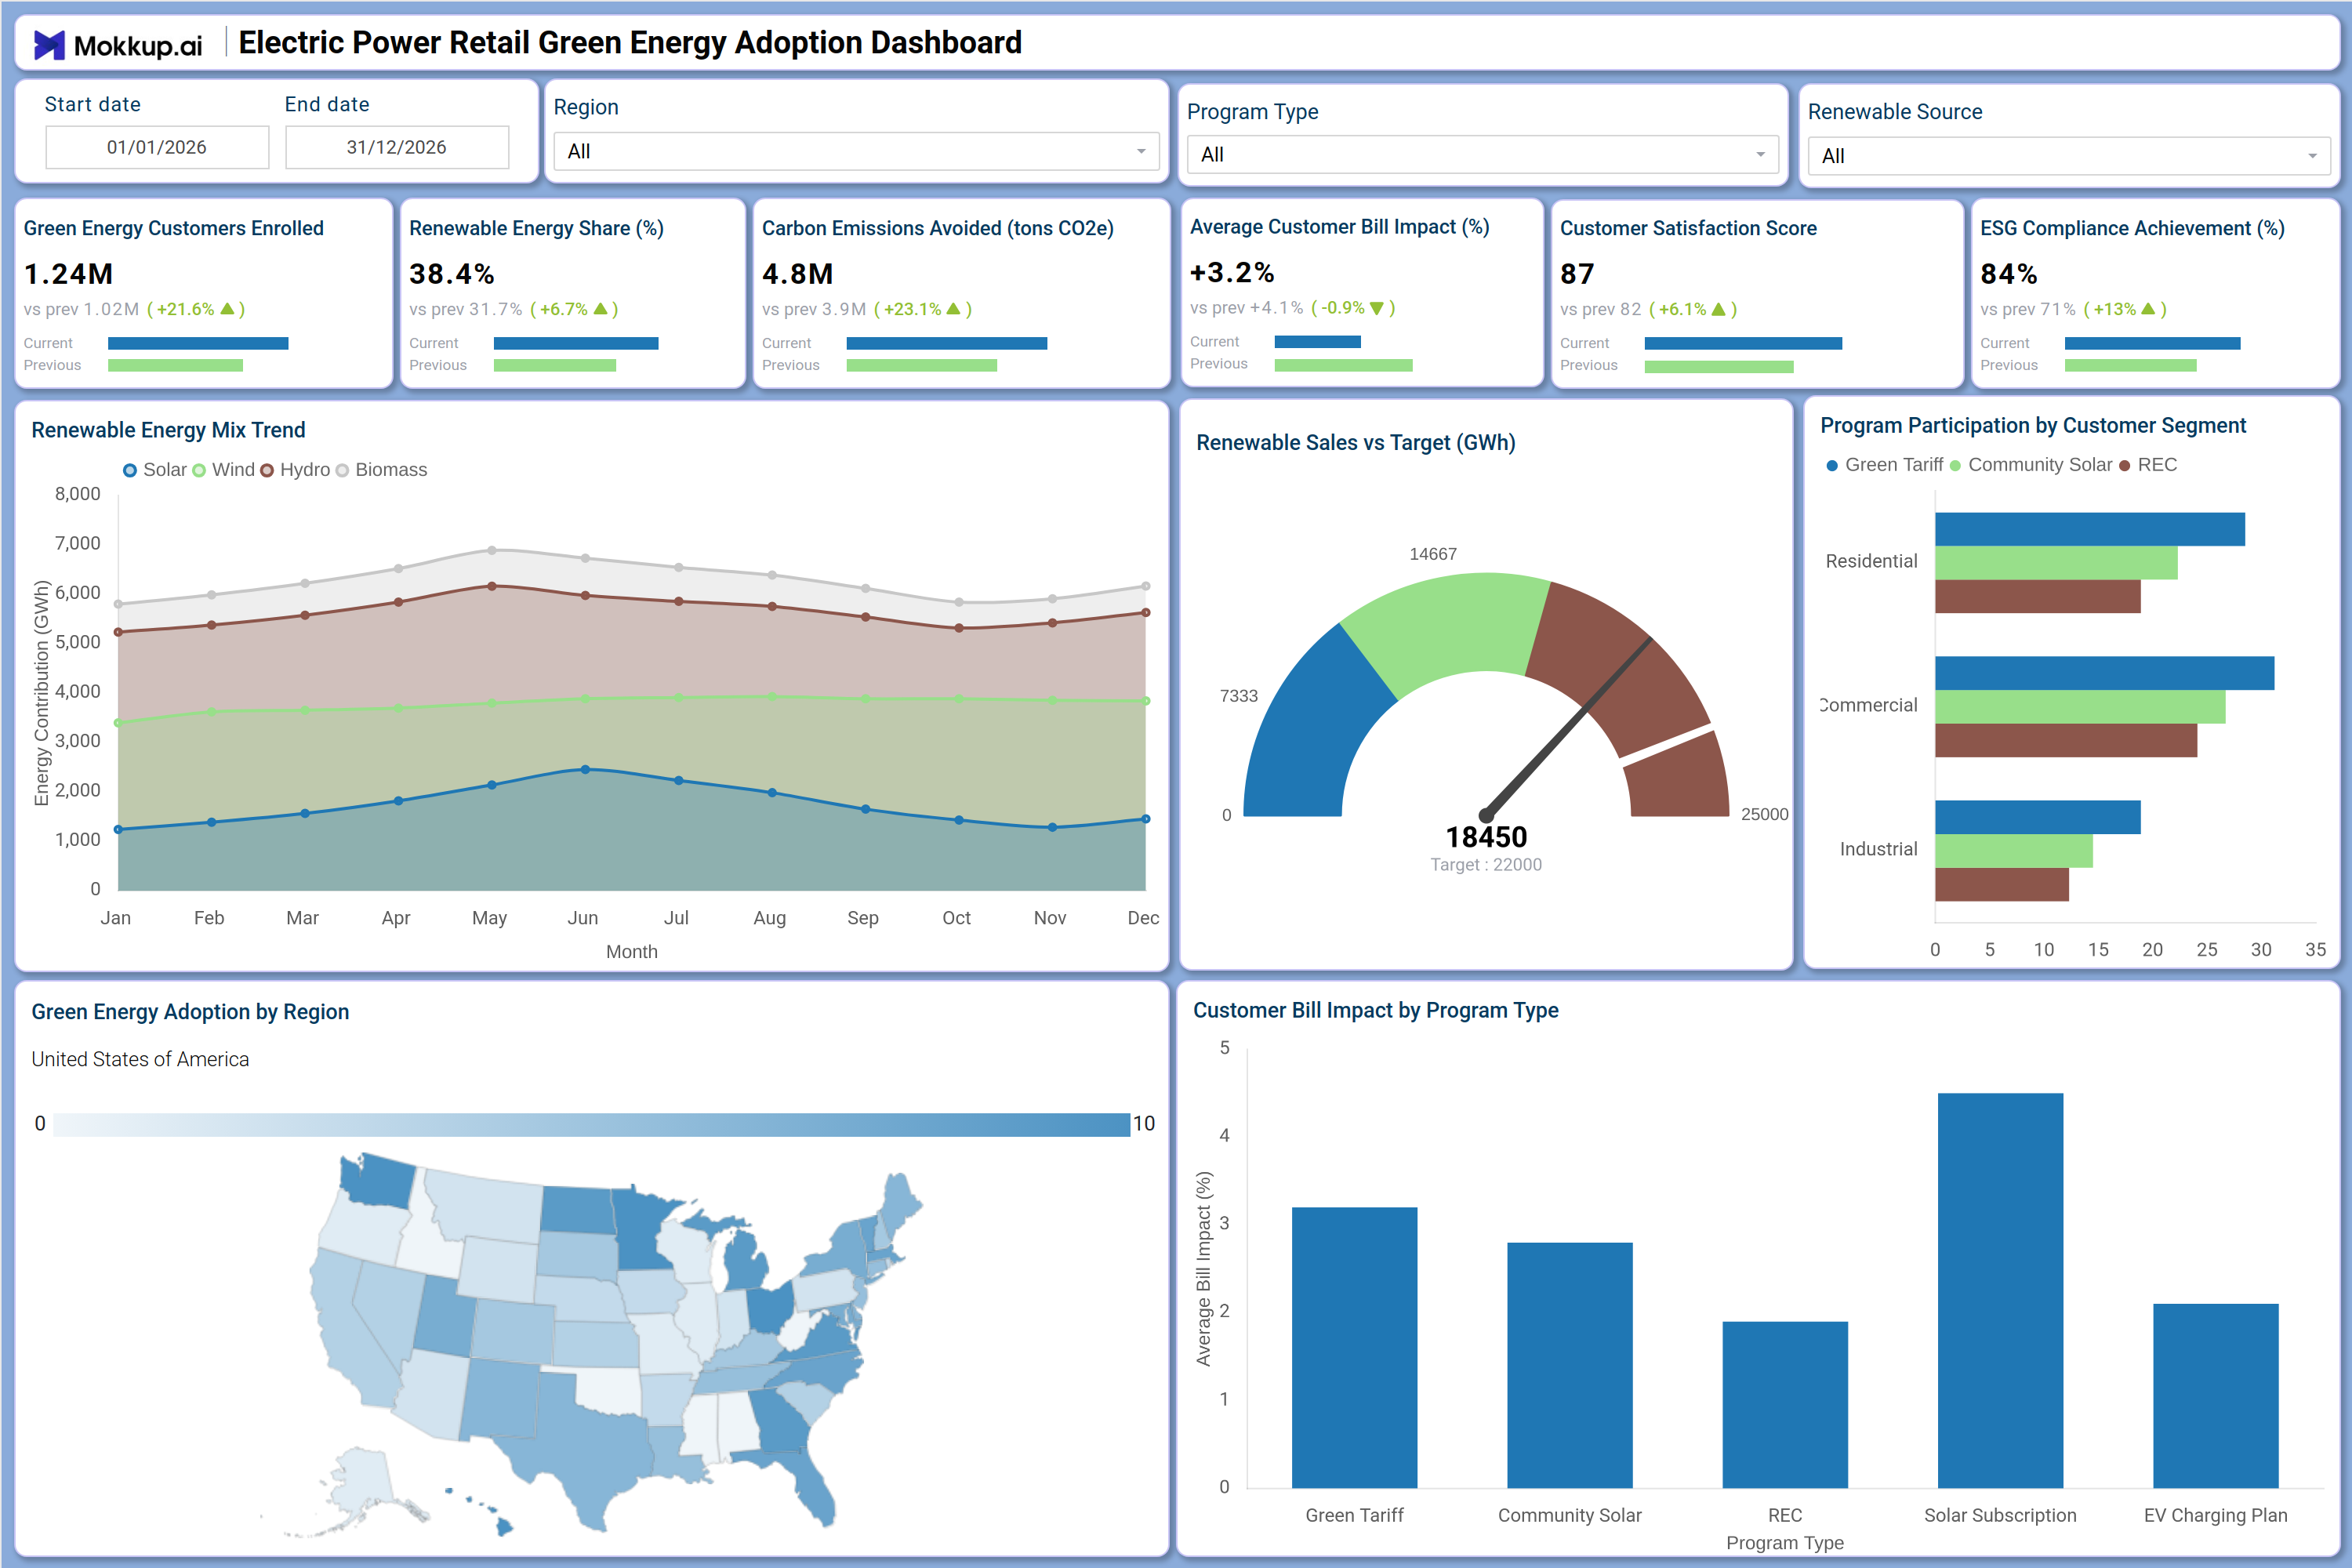
Electric Power Retail Green Energy Adoption Dashboard Example
An energy program manager opens this dashboard at the start of each reporting period to assess whether green energy enrollment is on pace with annual targets. The top KPI row immediately surfaces whether renewable energy share tracking for power utilities is trending upward and how avoided emissions are accumulating across the portfolio. If the gauge chart shows a gap between actual renewable sales and the set target, the team can investigate which program types are underperforming using the regional map and segment bar charts.
The Renewable Energy Mix Trend chart helps planners understand which energy sources, including solar, wind, hydro, and biomass, are driving consumption growth and where diversification is warranted. The carbon emissions avoided tracking dashboard view, built into the KPI row, allows analysts to evaluate whether avoided emissions align with cost-neutral or cost-positive outcomes for enrolled customers. Reviewing program participation by customer segment energy breakdowns enables retail energy teams to make faster decisions about which programs to scale, which regions to target, and how to report progress to ESG stakeholders.
How to Analyze Data in an Electric Power Retail Green Energy Adoption Dashboard
Here is how you can analyze data from this dashboard:
- Use the Region filter to isolate green energy adoption metrics for specific geographic markets and compare state-level performance.
- Apply the Program Type filter to drill into enrollment and bill impact data for individual offerings such as Green Tariff, Community Solar, or REC.
- Monitor the Renewable Energy Mix Trend chart to track which energy sources are growing and identify seasonal shifts in consumption patterns.
- Review the Renewable Sales vs Target gauge chart to assess whether the portfolio is on track against annual GWh targets.
- Analyze the Program Participation by Customer Segment bar chart to determine which segments are most engaged per program across residential, commercial, and industrial accounts.
- Use the Customer Bill Impact by Program Type bar chart to evaluate which programs carry the highest billing premium for enrolled customers.
- Filter by Renewable Source to compare adoption rates and customer satisfaction across solar, wind, hydro, and biomass offerings.
- Track the carbon emissions avoided tracking dashboard KPI over time to measure the cumulative environmental benefit of the portfolio.
Benefits of a Electric Power Retail Green Energy Adoption Dashboard
The following are the benefits of using this dashboard:
- Centralizes enrollment, emissions, billing, and compliance metrics across all green energy programs in one structured template.
- Supports renewable energy share tracking for power utilities across multiple program types and customer segments simultaneously.
- Reduces manual data compilation for sustainability reporting with pre-built KPI tiles covering enrollment, satisfaction, and compliance.
- Enables region-level analysis of customer bill impact of green energy programs to guide geographic expansion and pricing decisions.
- Provides a segmented breakdown of program participation by customer segment energy data for operational and marketing planning.
- Helps energy program managers align green retail portfolios with ESG compliance achievement and electric power retail requirements.
- Gives commercial teams and sustainability leads a shared view of renewable sales performance versus annual targets.
KPIs to Track in a Electric Power Retail Green Energy Adoption Dashboard
The following key KPIs can be tracked by using this dashboard:
- Green Energy Customers Enrolled: The primary volume metric in this green energy adoption dashboard for electric retailers tracks total enrolled customers to measure program reach and growth.
- Renewable Energy Share (%): Measures the proportion of total energy consumption sourced from renewables, essential for renewable energy share tracking for power utilities against grid and regulatory benchmarks.
- Carbon Emissions Avoided (tons CO2e): The carbon emissions avoided tracking dashboard KPI quantifies the cumulative environmental benefit of the green portfolio and demonstrates sustainability impact to stakeholders.
- Average Customer Bill Impact (%): Measures the average percentage change in customer bills attributable to green program enrollment, key to evaluating customer bill impact of green energy programs across the portfolio.
- Customer Satisfaction Score: Evaluates customer sentiment toward enrolled programs, a leading indicator of retention risk and overall program quality.
- ESG Compliance Achievement (%): Tracks the organization's progress toward ESG targets across all active programs, core to ESG compliance achievement, electric power retail reporting for regulators and investors.
Frequently Asked Questions
1. What industries benefit most from the Electric Power Retail Green Energy Adoption Dashboard?
This dashboard is built for electric power retailers, utility sustainability teams, and energy program managers overseeing green tariffs, community solar, and REC programs. ESG reporting analysts and commercial energy advisors also benefit from its compliance and segment-level views.
2. Can this dashboard track performance across multiple renewable energy source types?
Yes. The Renewable Energy Mix Trend chart breaks down energy consumption by Solar, Wind, Hydro, and Biomass over a full annual cycle. The Renewable Source filter allows users to isolate any single source for focused analysis.
3. Is this dashboard suitable for ESG compliance reporting?
Yes. The ESG Compliance Achievement KPI tile and carbon emissions avoided tracking dashboard metric give sustainability teams the core data points needed for ESG disclosures. The layout supports regular reporting cycles without manual aggregation.