What is an Electric Power Transmission Revenue Performance & Collections Dashboard?
An Electric Power Transmission Revenue Performance & Collections Dashboard is a centralized analytics solution designed for Transmission System Operators (TSOs) to monitor billing, revenue realization, outstanding dues, and collections efficiency across the transmission network. It consolidates financial and operational data related to power transmission tariffs, customer billing, payments received, overdue amounts, and receivables aging into a single, interactive view. This type of electric grid transmission billing and collections dashboard enables transmission utilities to track financial performance across various customer types, regions, and contract structures, while ensuring alignment with regulated tariff mechanisms. By providing visibility into revenue inflows and payment behavior, the dashboard supports accurate cash flow management, revenue assurance, and regulatory reporting for transmission utilities.
How to Create an Electric Power Transmission Revenue Performance & Collections Dashboard
You don’t need to build your report from scratch, just start with a ready-to-use dashboard template from Mokkup. Add in your data and export it however you like. Here’s how to do it:
1. Create or Log in to Your Mokkup Account
Start by signing up on Mokkup.ai using your email. If you already have an account, just log in, and you’ll be good to go.
2. Choose and Customize Your Dashboard Template
Find the Electric Power Transmission Revenue Performance & Collections Dashboard in the Templates section. Use the drag-and-drop editor to adjust KPIs, edit filters, or add elements based on your data.
3. Export to Your BI Tool
Once your dashboard wireframe is ready, use the BI Tool Export feature to send it directly to Power BI or Tableau for further analysis and enhancements. You can also download the dashboard as a PDF, PNG, or JPEG, embed it on a platform, or invite your team to collaborate.
Note: This is a Pro template. You’ll need a Pro subscription on Mokkup to use and customize this dashboard wireframe. Upgrade anytime to unlock full access.
Electric Power Transmission Revenue Performance & Collections Dashboard Example
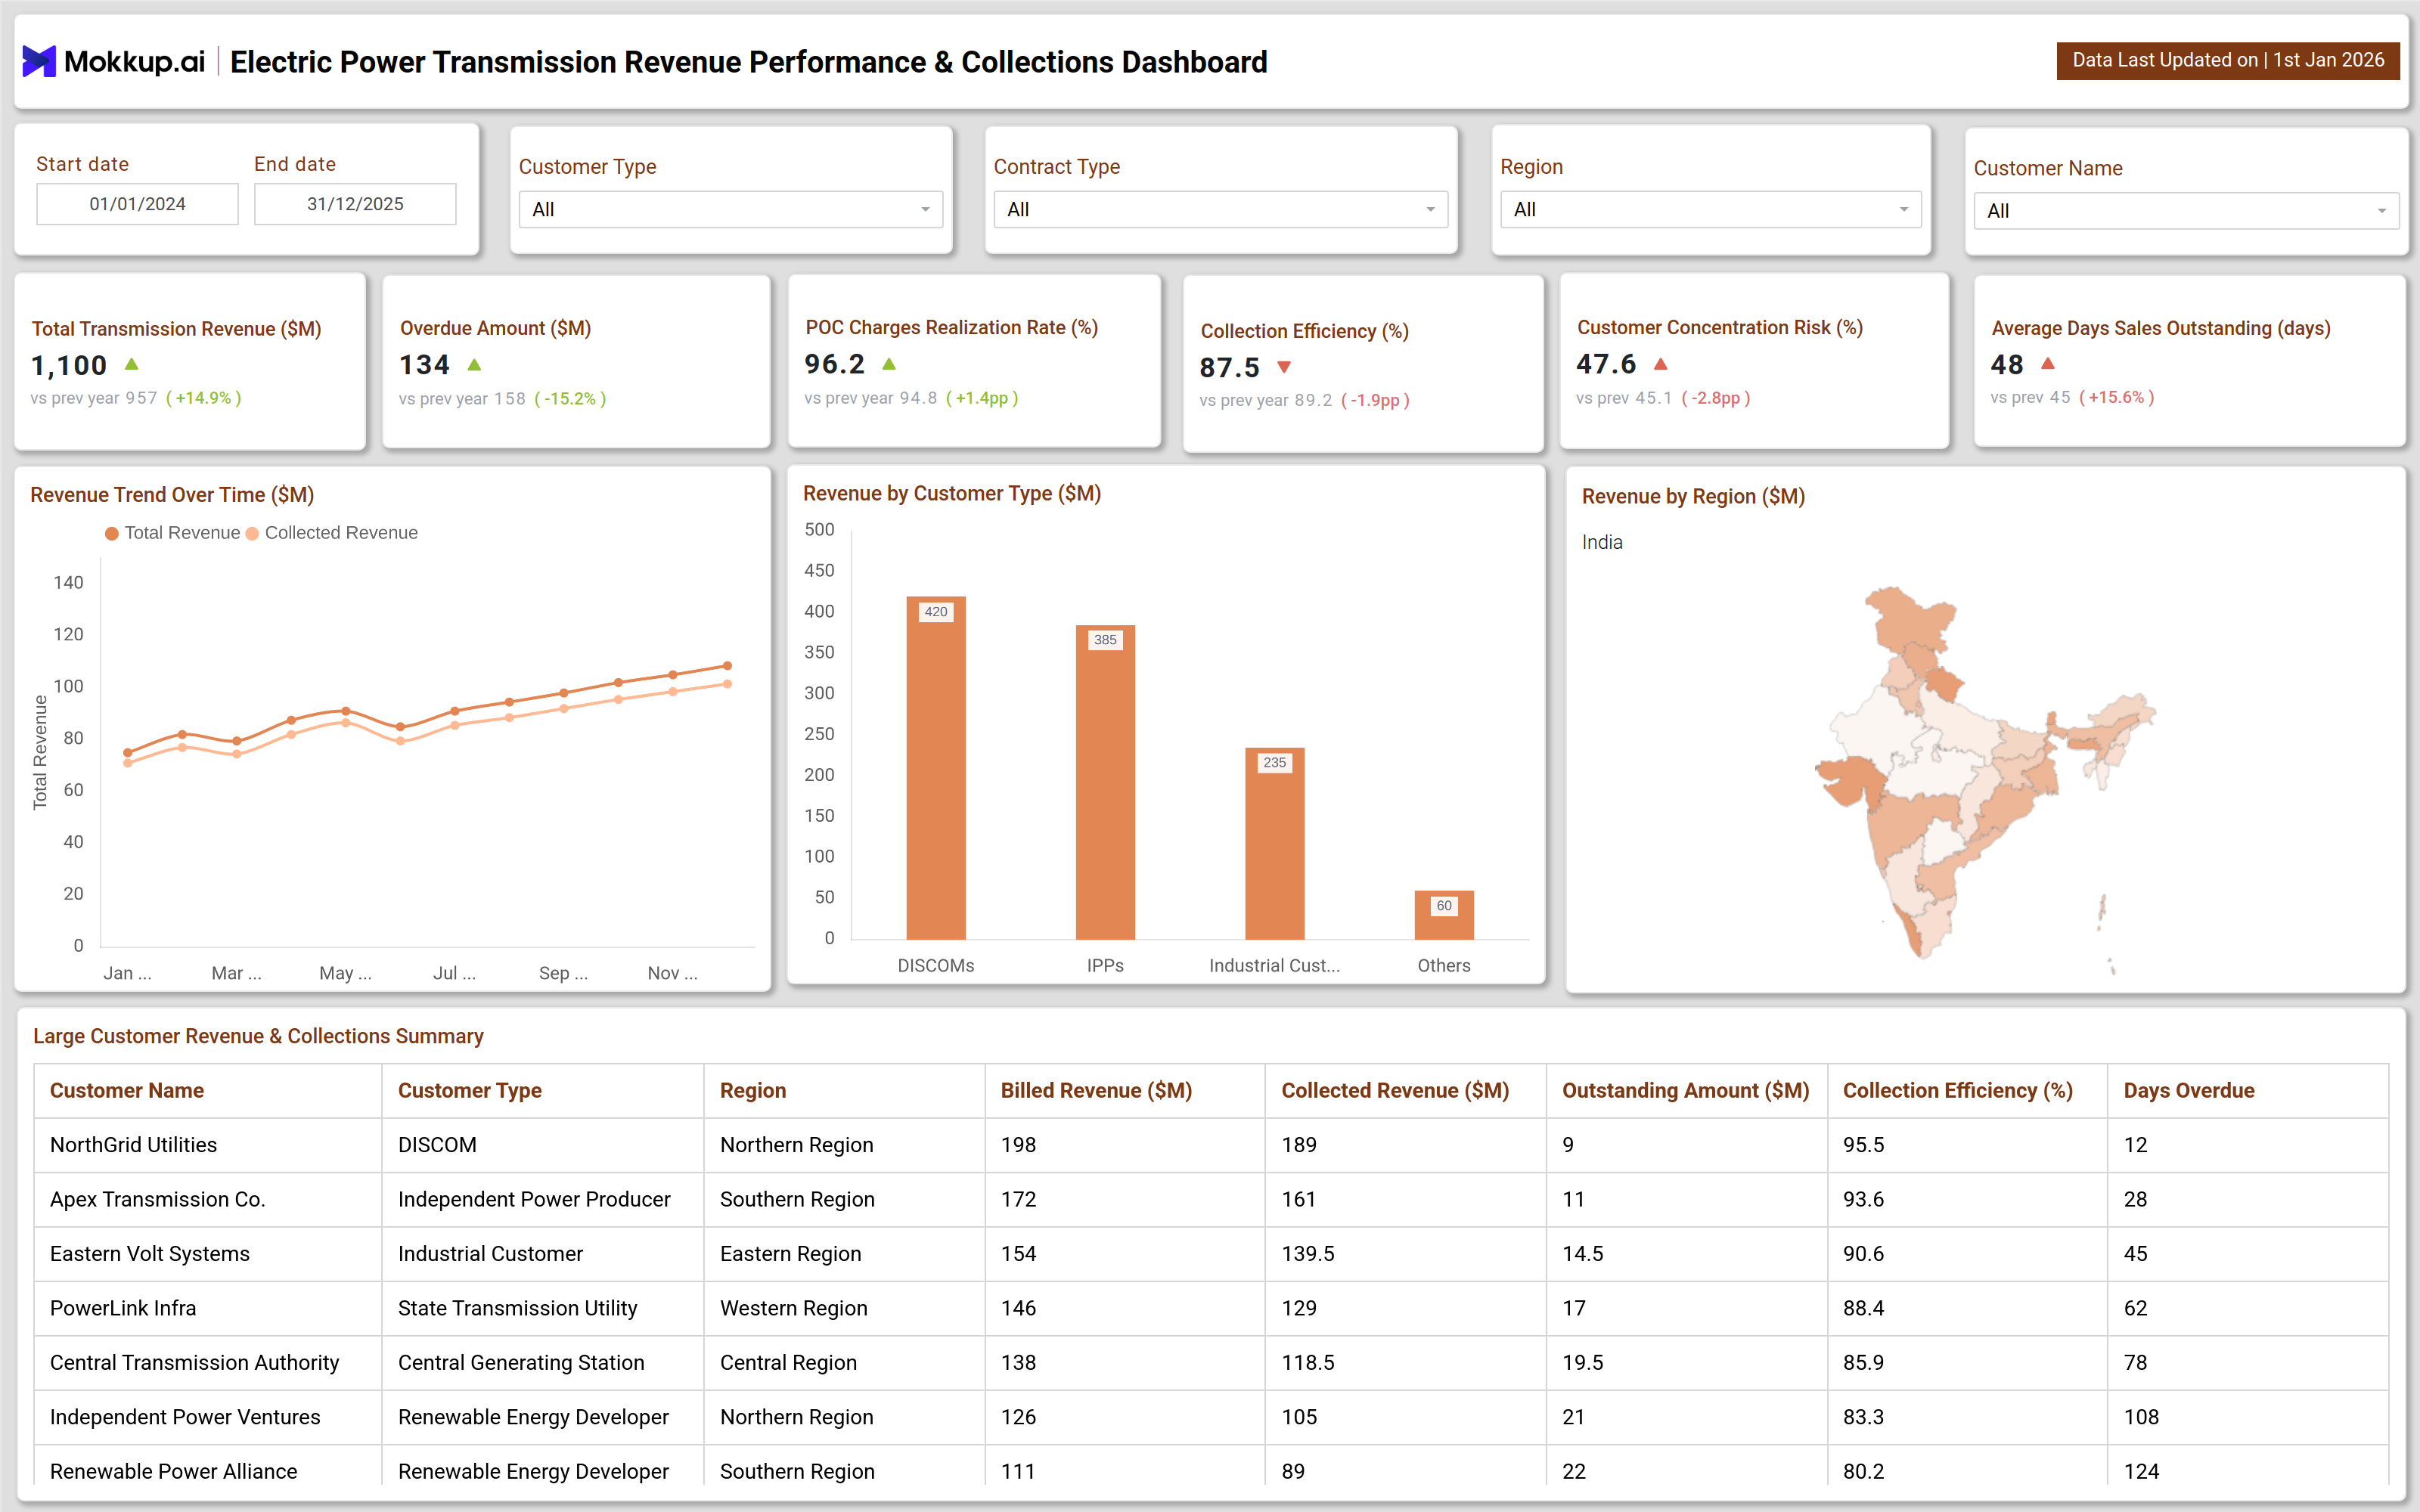
A typical TSO revenue performance and payment collections dashboard includes high-level KPIs, trend analysis, customer-level summaries, and regional performance views. As shown in the example, users can filter data by date range, customer type, contract type, region, and customer name to perform targeted analysis. Key financial indicators such as total transmission revenue, overdue amount, collection efficiency, customer concentration risk, and average days sales outstanding (DSO) are displayed prominently for quick assessment. Visuals such as revenue trends over time, revenue by customer category, and geographic revenue distribution provide clear insights into how transmission revenue is generated and collected. A detailed customer table further breaks down billed revenue, collected revenue, outstanding balances, and overdue days, making this a practical dashboard for financial operations in transmission utilities, supporting daily decision-making.
How to Analyze Data in Electric Power Transmission Revenue Performance & Collections Dashboard
Here is how you can analyze data from this dashboard:
- Track Total Transmission Revenue vs. Collected Revenue: Compare billed transmission revenue against actual collections to identify realization gaps, leakage points, or billing-to-cash process inefficiencies that may be impacting overall revenue recovery.
- Monitor Overdue Amounts and Aging Trends: Analyze receivables by aging buckets (0–30, 31–60, 61–90, 90+ days) to understand where delays are occurring and prioritize collection actions based on risk and severity.
- Analyze Collection Efficiency by Customer Type and Region: Measure collection efficiency percentages across industrial, commercial, and other customer segments, as well as by geography, to uncover structural differences in payment behavior.
- Compare Month-over-Month Revenue Trends: Track revenue movements over time to detect seasonal fluctuations, demand shifts, or persistent declines that may indicate underlying operational or market issues.
- Assess Customer Concentration Risk: Evaluate how much revenue depends on a small set of large customers to understand exposure and reduce dependency risks that could impact cash flow stability.
- Review Average Days’ Sales Outstanding (DSO): Use DSO to assess how quickly receivables are converted into cash and identify whether collection cycles are improving or deteriorating.
- Identify Chronic Defaulters at Customer Level: Drill down into individual customer records to flag repeat defaulters, and design targeted recovery or credit-control strategies.
- Analyze Revenue by Contract Type: Segment revenue by contract categories to ensure tariff structures are being applied correctly and to validate compliance with contractual terms.
- Evaluate Regional Revenue Performance: Compare revenue and collections across regions to pinpoint operational bottlenecks, billing issues, or local process gaps.
- Apply Filters for Root Cause Analysis: Use filters by customer, region, or time period to isolate anomalies and perform focused investigations into specific problem areas.
Benefits of Electric Power Transmission Revenue Performance & Collections Dashboard
The following are the benefits of using this dashboard:
- Improves Visibility into Transmission Revenue and Collections: Provides a consolidated view of billed revenue, realized revenue, and payments received, enabling stakeholders to clearly understand overall financial performance.
- Enables Proactive Monitoring of Overdue and At-Risk Receivables: Helps teams identify receivables that are likely to become overdue so corrective actions can be taken before cash flow is impacted.
- Supports Better Cash Flow Forecasting and Working Capital Planning: Uses historical trends and current receivables data to generate more accurate cash inflow projections and optimize working capital.
- Enhances Transparency in Billing and Tariff Realization: Ensures billed amounts align with approved tariffs and contractual terms, reducing disputes and increasing trust in reported numbers.
- Reduces Revenue Leakage Through Early Issue Detection: Surfaces anomalies, mismatches, and missing collections early, allowing faster resolution and preventing long-term revenue loss.
- Strengthens Regulatory and Audit Readiness: Maintains consistent, traceable financial records that simplify audits and support compliance with regulatory reporting requirements.
- Improves Decision-Making with Centralized Financial Insights: Brings all revenue and collections data into a single analytics layer, enabling faster and more confident business decisions.
- Helps Prioritize Collection Efforts by Risk and Exposure: Ranks customers and receivables based on risk, value, and aging so collection teams can focus on the most critical cases.
- Aligns Finance and Operations Teams Around One Data Source: Creates a shared source of truth that improves collaboration and reduces discrepancies between departments.
- Serves as a Unified Transmission Revenue & Collections Analytics Platform: Acts as a comprehensive platform for monitoring, analyzing, and optimizing power transmission revenue and collections performance.
KPIs to Track in Electric Power Transmission Revenue Performance & Collections Dashboard
The following electric power transmission collections performance metrics can be tracked by using this dashboard:
- Total Transmission Revenue - Total billed revenue generated from power transmission services within the selected period.
- Collected Revenue - Actual revenue received against billed transmission charges during the reporting period.
- Overdue Amount - Portion of billed transmission revenue that remains unpaid beyond the due date.
- Collection Efficiency (%) - Percentage of billed revenue successfully collected, indicating overall payment performance.
- Average Days Sales Outstanding (DSO) - Average number of days taken to collect payments after billing.
- Customer Concentration Risk (%) - Share of total revenue contributed by top customers, highlighting dependency risk.
- Revenue by Customer Type - Distribution of transmission revenue across customer categories such as DISCOMs, IPPs, and industrial customers.
- Revenue by Region - Transmission revenue contribution segmented by geographic regions.
- Outstanding Amount by Customer - Unpaid transmission charges aggregated at an individual customer level.
- Days Overdue by Customer - Number of days payments are overdue for each customer, used to assess default risk.
Frequently Asked Questions
1. What is the primary purpose of a transmission revenue dashboard?
The primary purpose is to provide a single view of billing, collections, overdue amounts, and revenue trends for transmission utilities, enabling better financial control.
2. Who should use this dashboard?
This dashboard is designed for TSOs, transmission utility finance teams, revenue assurance teams, and senior management.
3. How does this dashboard help improve collections efficiency?
By highlighting overdue amounts, aging trends, and customer-specific risks, it enables focused and timely collections actions, supporting power transmission collections efficiency monitoring.
4. Is this dashboard suitable for regulatory reporting?
Yes, it supports regulatory compliance by providing accurate, auditable revenue and collections data.
5. How often should the data be updated?
Ideally, data should be updated daily or weekly to ensure timely monitoring of revenue and collections performance.