
What is an Electric Power Retail Center Revenue & Margin Performance Dashboard?
An Electric Power Retail Center Revenue & Margin Performance Dashboard is a data-driven analytics tool designed to monitor financial health, revenue trends, and cost efficiency for retail power utilities. It consolidates key metrics such as total energy revenue, procurement costs, gross margin, customer count, outstanding receivables expense, and revenue per customer into a single, interactive interface. This dashboard helps utility managers, financial analysts, and executives assess profitability, identify cost-saving opportunities, and optimize pricing strategies. By tracking energy procurement costs by tariff type, customer segmentation, and geographic performance, utilities can make informed decisions on supply chain management, billing efficiency, and revenue optimization. The dashboard also highlights outstanding receivables trends, enabling proactive measures to reduce financial losses. Unlike traditional spreadsheets, this tool provides insights, allowing utilities to respond quickly to market changes, regulatory shifts, and customer demand fluctuations.
How to Create an Electric Power Retail Center Revenue & Margin Performance Dashboard
You don't need to build your report from scratch, just start with a ready-to-use dashboard template from Mokkup. Add in your data and export it however you like. Here's how to do it:
1. Create or Log in to Your Mokkup Account
Start by signing up on Mokkup.ai using your email. If you already have an account, just log in, and you'll be good to go.
2. Choose and Customize Your Dashboard Template
Find the Electric Power Retail Center Revenue & Margin Performance Dashboard template in the Templates section. Use the drag-and-drop editor to adjust KPIs, edit filters, or add elements based on your data.
3. Export to Your BI Tool
Once your dashboard wireframe is ready, use the BI Tool Export feature to send it directly to Power BI or Tableau for further analysis and enhancements. You can also download the dashboard as a PDF, PNG, or JPEG, embed it on a platform, or invite your team to collaborate.
Note: This is a Pro template. You'll need a Pro subscription on Mokkup to use and customize this dashboard wireframe. Upgrade anytime to unlock full access.
Electric Power Retail Center Revenue & Margin Performance Dashboard Example
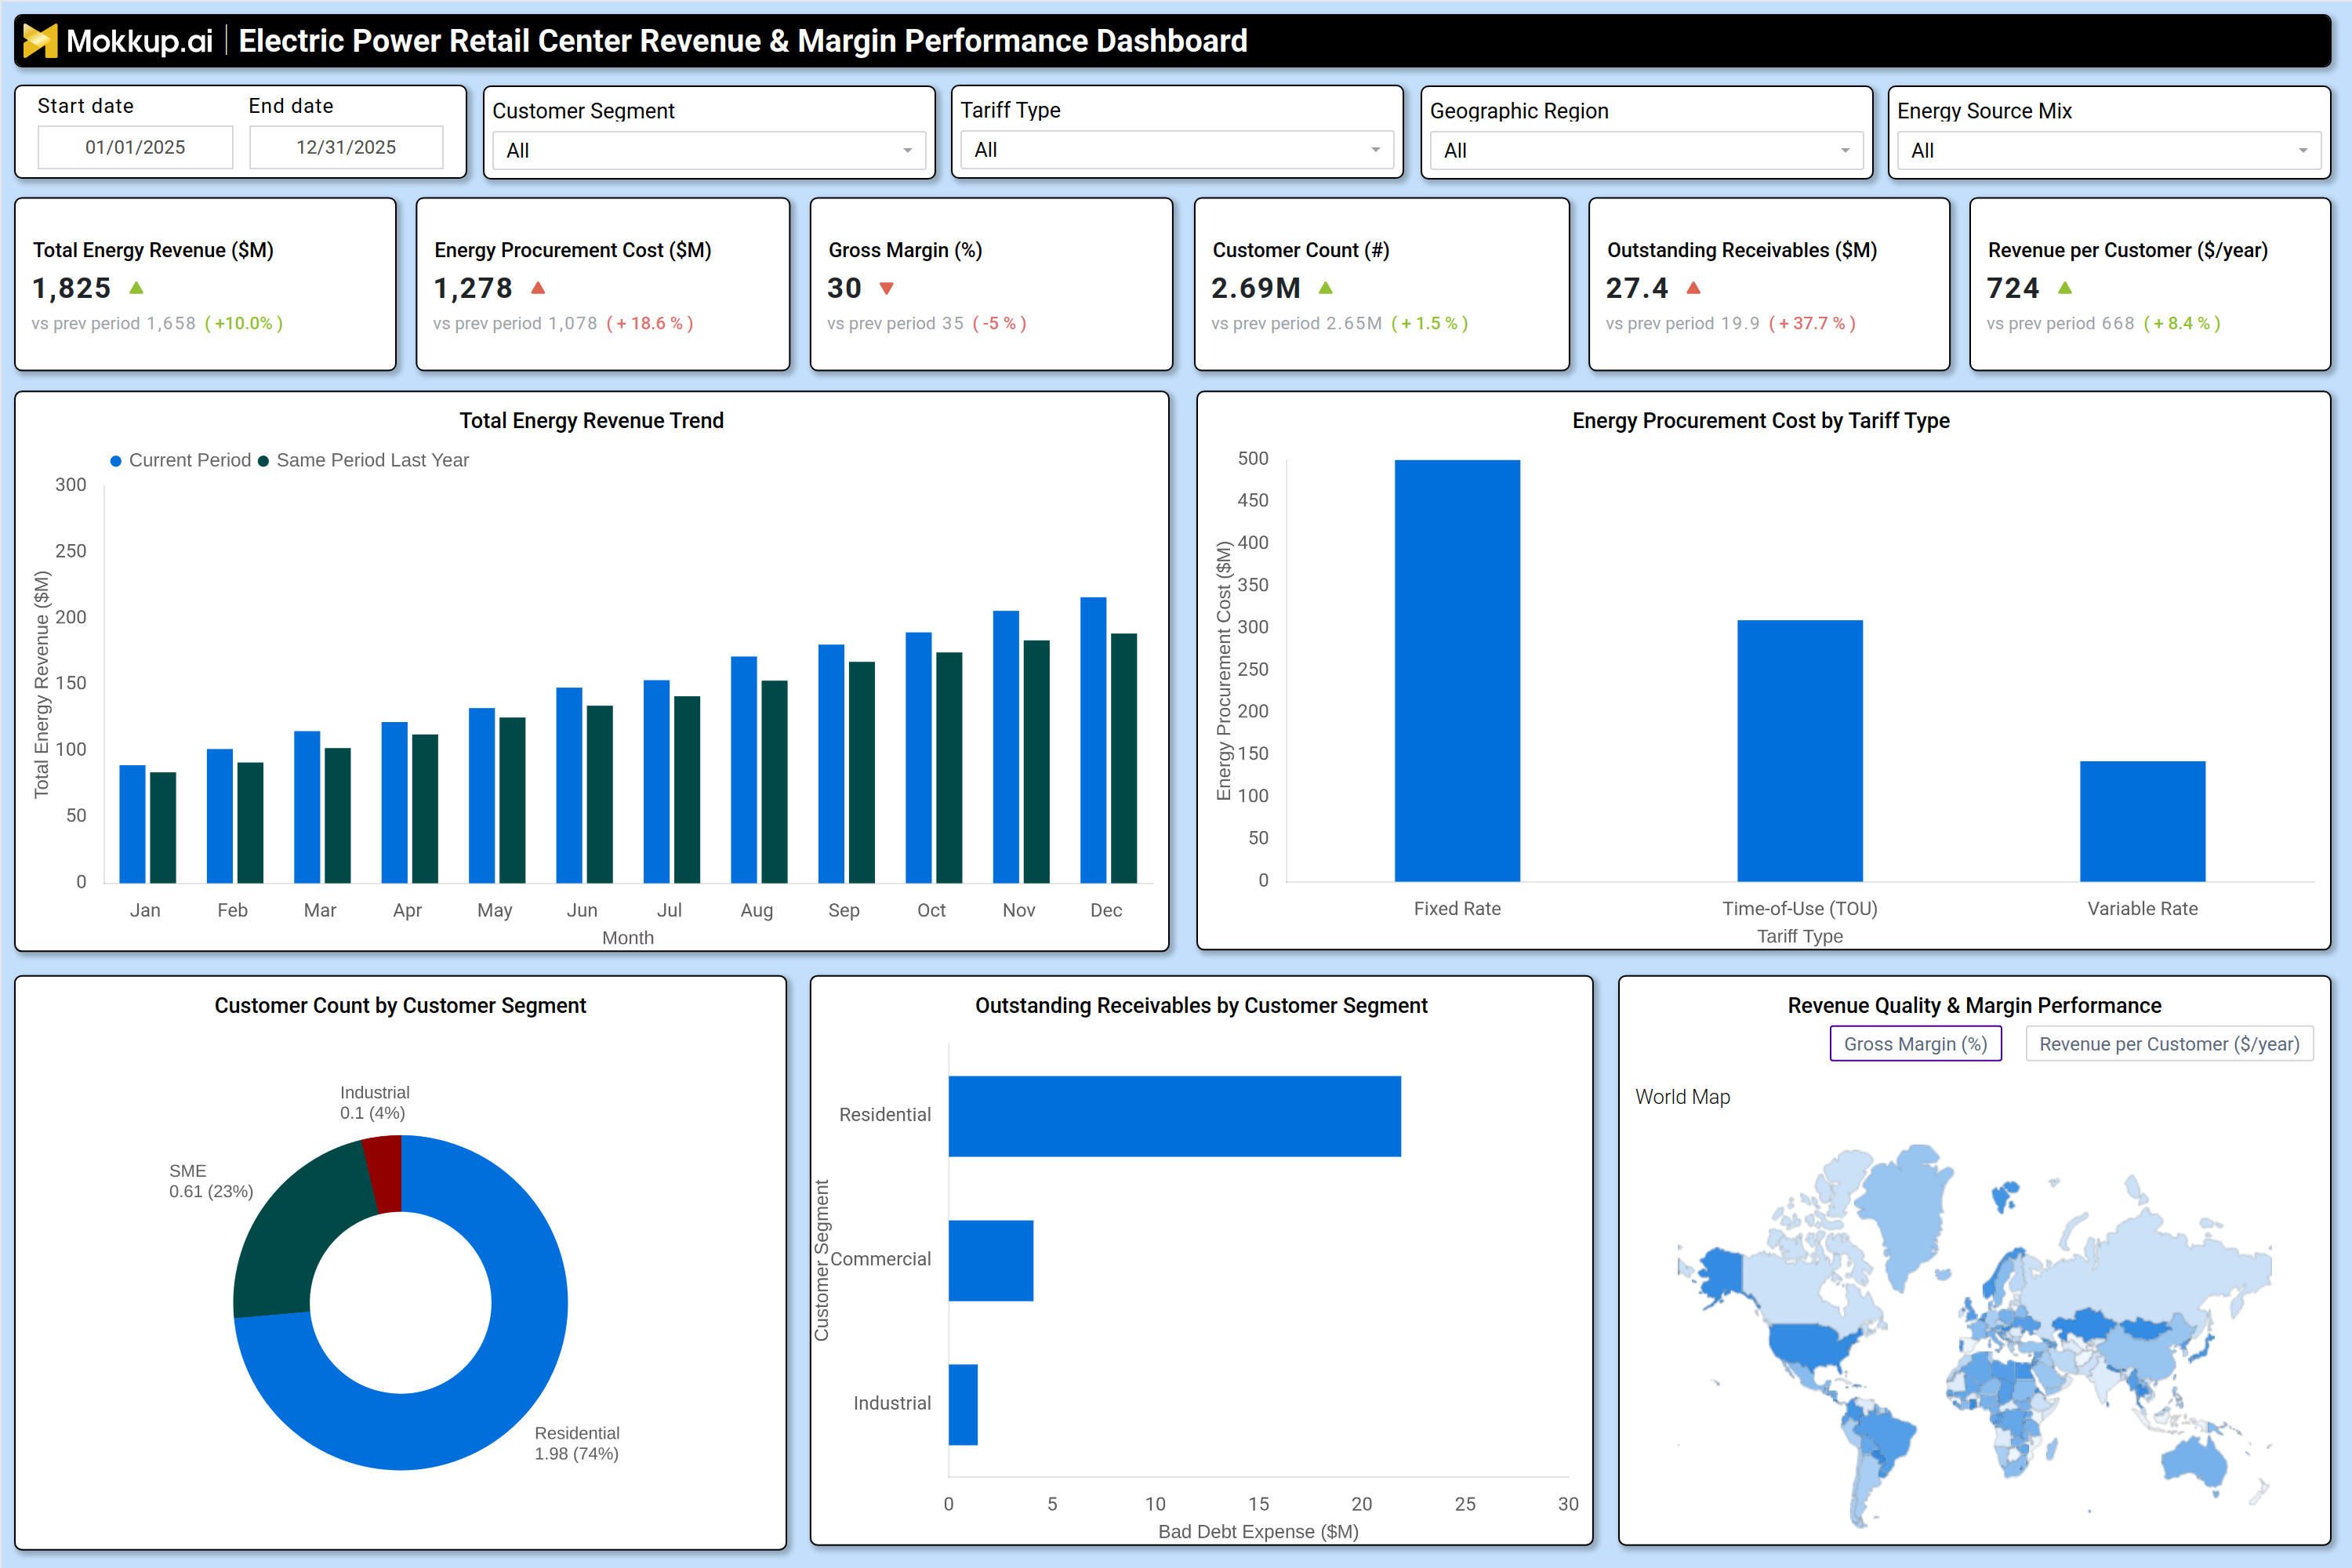
A well-structured energy revenue optimization dashboard for utilities includes interactive filters for date ranges, customer segments, tariff types, geographic regions, and energy source mixes. Key performance tiles display total energy revenue, procurement costs, gross margin percentage, customer count, outstanding receivables expense, and revenue per customer, with comparisons against previous periods. Trend charts visualize monthly revenue performance against the same period last year, helping utilities identify seasonal patterns. A tariff type breakdown shows energy procurement costs for fixed rate, time of use (TOU), and variable rate plans, allowing analysts to assess cost efficiency.
Customer segmentation data reveals revenue contributions from residential, commercial, industrial, and SME (small and medium enterprise) customers, while an outstanding receivables analysis highlights financial risks by customer group. A geographic heatmap displays revenue quality and margin performance across service territories, helping utilities pinpoint high-performing and underperforming regions. Together, these components provide a comprehensive view of financial performance, enabling data-driven decisions on pricing, cost control, and customer retention strategies.
How to Analyze Data in an Electric Power Retail Center Revenue & Margin Performance Dashboard
Here is how you can analyze data from this energy margin analysis for retail power utilities dashboard:
- Energy Revenue vs. Procurement Costs – Compare total energy revenue with procurement costs to assess gross margin trends, evaluate profitability, and identify opportunities to improve financial performance.
- Energy Procurement Costs by Tariff Type – Analyze procurement expenses across fixed, time-of-use (TOU), and variable tariffs to identify cost-saving opportunities and optimize energy purchasing strategies.
- Outstanding Receivables Trends – Monitor outstanding receivables over time to identify collection risks, improve cash flow management, and strengthen accounts receivable performance.
- Revenue per Customer – Track revenue generated per customer to evaluate pricing effectiveness, measure customer profitability, and support pricing optimization strategies.
- Customer Revenue Segmentation – Review revenue contributions across residential, commercial, and industrial customer segments to identify high-value customer groups and guide business strategies.
- Geographic Performance Analysis – Assess regional financial performance using geographic heatmaps to identify high-margin and low-margin areas, enabling targeted operational improvements.
- Historical Revenue Trend Comparison – Compare current revenue performance with historical data to identify growth patterns, detect declines, and support strategic forecasting.
- Gross Margin Analysis – Evaluate fluctuations in gross margins to determine whether procurement costs, pricing strategies, or operational efficiencies require adjustment to maintain profitability.
Benefits of an Electric Power Retail Center Revenue & Margin Performance Dashboard
The following are the benefits of using this electric power retail center revenue performance dashboard:
- Enhanced Financial Visibility – Consolidate revenue, procurement costs, receivables, and gross margin metrics into a single view to provide a comprehensive picture of financial performance.
- Improved Cost Control – Track energy procurement expenses and outstanding receivables trends to identify cost-saving opportunities, improve cash flow, and strengthen financial management.
- Optimized Pricing Strategies – Analyze revenue per customer and tariff performance to refine pricing models, improve profitability, and maximize customer value.
- Reduced Financial Risk – Proactively monitor outstanding receivables and collection performance to minimize payment delays, reduce credit risk, and improve revenue recovery.
- Data-Driven Decision-Making – Provide actionable insights to support supply chain optimization, billing strategies, customer retention initiatives, and long-term financial planning.
- Increased Operational Efficiency – Automate financial reporting and trend analysis to reduce manual effort, improve reporting accuracy, and accelerate business decision-making.
- Greater Business Agility – Enable utilities to respond quickly to market dynamics, regulatory changes, and evolving customer demand through timely financial and operational insights.
KPIs to Track in an Electric Power Retail Center Revenue & Margin Performance Dashboard
The following key KPIs can be tracked by using this dashboard:
- Total Energy Revenue ($M): Measures total income from energy sales before expenses.
- Energy Procurement Cost ($M): Tracks the cost of purchasing energy from suppliers.
- Gross Margin (%): Calculates profitability by subtracting procurement costs from revenue.
- Customer Count (count): Monitors the total number of active customers.
- Outstanding Receivables Expense ($M): Measures uncollectible revenue from late or defaulted payments.
- Revenue per Customer ($/year): Evaluates average revenue generated per customer.
Frequently Asked Questions
1. What is a utility billing and revenue tracking dashboard?
It is a financial analytics tool that tracks revenue, costs, margins, and customer profitability for retail power utilities.
2. Who should use this retail energy supply cost vs. margin dashboard?
Utility financial analysts, operations managers, executives, and energy procurement teams.
3. How does this energy revenue optimization dashboard for utilities improve financial performance?
By identifying cost-saving opportunities, outstanding receivables risks, and revenue trends, utilities can optimize pricing and procurement strategies.