
What is an Electric Power Retail Business Performance & Risk Dashboard?
An Electric Power Retail Business Performance & Risk Dashboard is an analytics dashboard used by power retail utilities to track retail supply performance, billing efficiency, revenue realization, and operational risk exposure. It consolidates key retail KPIs like energy supplied, tariff recovery, billing accuracy, cost-to-serve, and revenue at risk into one view. This dashboard acts as an electric power retail performance dashboard by supporting executive monitoring across retail operations. It also functions as a power supply and billing performance dashboard by linking supply volumes with billing accuracy and collection performance. By analyzing risk exposure across supply, billing, collection, and settlement, it becomes a practical electricity retail risk management dashboard. It helps utilities detect revenue leakage early and strengthens governance through control tracking and performance trends, making it a reliable power retail business performance analytics tool.
How to Create an Electric Power Retail Business Performance & Risk Dashboard
You don’t need to build your report from scratch, just start with a ready-to-use dashboard template from Mokkup. Add in your data and export it however you like. Here’s how to do it:
1. Create or Log in to Your Mokkup Account
Start by signing up on Mokkup.ai using your email. If you already have an account, just log in, and you’ll be good to go.
2. Choose and Customize Your Dashboard Template
Find the Electric Power Retail Business Performance & Risk Dashboard template in the Templates section. Use the drag-and-drop editor to adjust KPIs, edit filters, or add elements based on your data.
3. Export to Your BI Tool
Once your dashboard wireframe is ready, use the BI Tool Export feature to send it directly to Power BI or Tableau for further analysis and enhancements. You can also download the dashboard as a PDF, PNG, or JPEG, embed it on a platform, or invite your team to collaborate.
Note: This is a Pro template. You’ll need a Pro subscription on Mokkup to use and customize this dashboard wireframe. Upgrade anytime to unlock full access.
Electric Power Retail Business Performance & Risk Dashboard Example
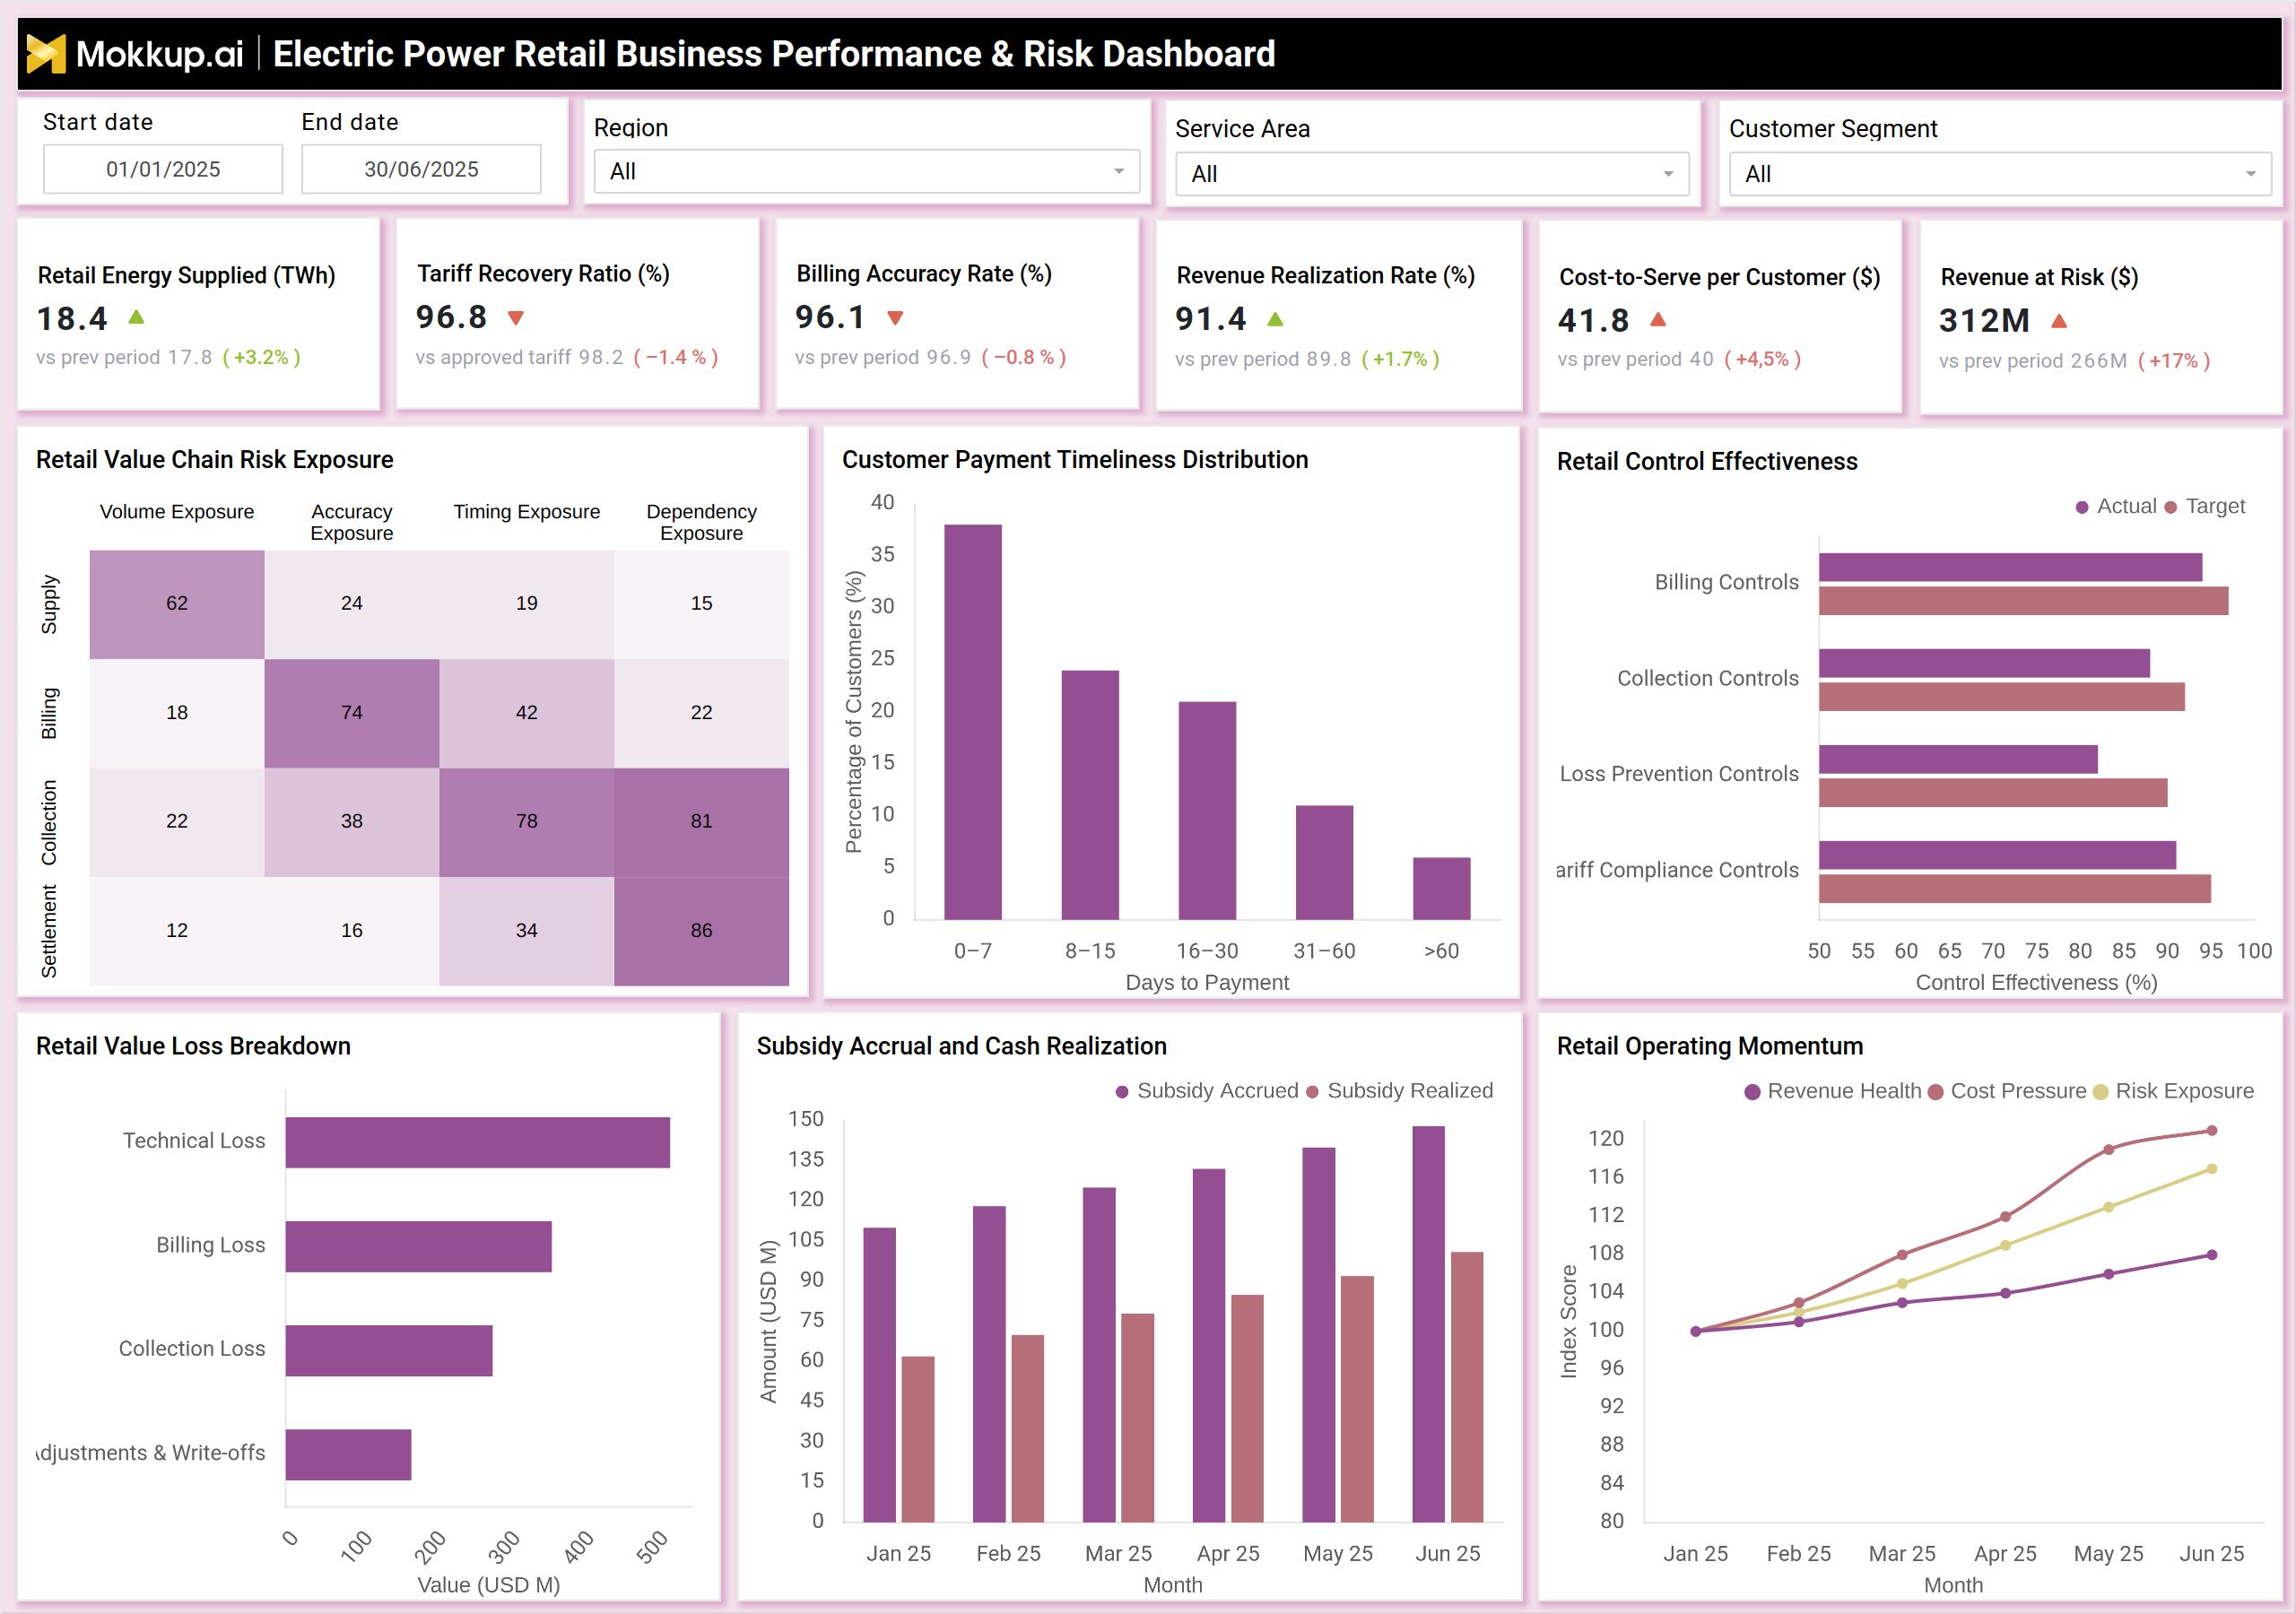
A typical dashboard view starts with headline KPIs such as Retail Energy Supplied, Tariff Recovery Ratio, Billing Accuracy Rate, Revenue Realization Rate, Cost-to-Serve per Customer, and Revenue at Risk. These indicators summarize retail business performance and financial exposure across customer segments and service areas. The risk heatmap shows retail value chain exposure across supply, billing, collection, and settlement by risk type (volume, accuracy, timing, and dependency). Customer payment timeliness distribution explains collection efficiency and overdue behavior. Control effectiveness charts compare actual vs target performance for billing controls, collection controls, loss prevention controls, and tariff compliance controls. Value loss breakdown highlights loss drivers such as technical loss, billing loss, collection loss, and write-offs. Subsidy accrual vs realization tracks subsidy cash gap, while operating momentum shows changes in revenue health, cost pressure, and risk exposure over time.
How to Analyze Data in Electric Power Retail Business Performance & Risk Dashboard
Here is how you can analyze data from this dashboard:
- Start with Retail Energy Supplied (TWh) to confirm the total supply scale for the period.
- Check Tariff Recovery Ratio (%) to validate alignment between approved tariffs and recovered tariffs.
- Review Billing Accuracy Rate (%) to assess billing quality and detect leakage due to incorrect billing.
- Analyze Revenue Realization Rate (%) to understand how much of the billed revenue is converted into actual realized revenue.
- Track Cost-to-Serve per Customer ($) to evaluate operational efficiency across segments and service areas.
- Monitor Revenue at Risk ($) as a headline indicator of revenue vulnerability due to billing, collection, or compliance issues.
- Use the Retail Value Chain Risk Exposure heatmap to identify whether risks are concentrated in supply, billing, collection, or settlement.
- Review Customer Payment Timeliness Distribution to detect changes in payment behavior and overdue risk buildup.
- Compare control performance using Retail Control Effectiveness (Actual vs Target) to identify governance gaps.
- Evaluate Retail Value Loss Breakdown to understand major loss sources like billing loss, collection loss, and technical loss.
- Track subsidy trends through Subsidy Accrual vs Cash Realization to identify realization gaps and cash flow delay.
- Use Retail Operating Momentum trends to interpret whether retail health is improving or deteriorating over time.
Benefits of Electric Power Retail Business Performance & Risk Dashboard
The following are the benefits of using this dashboard:
- Improves visibility into retail utility performance across supply, billing, and revenue realization.
- Strengthens financial governance using a structured power retail financial performance dashboard view.
- Reduces billing and collection leakage by identifying value loss patterns early.
- Supports proactive risk management using a clear electricity retail risk management dashboard structure.
- Helps optimize tariff recovery by tracking tariff compliance and recovery ratio trends.
- Enables targeted improvements in billing accuracy and control effectiveness by service area or segment.
- Improves collections and cash flow through customer payment behavior monitoring.
- Provides executives and operations teams with a unified electric power retail performance dashboard for decision-making.
KPIs to Track in Electric Power Retail Business Performance & Risk Dashboard
The following key KPIs can be tracked by using this dashboard:
- Retail Energy Supplied (TWh): Measures total retail electricity supplied to customers during the period.
- Tariff Recovery Ratio (%): Tracks the percentage of tariff recovery achieved vs approved tariff levels.
- Billing Accuracy Rate (%): Measures billing correctness and billing data quality across the customer base.
- Revenue Realization Rate (%): Measures how much billed revenue is successfully realized.
- Cost-to-Serve per Customer ($): Tracks average operational cost per customer for serving and billing.
- Revenue at Risk ($): Measures total revenue exposure due to leakage, disputes, delays, or compliance gaps.
- Customer Payment Timeliness: Tracks payment distribution across 0–7, 8–15, 16–30, 31–60, and 60+ days.
- Retail Value Loss (USD): Measures value loss across technical loss, billing loss, collection loss, and write-offs.
- Billing Control Effectiveness (%): Tracks performance of billing controls vs target effectiveness levels.
- Collection Control Effectiveness (%): Tracks collection enforcement efficiency and coverage.
- Subsidy Accrual (USD): Measures total subsidy amount accrued for retail energy supply.
- Subsidy Cash Realization (USD): Tracks subsidy cash received vs accrued amount, highlighting cash flow gaps.
Frequently Asked Questions
1. Who should use a retail business performance and risk dashboard?
Retail utility executives, billing teams, revenue assurance teams, finance controllers, audit teams, and customer operations leaders.
2. Why is tariff recovery important in retail utilities?
Because low tariff recovery directly reduces realized revenue and increases revenue at risk even when supply volumes remain stable.
3. What does the revenue realization rate indicate?
It shows how effectively billed revenue is converted into cash or realized revenue after adjustments, delays, or disputes.