- Improved safety visibility: Gives a clear, real-time view of workforce safety performance across operations.
- Proactive risk detection: Uses trends and patterns to identify risks before incidents occur.
- Stronger regulatory compliance: Simplifies compliance tracking and regulatory requirements.
- Faster incident response: Enables quicker detection, escalation, and resolution of safety incidents.
- Greater safety accountability: Creates ownership of safety outcomes across teams and DSOs.
- Optimized safety investments: Links safety initiatives to cost and impact for better budget decisions.
- High-risk area identification: Pinpoints regions, activities, and assets with elevated safety risk.
- Improved fleet safety oversight: Monitors vehicle-related incidents and compliance in one place.
- Data-driven executive decisions: Equips leadership with reliable insights to act decisively.
- Reduced injuries and incidents: Helps lower lost-time injuries and recordable safety events over time.
What is an Electric Power Distribution Utilities Safety & Incident Management Dashboard ?
An Electric Power Distribution Utilities Safety & Incident Management Dashboard is a centralized dashboard designed to track, analyze, and manage safety incidents across power distribution networks. It functions as a utility incident management software for power distribution, combining workforce safety metrics, vehicle incident data, compliance performance, and near-miss reporting into a single operational view.
This electric power utility safety analytics platform enables Distribution System Operators (DSOs) and utility safety teams to monitor KPIs such as Total Recordable Incident Rate (TRIR), Days Away, Restricted or Transferred Rate (DART), Lost Time Injury Frequency Rate (LTIFR), and high-risk work compliance. By serving as a power distribution utility incident tracking system, the dashboard helps utilities reduce operational risk, improve worker safety, and meet regulatory requirements. It also supports proactive safety governance by identifying trends, high risk activities, and regional incident hotspots.
How to Create an Electric Power Distribution Utilities Safety & Incident Management Dashboard
You don’t need to build your report from scratch, just start with a ready-to-use dashboard template from Mokkup. Add in your data and export it however you like. Here’s how to do it:
1. Create or Log in to Your Mokkup Account
Start by signing up on Mokkup.ai using your email. If you already have an account, just log in, and you’ll be good to go.
2. Choose and Customize Your Dashboard Template
Find the Electric Power Distribution Utilities Safety & Incident Management Dashboard template in the Templates section. Use the drag and drop editor to adjust KPIs, edit filters, or add elements based on your data.
3. Export to Your BI Tool
Once your dashboard wireframe is ready, use the BI Tool Export feature to send it directly to Power BI or Tableau for further analysis and enhancements. You can also download the dashboard as a PDF, PNG, or JPEG, embed it on a platform, or invite your team to collaborate.
Note: This is a Pro template. You’ll need a Pro subscription on Mokkup to use and customize this dashboard wireframe. Upgrade anytime to unlock full access.
Electric Power Distribution Utilities Safety & Incident Management Dashboard Example
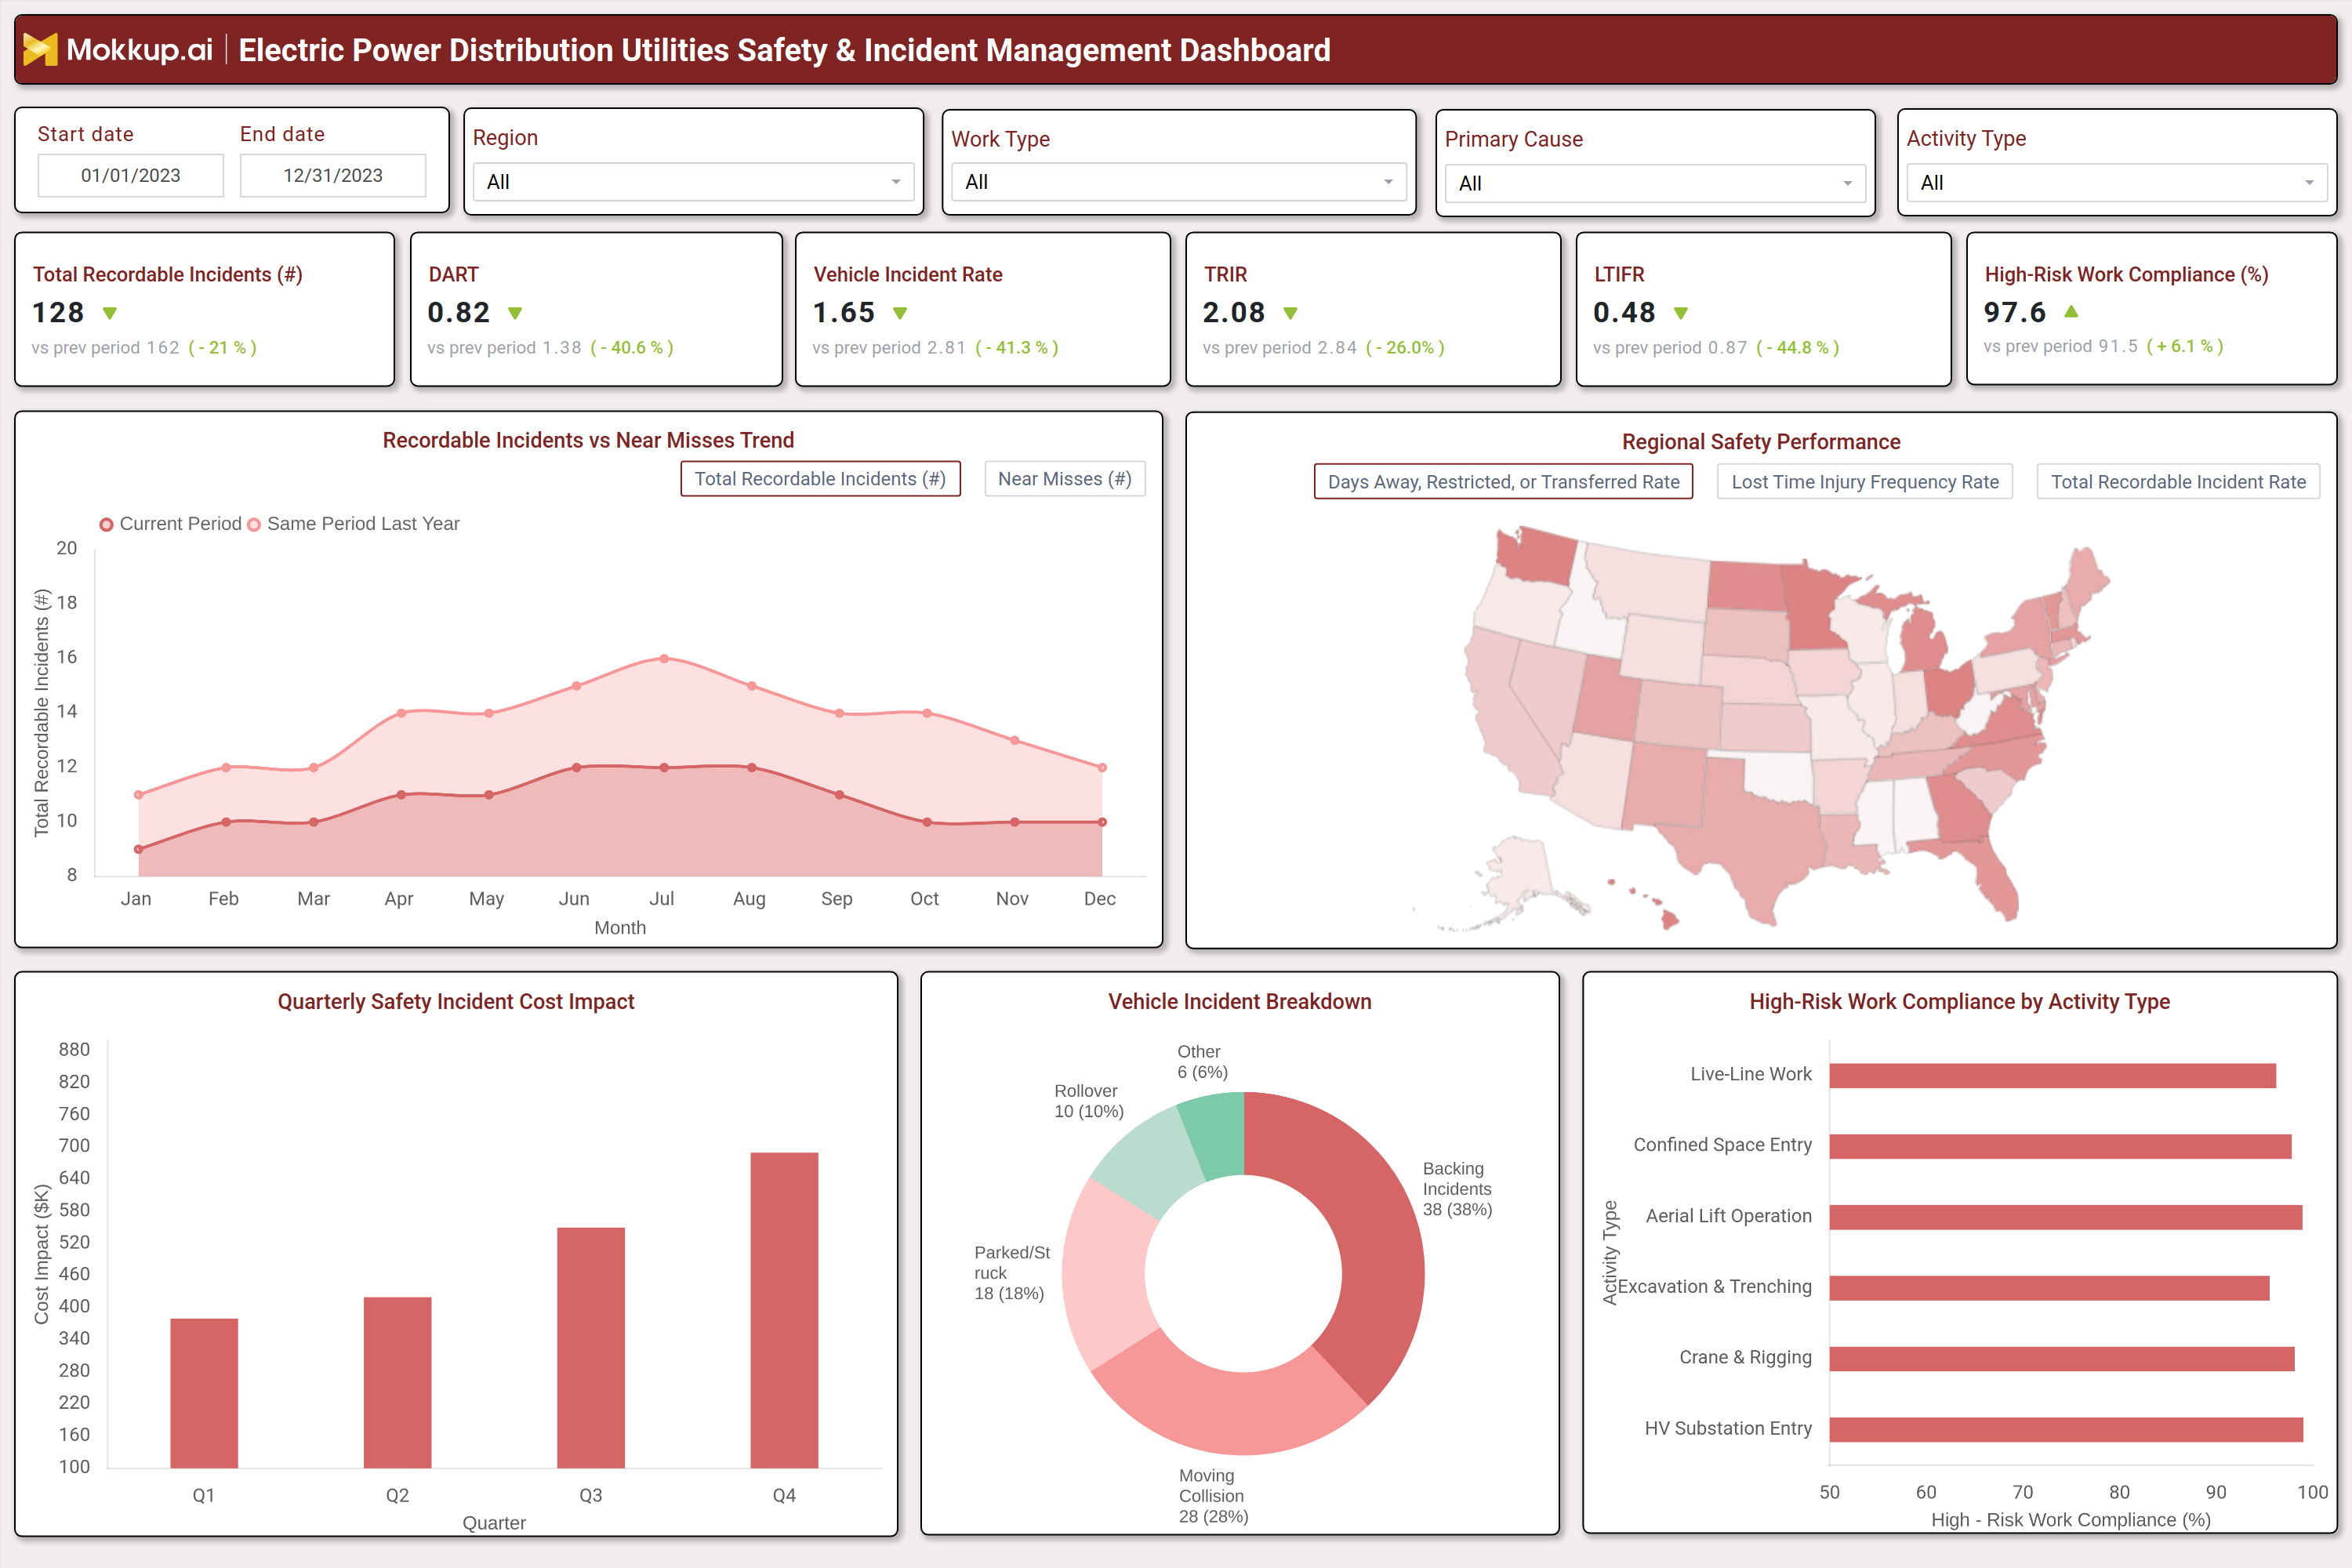
A standard DSO safety and incident reporting dashboard presents safety performance using interactive tiles, trend charts, and regional heat maps. At the top level, users can filter data by date range, region, work type, primary cause, and activity type. Core KPIs such as Total Recordable Incidents, DART, Vehicle Incident Rate, TRIR, and LTIFR are displayed with previous period comparisons. Monthly trend charts compare recordable incidents with near misses, enabling proactive hazard detection.
A regional safety performance map highlights high risk service territories. Additional views include quarterly safety incident cost impact, vehicle incident breakdown by category such as backing or collisions, and high risk work compliance by activity type including live line work and confined space entry. This electric utility worker safety monitoring software enables safety managers to evaluate operational exposure, track compliance levels, and respond quickly to emerging risks.
How to Analyze Data in an Electric Power Distribution Utilities Safety & Incident Management Dashboard.
Here is how you can analyze data from this dashboard:
- Review headline KPIs such as TRIR, DART, and LTIFR to assess overall workforce safety
- Compare current period data with historical benchmarks to identify trends
- Analyze monthly incident trends to detect seasonal or workload related risk patterns
- Use regional maps to locate service areas with elevated incident density
- Drill down into vehicle incident categories to identify dominant risk factors
- Monitor near miss reporting trends to measure proactive safety culture
- Track high risk work compliance by activity type to detect procedural gaps
- Evaluate quarterly safety cost impact to quantify financial exposure
- Apply filters for work type, primary cause, and activity to isolate problem areas
Benefits of a Electric Power Distribution Utilities Safety & Incident Management Dashboard
The following are the benefits of using this dashboard:
KPIs to Track in a Electric Power Distribution Utilities Safety & Incident Management Dashboard
The following key KPIs can be tracked by using this dashboard:
- Total Recordable Incidents – Total number of safety incidents recorded during a given period (count).
- Total Recordable Incident Rate (TRIR) – Measure of how often recordable safety incidents occur (rate).
- Days Away, Restricted, or Transferred Rate (DART) – Measure of incidents that result in lost workdays, restricted duties, or job transfers (rate).
- Lost Time Injury Frequency Rate (LTIFR) – Measure of how often injuries result in lost work time (rate).
- Vehicle Incident Rate – Measure of how often vehicle related safety incidents occur (rate).
- High Risk Work Compliance Percentage – Proportion of high risk activities completed in line with safety procedures (%)
Frequently Asked Questions
1. What is an electric power distribution safety management dashboard?
It is a centralized platform that tracks safety KPIs, incidents, and compliance data for power distribution utilities.
2. Who uses a DSO safety and incident reporting dashboard?
Safety managers, operations leaders, compliance officers, and DSO executives.
3. Can this dashboard support regulatory audits?
Yes. It simplifies OSHA reporting and internal safety audits.