
What is an Electric Power Distribution Center Stakeholder Communications & Public Outreach Dashboard?
An Electric Power Distribution Center Stakeholder Communications & Public Outreach Dashboard is a centralized analytics platform designed to help Distribution System Operators (DSOs) track, measure, and optimize stakeholder engagement. This dashboard consolidates public outreach campaigns, crisis communications, media inquiries, and reputation metrics into a single interface, enabling utilities to assess the effectiveness of their communication strategies.
By monitoring stakeholder outreach volume, engagement rates, outage communication performance, and reputation resilience, DSOs can enhance transparency, improve crisis response, and strengthen community relations. The dashboard also provides geographic and segment based insights, allowing utilities to tailor messaging for regulators, municipal partners, residential customers, businesses, and media outlets. With data driven decisionmaking, electric power distribution centers can ensure consistent, proactive, and impactful stakeholder communications.
How to Create a Electric Power Distribution Center Stakeholder Communications & Public Outreach Dashboard
You don’t need to build your report from scratch, just start with a ready to use dashboard template from Mokkup. Add in your data and export it however you like. Here’s how to do it:
1. Create or Log in to Your Mokkup Account
Start by signing up on Mokkup.ai using your email. If you already have an account, just log in, and you’ll be good to go.
2. Choose and Customize Your Dashboard Template
Find the Electric Power Distribution Center Stakeholder Communications & Public Outreach Dashboard template in the Templates section. Use the drag and drop editor to adjust KPIs, edit filters, or add elements based on your data.
3. Export to Your BI Tool
Once your dashboard wireframe is ready, use the BI Tool Export feature to send it directly to Power BI or Tableau for further analysis and enhancements. You can also download the dashboard as a PDF, PNG, or JPEG, embed it on a platform, or invite your team to collaborate.
Note: This is a Pro template. You’ll need a Pro subscription on Mokkup to use and customize this dashboard wireframe. Upgrade anytime to unlock full access.
Electric Power Distribution Center Stakeholder Communications & Public Outreach Dashboard Example
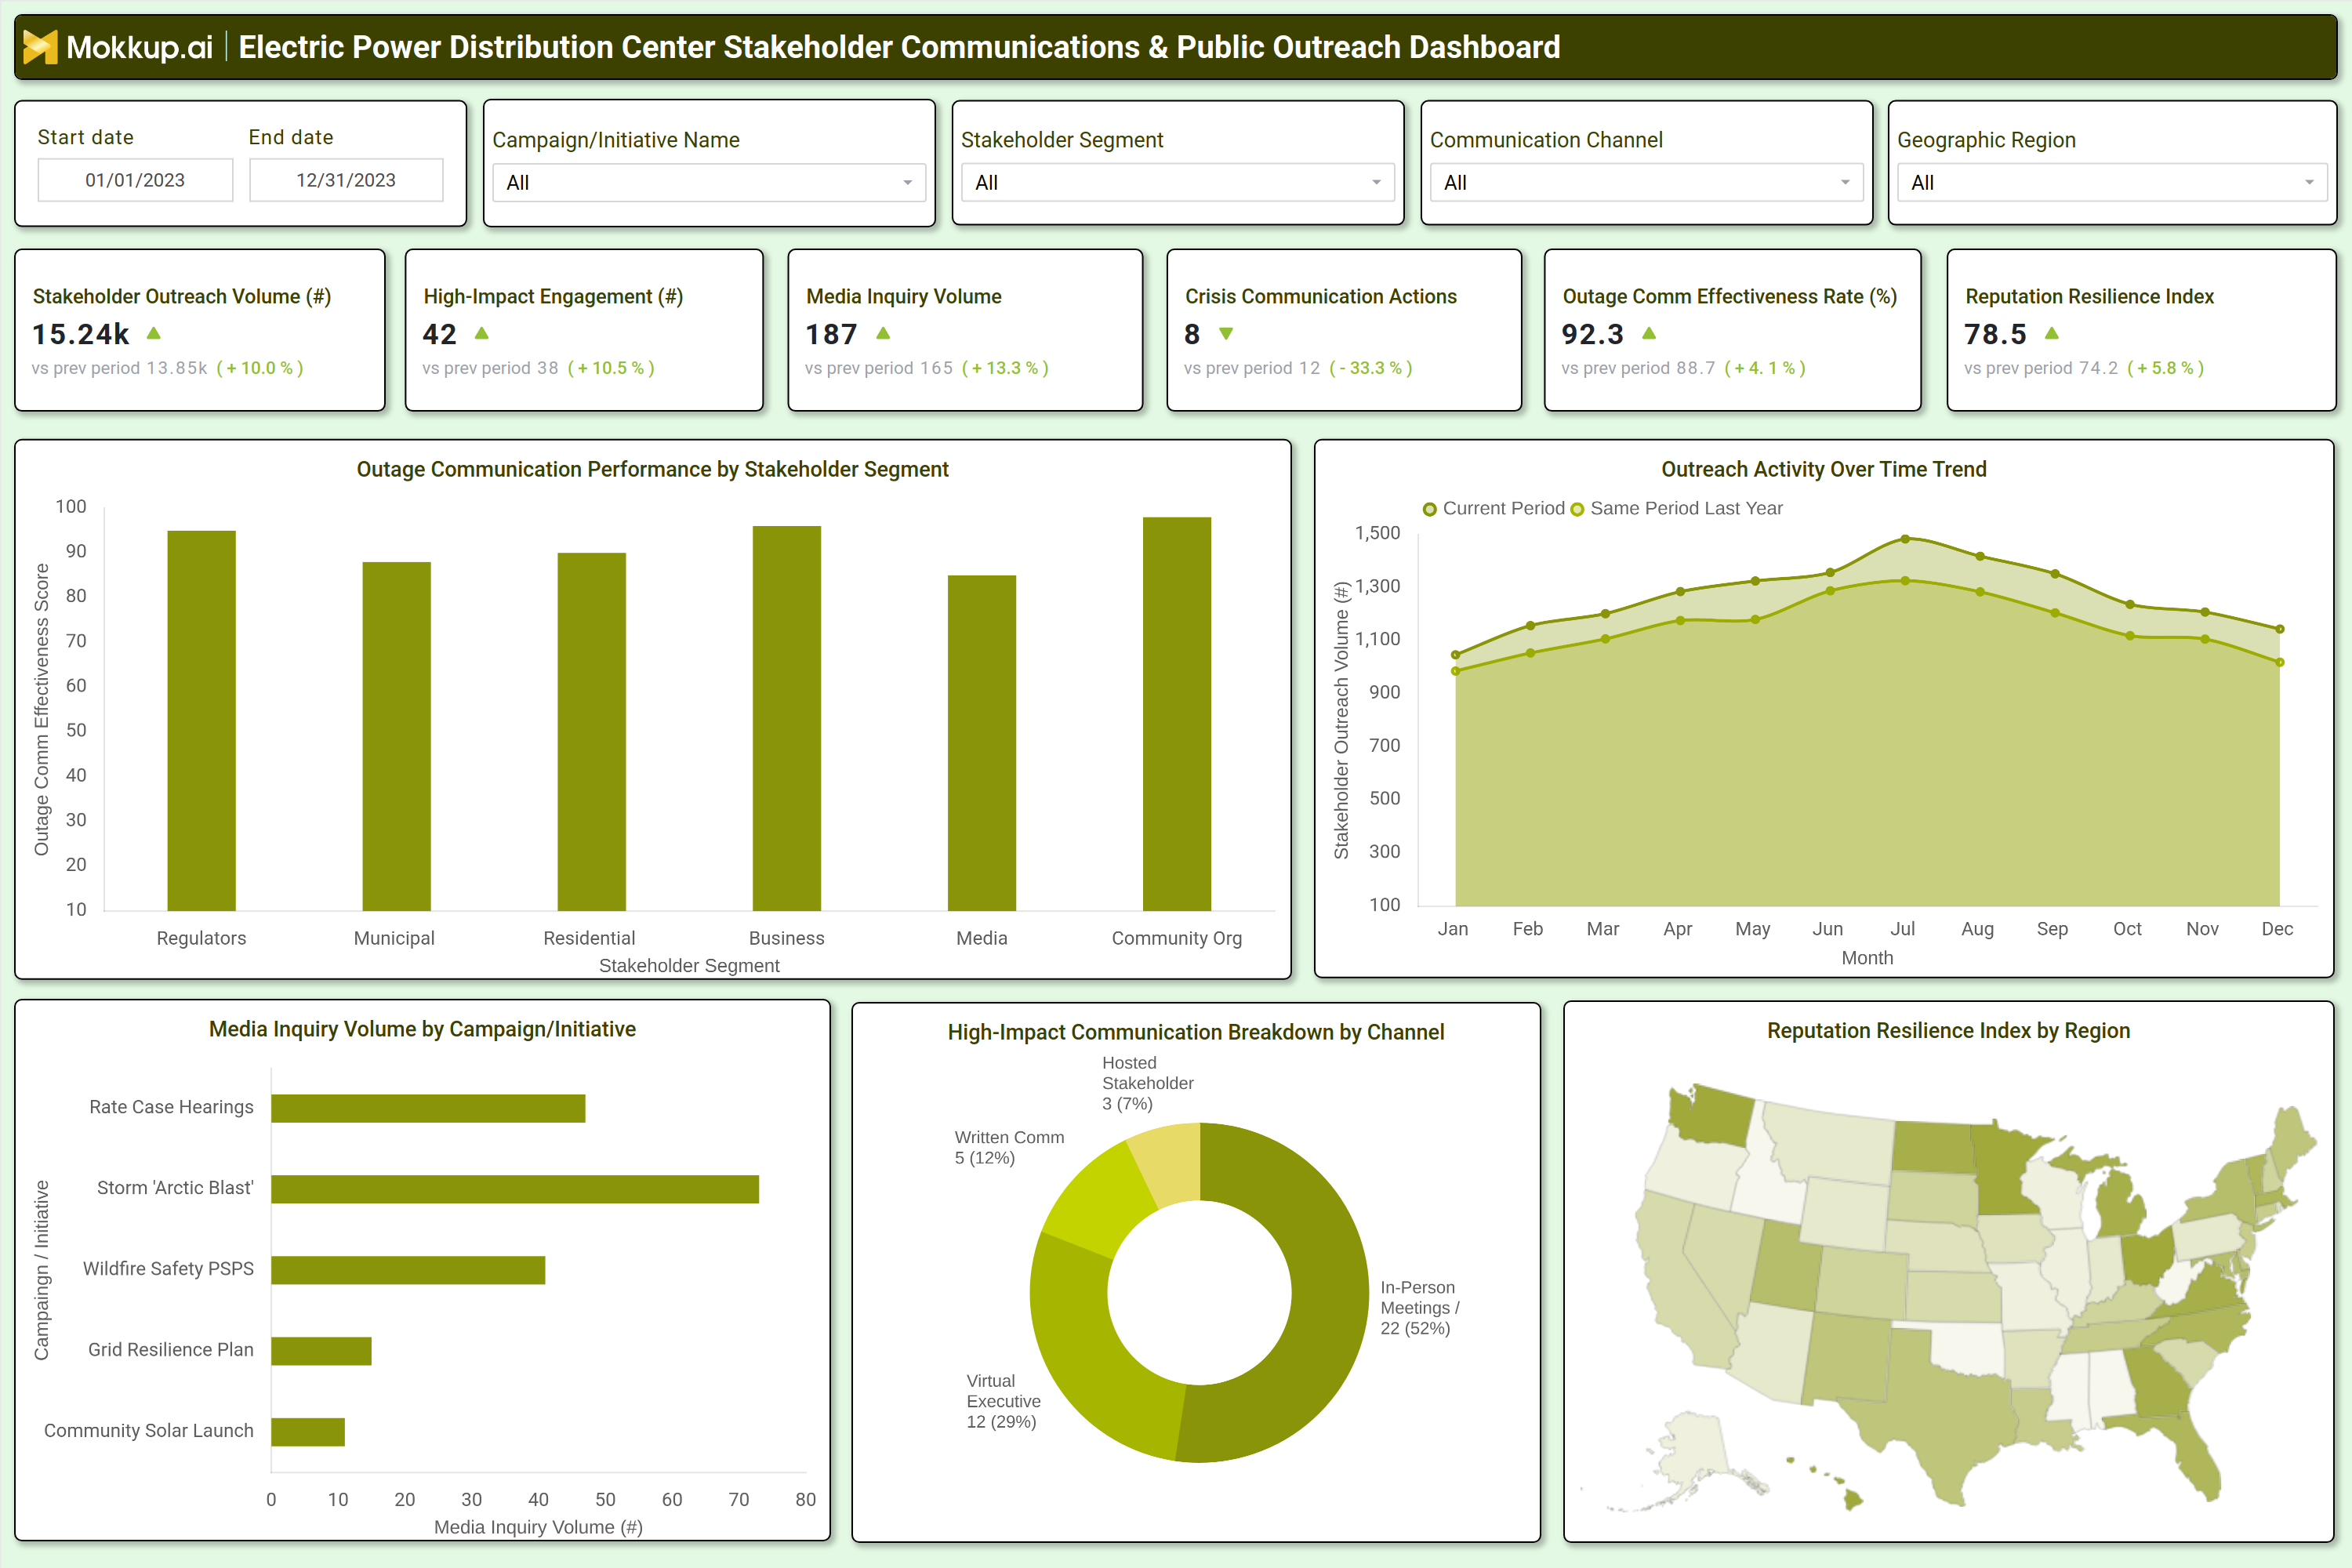
A well structured power utility crisis communication management tool includes interactive filters for date ranges, campaigns, stakeholder segments, communication channels, and geographic regions. Key performance tiles display stakeholder outreach volume, high impact engagement, media inquiry volume, crisis communication actions, outage communication effectiveness rate, and reputation resilience index. Trend charts compare current outreach activity against previous periods, while bar graphs break down outage communication performance by stakeholder segment (regulators, municipal partners, residential customers, businesses, media, and community organizations).
A media inquiry volume analysis highlights which campaigns generate the most press interest, and a high impact communication breakdown shows the most effective channels (in person meetings, virtual executive briefings, written communications, hosted stakeholder events). A geographic heatmap visualizes reputation resilience by region, helping DSOs identify areas needing improved engagement. Together, these components provide a comprehensive executive overview of stakeholder communications, enabling utilities to refine outreach strategies, improve crisis response, and maintain public trust.
How to Analyze Data in an Electric Power Distribution Center Stakeholder Communications & Public Outreach Dashboard
Here is how you can analyze data from this dashboard:
- Track stakeholder outreach volume to measure the scale of public engagement efforts.
- Monitor high impact engagement metrics to assess the effectiveness of key communication campaigns.
- Evaluate media inquiry volume to identify which initiatives generate the most press interest.
- Review crisis communication actions to determine response efficiency during outages or emergencies.
- Assess outage communication effectiveness rates to improve transparency and customer satisfaction.
- Analyze reputation resilience index trends to gauge public trust and brand perception.
- Compare outreach activity over time to detect seasonal or campaign driven engagement patterns.
- Break down communication performance by stakeholder segment to tailor messaging for different audiences.
- Use geographic insights to identify regions requiring targeted outreach efforts.
Benefits of a Electric Power Distribution Center Stakeholder Communications & Public Outreach Dashboard
The following are the benefits of using this grid operator community notification system software:
- Enhances transparency by providing visibility into stakeholder engagement efforts.
- Improves crisis communication with data driven insights for faster, more effective responses.
- Strengthens public trust by tracking reputation resilience and addressing concerns proactively.
- Optimizes outreach strategies by identifying high impact communication channels.
- Supports regulatory compliance with structured reporting on public and media interactions.
- Reduces misinformation risks by ensuring consistent, accurate messaging across all stakeholders.
- Enables data driven decision making for future public relations and community engagement initiatives.
KPIs to Track in a Electric Power Distribution Center Stakeholder Communications & Public Outreach Dashboard
The following key KPIs can be tracked by using this DSO stakeholder feedback and public relations dashboard:
- Stakeholder Outreach Volume (count): Measures the total number of stakeholder interactions across all channels.
- High Impact Engagement (count): Tracks the number of meaningful engagements (e.g., meetings, responses, feedback).
- Media Inquiry Volume (count): Counts the number of press inquiries received, indicating public and media interest.
- Crisis Communication Actions (count): Monitors the number of crisis related communications issued during outages or emergencies.
- Outage Communication Effectiveness Rate (%): Evaluates how well outage updates and resolutions are communicated to stakeholders.
- Reputation Resilience Index: Assesses public trust and brand perception based on engagement and feedback trends.
Frequently Asked Questions
1. What is the purpose of an electric power distribution stakeholder engagement dashboard?
It helps DSOs track public outreach, crisis response, and reputation management to improve transparency and engagement.
2. What data sources feed into this electric distribution center transparency reporting dashboard?
Customer communication logs, media monitoring tools, crisis management systems, and public feedback platforms.
3. Who should use a DSO stakeholder communications dashboard?
Utility communications teams, PR managers, crisis response coordinators, and executive leadership.