
What is an Electric Power Distribution Center R&D Adoption Dashboard?
The Electric Power Distribution Center R&D Adoption Dashboard is a specialized analytics tool designed to help Distribution System Operators (DSOs) and electric power centers track, measure, and optimize their research and development (R&D) initiatives. This dashboard consolidates R&D investment data, technology adoption rates, pilot project performance, and innovation metrics into a single, actionable view. By monitoring smart grid advancements, grid automation investments, and renewable energy integration, the Center gains insights into time-to-market trends, adoption rates, and regulatory compliance. This enables data-driven decision-making for grid modernization, cost efficiency, and future-proofing distribution networks. The grid automation investment analytics dashboard also helps identify high-impact R&D projects, ensuring resources are allocated to technologies that enhance grid resilience, efficiency, and sustainability.
How to Create an Electric Power Distribution Center R&D Adoption Dashboard
You don’t need to build your report from scratch, just start with a readytouse dashboard template from Mokkup. Add in your data and export it however you like. Here’s how to do it:
1. Create or Log in to Your Mokkup Account
Start by signing up on Mokkup.ai using your email. If you already have an account, just log in, and you’ll be good to go.
2. Choose and Customize Your Dashboard Template
Find the Electric Power Distribution Center R&D Adoption Dashboard template in the Templates section. Use the drag and drop editor to adjust KPIs, edit filters, or add elements based on your data.
3. Export to Your BI Tool
Once your dashboard wireframe is ready, use the BI Tool Export feature to send it directly to Power BI or Tableau for further analysis and enhancements. You can also download the dashboard as a PDF, PNG, or JPEG, embed it on a platform, or invite your team to collaborate.
Note: This is a Pro template. You’ll need a Pro subscription on Mokkup to use and customize this dashboard wireframe. Upgrade anytime to unlock full access.
Electric Power Distribution Center R&D Adoption Dashboard Example
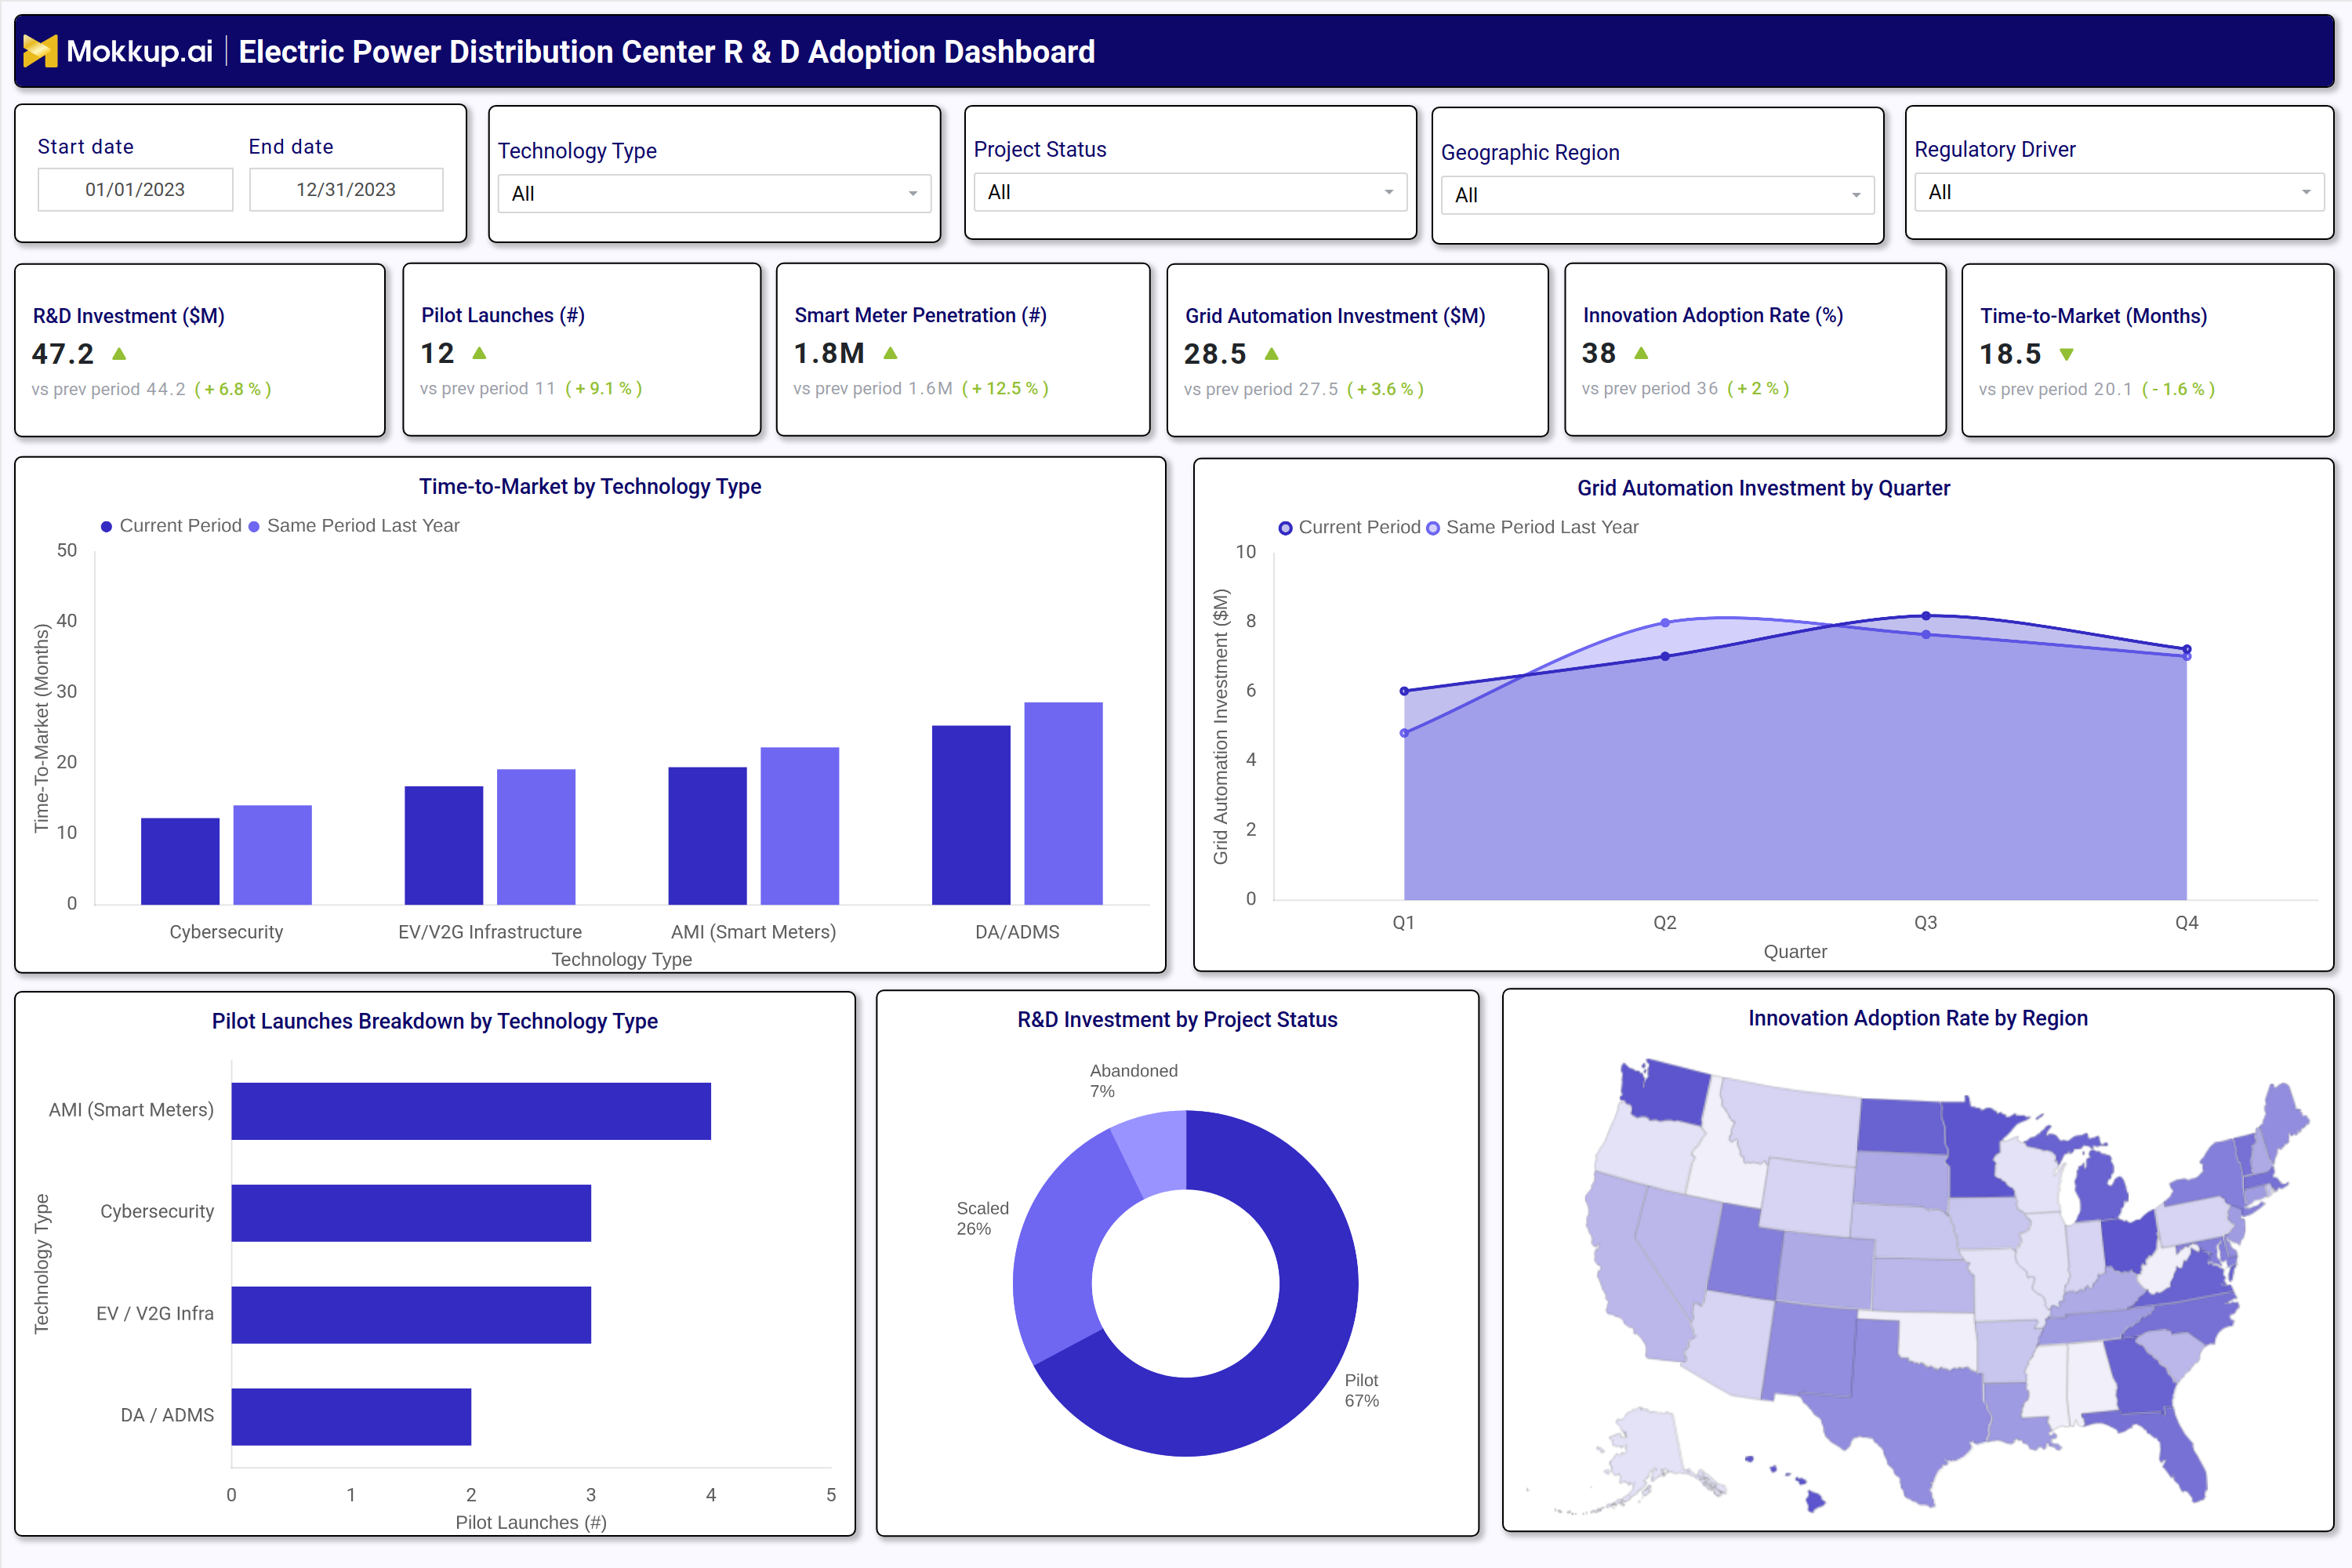
A well-structured smart meter penetration tracking dashboard for Center for electric power distribution includes interactive filters for date ranges, technology types, project status, geographic regions, and regulatory drivers. Key metrics displayed in performance tiles include R&D investment, pilot launches, smart meter penetration, grid automation spending, innovation adoption rates, and time to market trends. Trend charts compare current performance against previous periods, highlighting growth in smart meter adoption, grid automation investments, and R&D spending. A breakdown of pilot launches by technology type (e.g., AMI, cybersecurity, EV/V2G infrastructure, DA/ADMS) helps the Center assess which innovations are gaining traction. Additionally, a geographic heatmap visualizes innovation adoption rates by region, while a pie chart categorizes R&D investment by project status (pilot, scaled, abandoned). Together, these components provide DSOs and Center with a comprehensive view of R&D progress, enabling them to accelerate smart grid adoption, optimize investments, and align with regulatory requirements.
How to Analyze Data in an Electric Power Distribution Center R&D Adoption Dashboard
Here is how you can analyze data from this dashboard:
- Track R&D Investment Trends: Monitor how R&D budgets evolve to understand strategic priorities, spot shifts in funding, and identify high-growth technology areas receiving increased investment.
- Monitor Pilot Launches by Technology Type: Analyze the volume and type of pilot projects to determine which innovations are being tested, validated, and prepared for large-scale rollout.
- Compare Smart Meter Penetration Against Benchmarks: Evaluate smart meter adoption rates relative to industry standards to measure progress and identify gaps in deployment.
- Analyze Grid Automation Investments: Review spending on grid automation initiatives to assess modernization efforts, infrastructure readiness, and cost efficiency.
- Review Innovation Adoption Rates: Identify regions, business units, or technologies with slow uptake to target interventions and accelerate adoption.
- Assess Time-to-Market Trends: Track how long it takes for innovations to move from concept to deployment in order to optimize development and rollout timelines.
- Evaluate R&D Investment by Project Status: Break down investments by pilot, in-progress, and completed projects to understand success rates and portfolio effectiveness.
- Use Geographic Heatmaps for Adoption Insights: Visualize innovation adoption across regions to quickly pinpoint areas with high or low performance and guide regional strategies.
Benefits of an Electric Power Distribution Center R&D Adoption Dashboard
The following are the benefits of using this electric utility technology deployment dashboard template:
- Enhance Visibility into Innovation Performance: Gain clear insights into R&D spending, technology adoption, and overall innovation progress to maintain transparency across initiatives.
- Support Grid Modernization Initiatives: Track smart grid, automation, and renewable energy integration to measure modernization efforts and infrastructure readiness.
- Optimize R&D Investment Allocation: Identify high-impact projects and scale successful pilots to maximize returns on innovation spending.
- Improve Regulatory Compliance Monitoring: Monitor technology adoption against policy and regulatory requirements to ensure alignment and reduce compliance risks.
- Reduce Time to Market for New Technologies: Apply data-driven deployment strategies to accelerate development cycles and faster rollout.
- Strengthen Strategic Decision-Making: Use performance insights to guide leadership decisions around innovation priorities and resource allocation.
- Enable Industry Benchmarking: Compare smart meter penetration and grid automation metrics against industry standards to evaluate competitiveness.
- Facilitate Cross-Functional Collaboration: Enable better coordination between R&D, operations, and regulatory teams through shared visibility and insights.
KPIs to Track in an Electric Power Distribution Center R&D Adoption Dashboard
The following key KPIs can be tracked by using this pilot project performance monitoring dashboard for DSOs:
- R&D Investment ($M) – Total spending on research and development for grid technologies.
- Pilot Launches (#) – Number of new technology pilots initiated within a given period.
- Smart Meter Penetration (#) – Total smart meters deployed and their adoption rate.
- Grid Automation Investment ($M) – Spending on automation technologies for distribution networks.
- Innovation Adoption Rate (%) – Percentage of new technologies successfully deployed across the grid.
- Time to Market (Months) – Average duration from pilot to full-scale deployment of new technologies.
Frequently Asked Questions
1. What is a grid modernization R&D adoption dashboard for Center ?
It is a centralized analytics platform that tracks R&D investments, technology adoption, and innovation performance for electric power distribution Center .
2. What data sources feed this dashboard?
R&D budget reports, pilot project logs, smart meter deployment records, grid automation spending, and regulatory compliance data.
3. How does this electric power distribution center's R&D adoption strategies dashboard help DSOs?
It provides data-driven insights into smart grid adoption, grid automation, and renewable energy integration, helping Center optimize R&D spending and accelerate modernization.