
What is a Bioenergy Power Plant R&D Dashboard?
A Bioenergy Power Plant R&D Dashboard is a centralized analytics platform designed to track, evaluate, and optimize research and development activities across bioenergy operations. It supports feedstock testing, fuel blending experiments, pilot trials, and scalability assessments by consolidating technical, performance, and sustainability data into a single view. By combining trial results, efficiency metrics, and environmental indicators, this dashboard enables structured bioenergy research monitoring dashboard workflows and accelerates data-driven innovation. It plays a critical role in bioenergy power plant R&D by helping teams compare feedstock performance, validate new technologies, and reduce uncertainty before large-scale deployment.
How to Create a Bioenergy Power Plant R&D Dashboard
You don’t need to build your report from scratch, just start with a ready-to-use dashboard template from Mokkup. Add in your data and export it however you like. Here’s how to do it:
1. Create or Log in to Your Mokkup Account
Start by signing up on Mokkup.ai using your email. If you already have an account, just log in, and you’ll be good to go.
2. Choose and Customize Your Dashboard Template
Find the Bioenergy Power Plant R&D Dashboard template in the Templates section. Use the drag-and-drop editor to adjust KPIs, edit filters, or add elements based on your data.
3. Export to Your BI Tool
Once your dashboard wireframe is ready, use the BI Tool Export feature to send it directly to Power BI or Tableau for further analysis and enhancements. You can also download the dashboard as a PDF, PNG, or JPEG, embed it on a platform, or invite your team to collaborate.
Note: This is a Pro template. You’ll need a Pro subscription on Mokkup to use and customize this dashboard wireframe. Upgrade anytime to unlock full access.
Bioenergy Power Plant R&D Dashboard Example
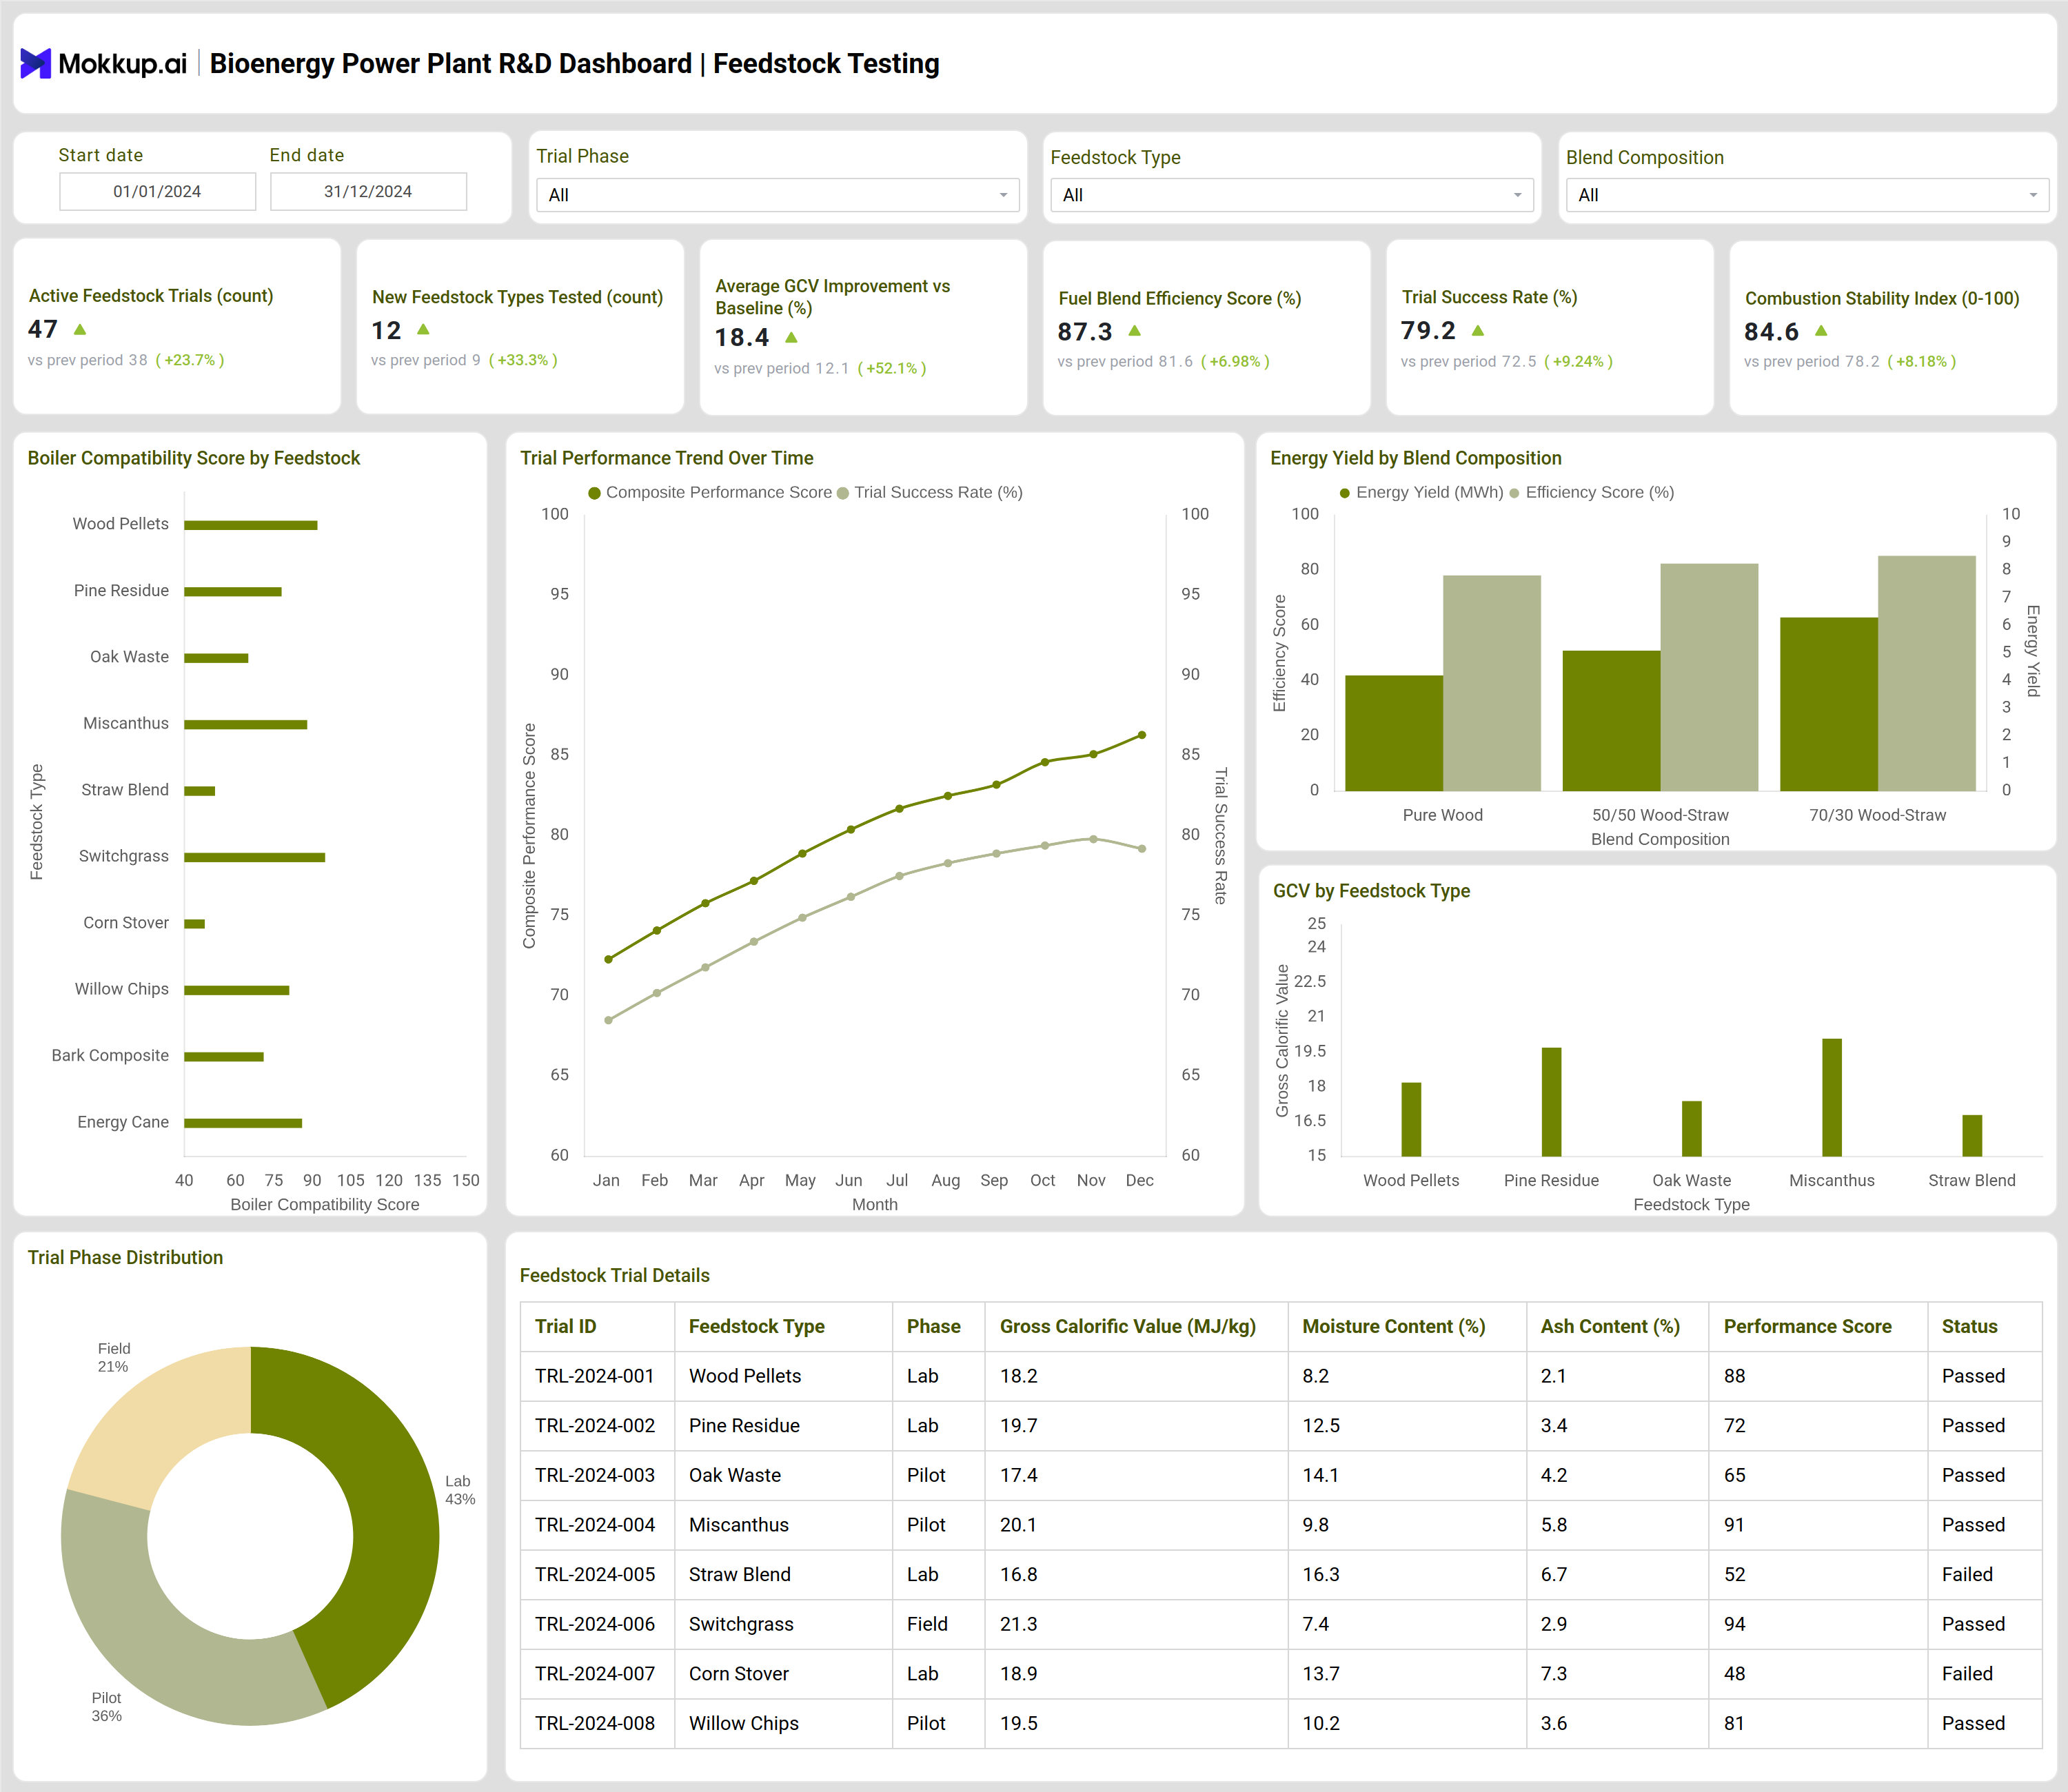
You can build your own Bioenergy Power Plant R&D Dashboard by combining feedstock testing insights with scalability and supply feasibility analysis. A typical dashboard begins with high-level KPIs such as active feedstock trials, new feedstock types tested, average gross calorific value (GCV) improvement, trial success rate, and combustion stability index. These indicators provide a quick snapshot of overall R&D progress and experimental effectiveness. The feedstock testing view focuses on laboratory, pilot, and field trial results. Boiler compatibility scores highlight how different feedstocks, such as wood pellets, agricultural residues, or energy crops, perform under real operating conditions.
Trend charts track trial performance scores and success rates over time, helping R&D teams identify which feedstock combinations consistently improve efficiency. Energy yield and GCV comparisons by feedstock and blend composition support detailed bioenergy plant innovation analytics by linking fuel quality to output performance. The scalability section extends the analysis beyond trials. It evaluates supply potential, cost per ton, greenhouse gas reduction, and sustainable sourcing compliance across feedstock types. Seasonal availability trends and supply concentration risks are visualized to assess long-term feasibility. Together, these views support bioenergy pilot project monitoring and ensure that promising R&D outcomes can scale into reliable commercial operations.
How to Analyze Bioenergy Power Plant R&D Dashboard
Here is how you can analyze data from this dashboard:
- Review active feedstock trials and success rates to understand the current pace and effectiveness of R&D activities.
- Compare GCV improvement and combustion stability across feedstock types to identify high-performing fuels.
- Analyze boiler compatibility scores to ensure experimental feedstocks align with existing plant equipment.
- Track trial performance trends over time to validate consistency and reduce experimental risk.
- Evaluate energy yield and efficiency by blend composition to optimize fuel blending strategies.
- Assess scalability scores, supply potential, and cost metrics before recommending scale-up decisions.
- Monitor GHG reduction and compliance indicators to align R&D outcomes with sustainability targets.
Benefits of Bioenergy Power Plant R&D Dashboard
The following are the benefits of using this dashboard:
- Centralizes bioenergy R&D dashboard analytics for faster and more informed decision-making.
- Reduces experimentation risk by linking trial results directly to performance and stability metrics.
- Improves feedstock selection by comparing efficiency, cost, and environmental impact in one view.
- Accelerates innovation cycles by identifying successful feedstocks earlier in the R&D process.
- Supports long-term planning through scalability and seasonal availability analysis.
- Enhances collaboration between research, operations, and sustainability teams using shared data.
KPIs to Track in Bioenergy Power Plant R&D Dashboard
The following key KPIs can be tracked by using this dashboard:
- Active Feedstock Trials: Number of ongoing laboratory, pilot, and field trials.
- Trial Success Rate: Percentage of trials meeting predefined performance criteria.
- GCV Improvement: Average increase in gross calorific value compared to baseline fuels.
- Boiler Compatibility Score: A measure of how well new feedstocks perform in existing boilers.
- Energy Yield by Blend: Power output generated by different feedstock blends.
- Scalability Score: Readiness of feedstocks for commercial-scale deployment.
- GHG Reduction Percentage: Emissions reduction achieved versus conventional fuels.
- Sustainable Sourcing Compliance: Alignment of feedstocks with regulatory and sourcing standards.
Frequently Asked Questions
1. What is the main purpose of a Bioenergy Power Plant R&D Dashboard?
It helps monitor experiments, evaluate new feedstocks, and support data-driven innovation decisions in bioenergy operations.
2. How does this dashboard support bioenergy technology development?
By linking trial performance, efficiency gains, and scalability data, it reduces uncertainty in adopting new technologies.
3. Who uses a bioenergy research monitoring dashboard?
R&D engineers, plant managers, sustainability teams, and innovation leaders use it to guide pilot projects and scale-up plans.
4. Can this dashboard support pilot and commercial decisions?
Yes. It combines trial-level insights with supply, cost, and compliance data to inform both pilot validation and commercialization.
5. Is the dashboard limited to feedstock testing?
No. While feedstock trials are central, it also supports broader bioenergy technology development dashboard use cases, including scalability and sustainability assessment.