
What is an Electric Power Distribution Center Procurement & Inventory Efficiency Dashboard?
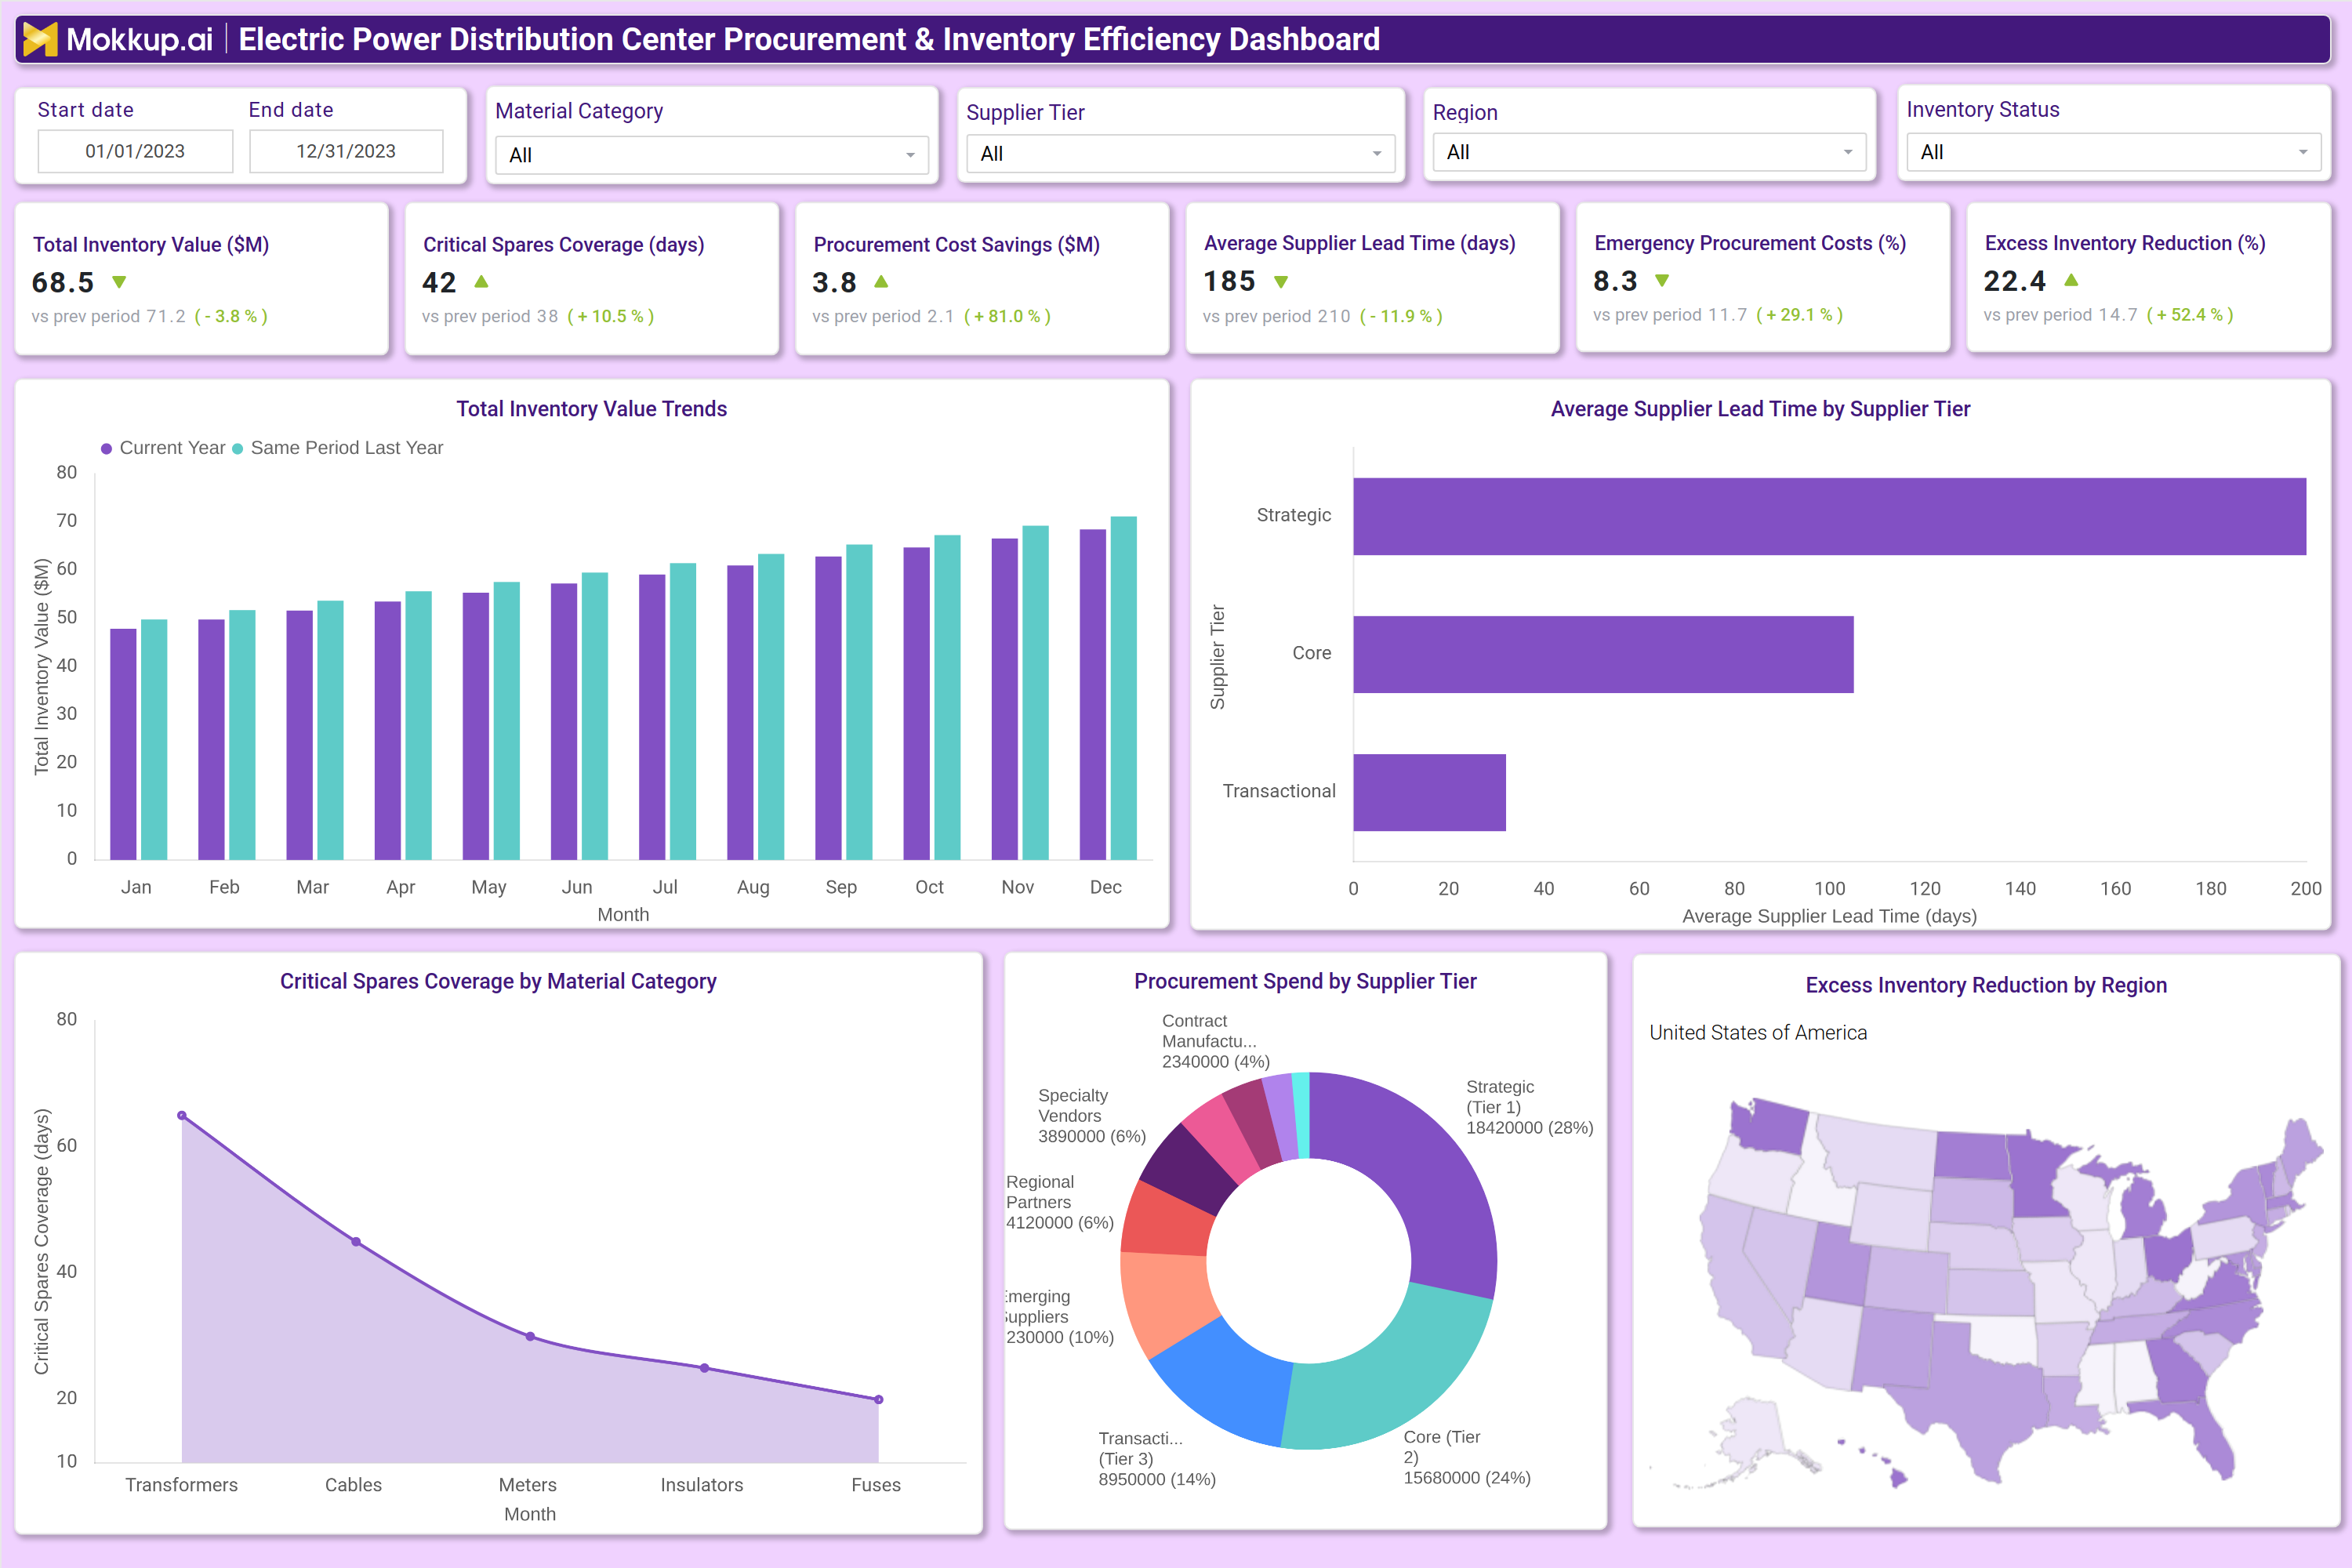
An Electric Power Distribution Center Procurement & Inventory Efficiency Dashboard is a data-driven analytics tool designed to optimize procurement processes and inventory management for distribution system operators (DSOs). This dashboard consolidates procurement spend, supplier performance, inventory levels, and critical spare parts coverage into a single interface. By tracking key performance indicators (KPIs) such as procurement cost savings, supplier lead times, excess inventory reduction, and critical spares coverage, DSOs gain actionable insights to reduce operational costs, prevent stockouts, and improve grid reliability. The dashboard integrates data from enterprise resource planning (ERP) systems, procurement software, and inventory management platforms, enabling utilities to monitor material categories, supplier tiers, regional inventory status, and procurement trends. With interactive filters for date ranges, material types, and supplier performance, decision-makers can identify inefficiencies, negotiate better contracts, and ensure optimal stock levels for grid maintenance and emergency repairs.
How to Create an Electric Power Distribution Center Procurement & Inventory Efficiency Dashboard
You don’t need to build your report from scratch, just start with a ready-to-use dashboard template from Mokkup. Add in your data and export it however you like. Here’s how to do it:
1. Create or Log in to Your Mokkup Account
Start by signing up on Mokkup.ai using your email. If you already have an account, just log in, and you’ll be good to go.
2. Choose and Customize Your Dashboard Template
Find the Electric Power Distribution Procurement & Inventory Efficiency Dashboard template in the Templates section. Use the drag-and-drop editor to adjust KPIs, edit filters, or add elements based on your data.
3. Export to Your BI Tool
Once your dashboard wireframe is ready, use the BI Tool Export feature to send it directly to Power BI or Tableau for further analysis and enhancements. You can also download the dashboard as a PDF, PNG, or JPEG, embed it on a platform, or invite your team to collaborate.
Note: This is a Pro template. You’ll need a Pro subscription on Mokkup to use and customize this dashboard wireframe. Upgrade anytime to unlock full access.
Electric Power Distribution Center Procurement & Inventory Efficiency Dashboard Example
A well-structured DSO inventory efficiency tracking software for utilities provides a comprehensive view of procurement and inventory performance. For instance, the dashboard may display total inventory value trends over a year, comparing current performance with that of the previous period to highlight cost fluctuations. A critical spares coverage chart breaks down stock availability by material category, such as transformers, cables, meters, insulators, and fuses, helping utilities prioritize procurement for high-risk components. The dashboard also includes supplier performance metrics, such as average lead times by supplier tier (strategic, core, transactional), allowing DSOs to assess reliability and negotiate better terms. A procurement spend breakdown by supplier tier reveals cost distribution, while a geographic heatmap shows excess inventory reduction by region, enabling targeted stock optimization. Additionally, KPI tiles highlight procurement cost savings, emergency procurement costs, and excess inventory reduction percentages, providing a quick snapshot of operational efficiency.
How to Analyze Data in an Electric Power Distribution Center Procurement & Inventory Efficiency Dashboard
Here is how you can analyze data from this dashboard:
- Monitor total inventory value trends to identify cost fluctuations and optimize stock levels.
- Track critical spares coverage by material category to prevent stockouts of essential grid components.
- Compare supplier lead times across tiers to assess reliability and negotiate better contracts.
- Analyze procurement cost savings to measure the impact of bulk purchasing and vendor negotiations.
- Review emergency procurement costs to identify recurring issues and improve supplier performance.
- Evaluate excess inventory reduction by region to optimize stock distribution and reduce holding costs.
- Assess procurement spend by supplier tier to reallocate budgets and improve cost efficiency.
- Compare current performance with historical data to detect trends and areas for improvement.
Benefits of an Electric Power Distribution Center Procurement & Inventory Efficiency Dashboard
The following are the benefits of using this electric grid spare parts inventory optimization dashboard:
- Reduce Procurement Costs: Identify savings opportunities and optimize supplier contracts to lower overall procurement spend.
- Prevent Stockouts: Track critical spares coverage and replenishment cycles to ensure essential parts are always available.
- Improve Supplier Performance: Monitor lead times and contract compliance to strengthen supplier accountability and reliability.
- Lower Excess Inventory Costs: Apply data-driven stock optimization to reduce overstocking and carrying costs.
- Enhance Grid Reliability: Ensure the availability of essential spare parts to support uninterrupted operations.
- Streamline Procurement Processes: Automate data tracking and reporting to simplify workflows and reduce manual effort.
- Support Data-Driven Procurement Decisions: Use analytics to guide inventory and sourcing strategies with confidence.
- Increase Operational Efficiency: Reduce manual tracking and improve workflows to boost overall productivity.
KPIs to Track in an Electric Power Distribution Center Procurement & Inventory Efficiency Dashboard
The following key KPIs can be tracked by using this distribution system operator (DSO) procurement KPI dashboard:
- Total Inventory Value ($M): Measures the overall cost of stored materials and spare parts.
- Critical Spares Coverage (Days): Tracks how long current stock can sustain operations before replenishment.
- Procurement Cost Savings ($M): Calculates savings from bulk purchases, negotiations, and supplier discounts.
- Average Supplier Lead Time (Days): Assesses how quickly suppliers deliver materials after order placement.
- Emergency Procurement Costs (%): Monitors unplanned procurement expenses due to stockouts or delays.
- Excess Inventory Reduction (%): Measures the decrease in overstocked materials, reducing holding costs.
Frequently Asked Questions
1. What is the purpose of an Electric Power Distribution Procurement & Inventory Efficiency Dashboard?
It helps DSOs optimize procurement spending, reduce excess inventory, and ensure critical spare parts availability for grid maintenance.
2. What data sources feed into this power distribution asset inventory management dashboard?
ERP systems, procurement software, inventory management platforms, and supplier performance records.
3. Who should use this electric power distribution procurement optimization dashboard?
Procurement managers, inventory planners, operations leaders, and financial analysts in electric power distribution utilities.