The inventory management dashboard template offers a comprehensive view of essential metrics related to inventory management. It consolidates data on stock levels, demand patterns, and supplier performance, providing valuable insights for efficient inventory control. This dashboard is designed to help businesses manage spare parts effectively, reduce stockouts, and ensure the availability of critical components when needed.
The dashboard wireframe comprises two screens: Overview Dashboard & Detailed Movement Analysis; each is explained briefly below.
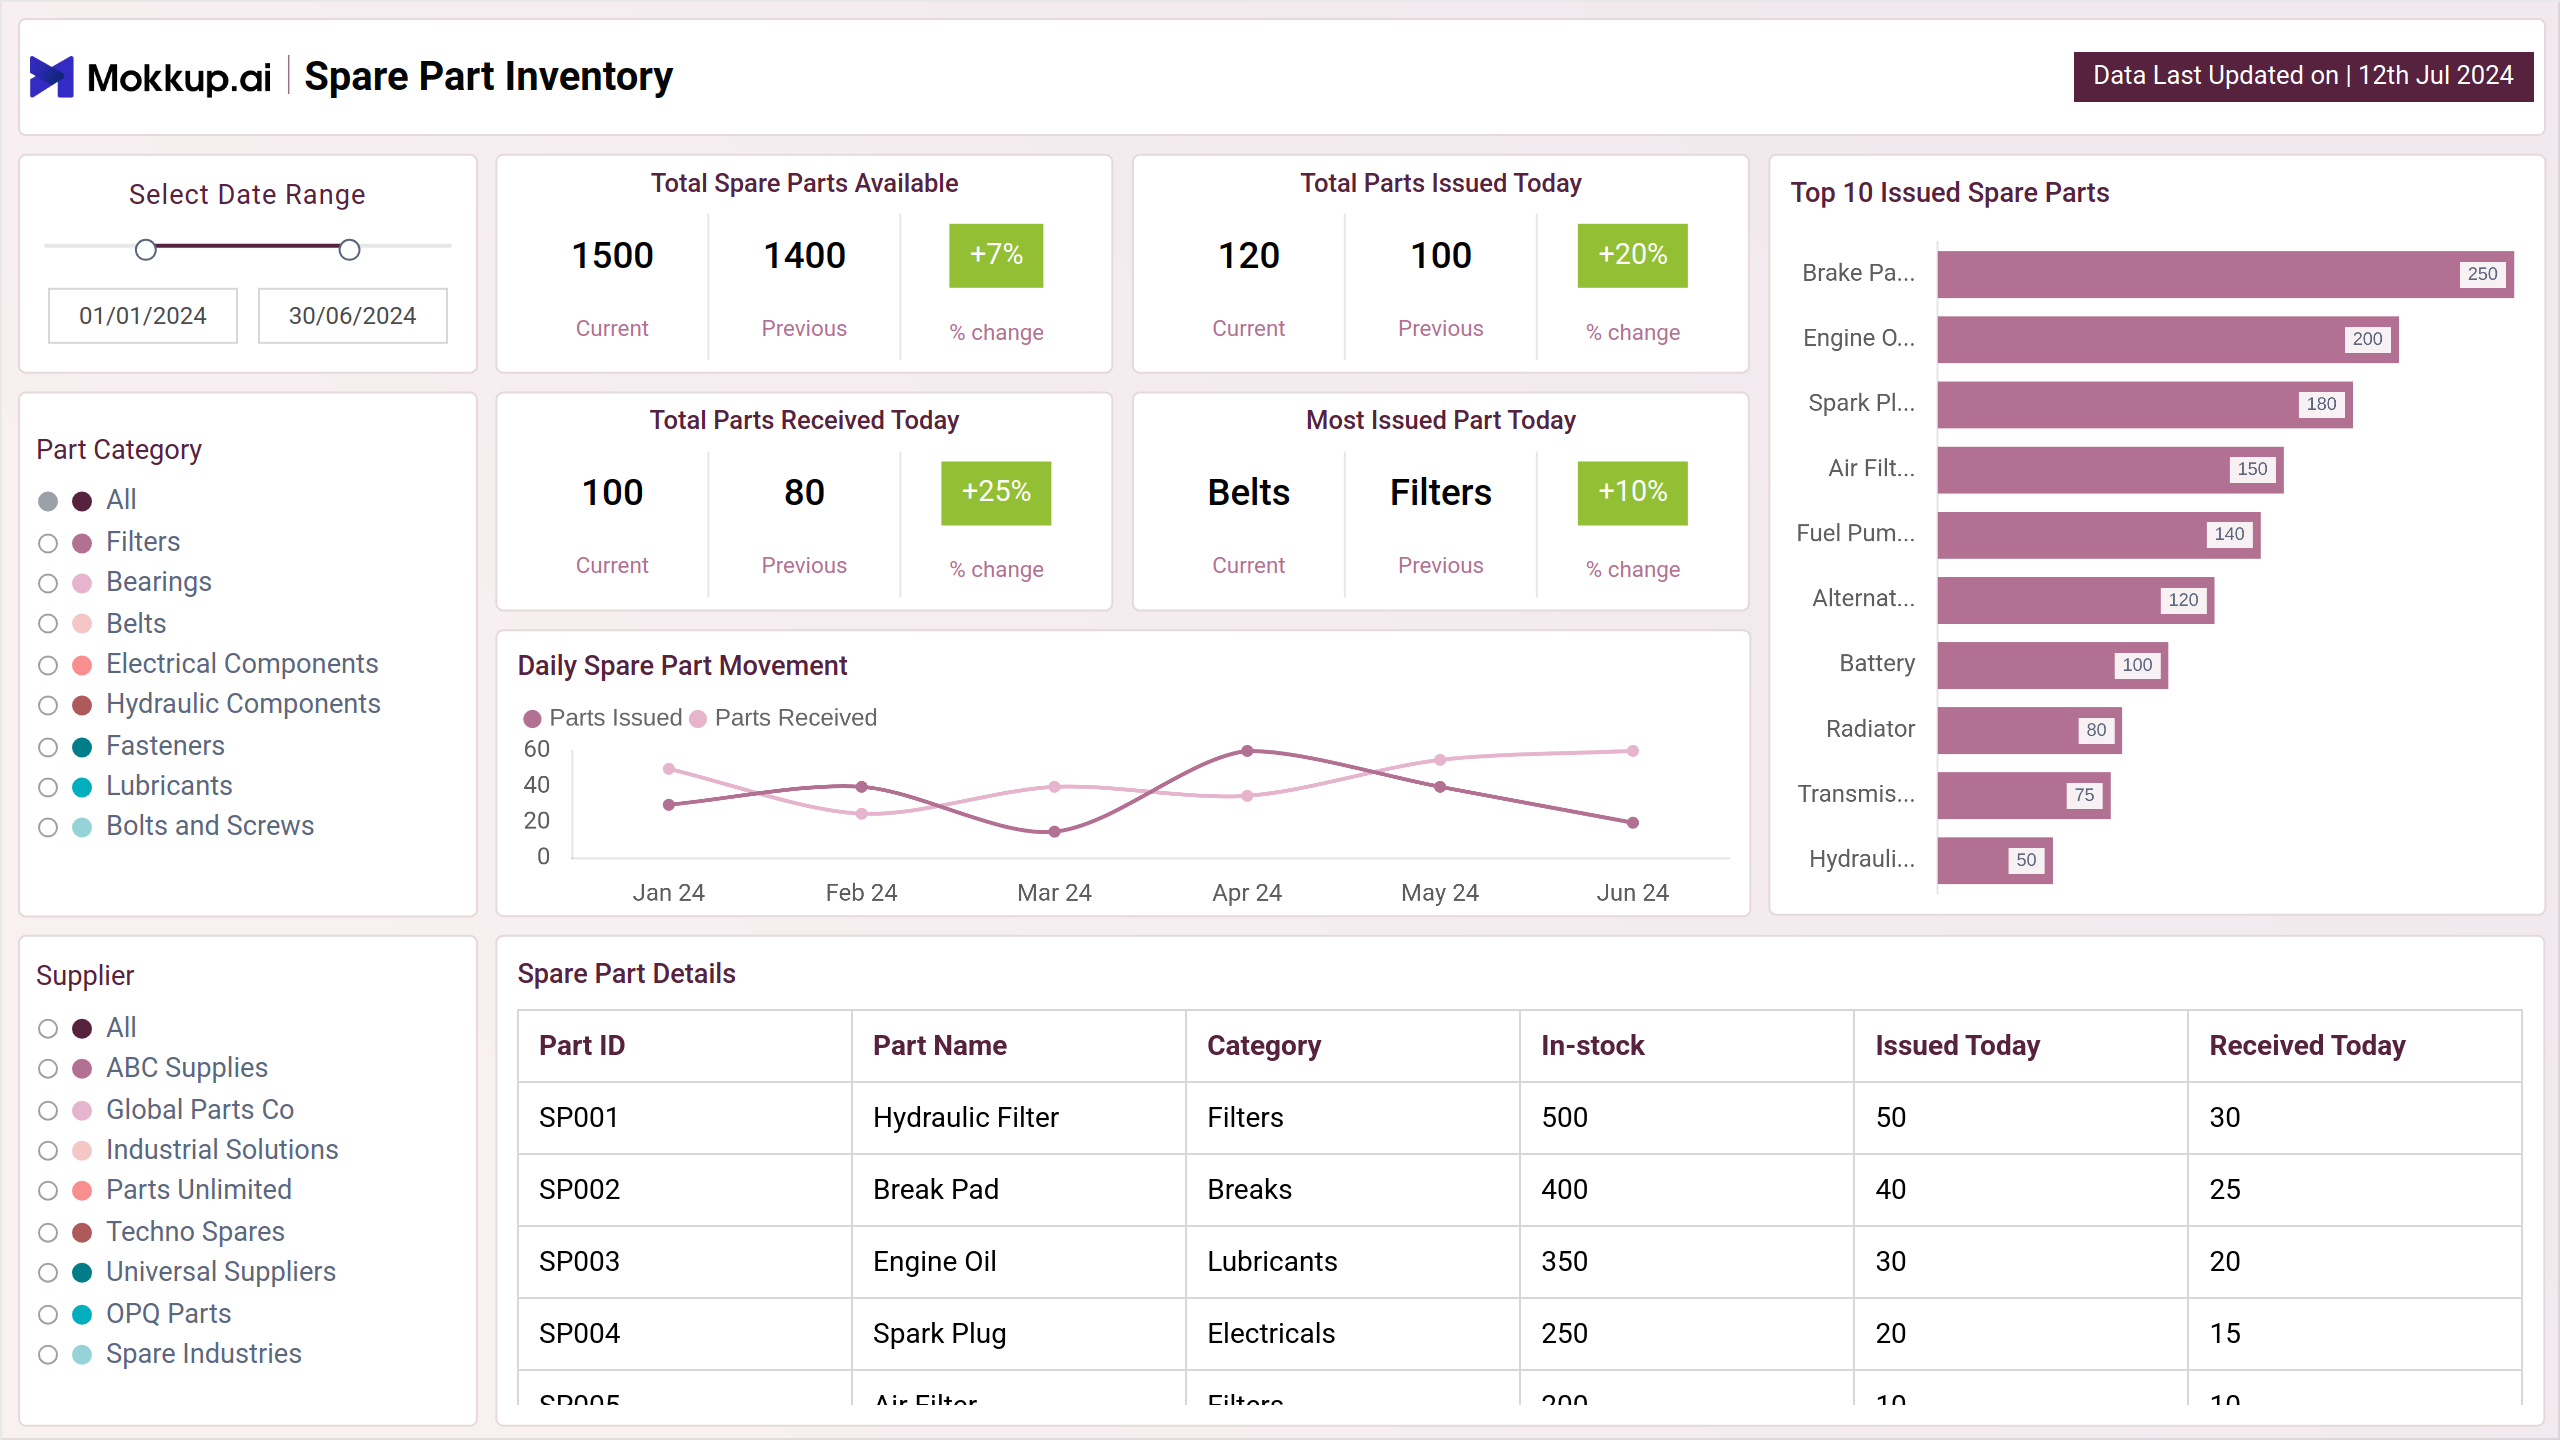
Overview Dashboard
This screen provides a comprehensive overview of the inventory management system. It includes key metrics such as the total number of spare parts available, total parts issued today, and the top 10 issued spare parts. It also visualizes trends in these metrics over time and compares them to previous year's data. By providing a snapshot of the inventory's overall health, this section enables stakeholders to quickly assess the inventory levels, identify potential shortages or surpluses, and make informed decisions about replenishment.
Key Terms to Know
- Total Spare Parts Available: Displays the current number of spare parts in inventory.
- Total Parts Issued Today: Shows the total number of spare parts distributed or used today.
- Total Parts Received Today: Indicates the number of spare parts added to inventory today.
- Most Issued Part Today: Identifies the spare part that has been issued the most today.
- Part Category: Categorizes spare parts based on type or function.
- Daily Spare Part Movement: Summarizes the daily activity of spare parts being issued or received.
- Top 10 Issued Spare Parts: Lists the ten most frequently issued spare parts.
- Spare Part Details: Provides specific information about each spare part, including specifications and usage history.
Detailed Movement Analysis
This view includes information on the total parts issued and received, parts with the lowest stock and highest movement, and the part movement over time. It also visualizes trends in these metrics and compares them to previous year's data. By providing detailed data on spare part movement, this section enables stakeholders to identify areas of inventory optimization, manage stock levels effectively, and minimize stockouts or surpluses.
Key Terms to Know
- Warehouse Distribution: Shows the allocation and distribution of spare parts across different warehouses.
- Parts With Lowest Stock: Identifies the spare parts that are currently at the lowest stock levels.
- Parts With Highest Movement: Highlights the spare parts with the most frequent usage or movement.
- Part Movement Over Time: Tracks the changes in spare part usage and distribution over a specified period.
- Spare Part Stock Breakdown: Provides a detailed analysis of the stock levels for different spare parts.
- Spare Parts by Category: Organizes spare parts into categories based on their type or usage.
Dashboard Template Insights
Here are four key achievements of this dashboard wireframe:
- Provides clear insights into parts with the lowest stock, helping to prevent shortages and maintain necessary inventory levels.
- Highlights parts with the highest movement, enabling better resource allocation and replenishment strategies.
- Offers a detailed view of parts distribution across warehouses, ensuring efficient storage and accessibility.
- Analyzes part movement over time, aiding in understanding trends and making informed decisions for future inventory needs.
Conclusion
In conclusion, this dashboard wireframe provides valuable insights into inventory levels, part movement, and warehouse distribution. By consolidating key metrics, this dashboard supports informed decision-making, helping businesses manage their spare parts inventory effectively. It is designed to enhance resource planning, reduce stock shortages, and improve overall inventory management, ensuring that critical components are always available when needed.