What is an Electric Power Distribution Center Industrial Customer Portfolio & Revenue Dashboard?
An electric power distribution center industrial customer portfolio & revenue dashboard is a data-driven analytics tool designed for distribution system operators (DSOs) to monitor, analyze, and optimize revenue streams from large-scale industrial clients. This dashboard consolidates key financial and operational metrics—such as total industrial revenue, revenue per customer, consumption volumes, contract values, and churn risk—into a single, interactive interface. By integrating electric utility revenue tracking for industrial clients, the dashboard helps DSOs assess profitability, identify high-value customers, and detect revenue leakage. It also provides insights into industrial energy consumption patterns, enabling utilities to forecast demand, optimize pricing strategies, and improve customer retention. With filters for customer segments, contract types, and regions, decision-makers can drill down into specific data points to refine their industrial portfolio management.
How to Create an Electric Power Distribution Center Industrial Customer Portfolio & Revenue Dashboard
You don’t need to build your report from scratch, just start with a ready-to-use dashboard template from Mokkup. Add in your data and export it however you like. Here’s how to do it:
1. Create or Log in to Your Mokkup Account
Start by signing up on Mokkup.ai using your email. If you already have an account, just log in, and you’ll be good to go.
2. Choose and Customize Your Dashboard Template
Find the Electric Power Distribution Center Industrial Customer Portfolio & Revenue Dashboard template in the Templates section. Use the drag-and-drop editor to adjust KPIs, edit filters, or add elements based on your data.
3. Export to Your BI Tool
Once your dashboard wireframe is ready, use the BI Tool Export feature to send it directly to Power BI or Tableau for further analysis and enhancements. You can also download the dashboard as a PDF, PNG, or JPEG, embed it on a platform, or invite your team to collaborate.
Note: This is a Pro template. You’ll need a Pro subscription on Mokkup to use and customize this dashboard wireframe. Upgrade anytime to unlock full access.
Electric Power Distribution Center Industrial Customer Portfolio & Revenue Dashboard Example
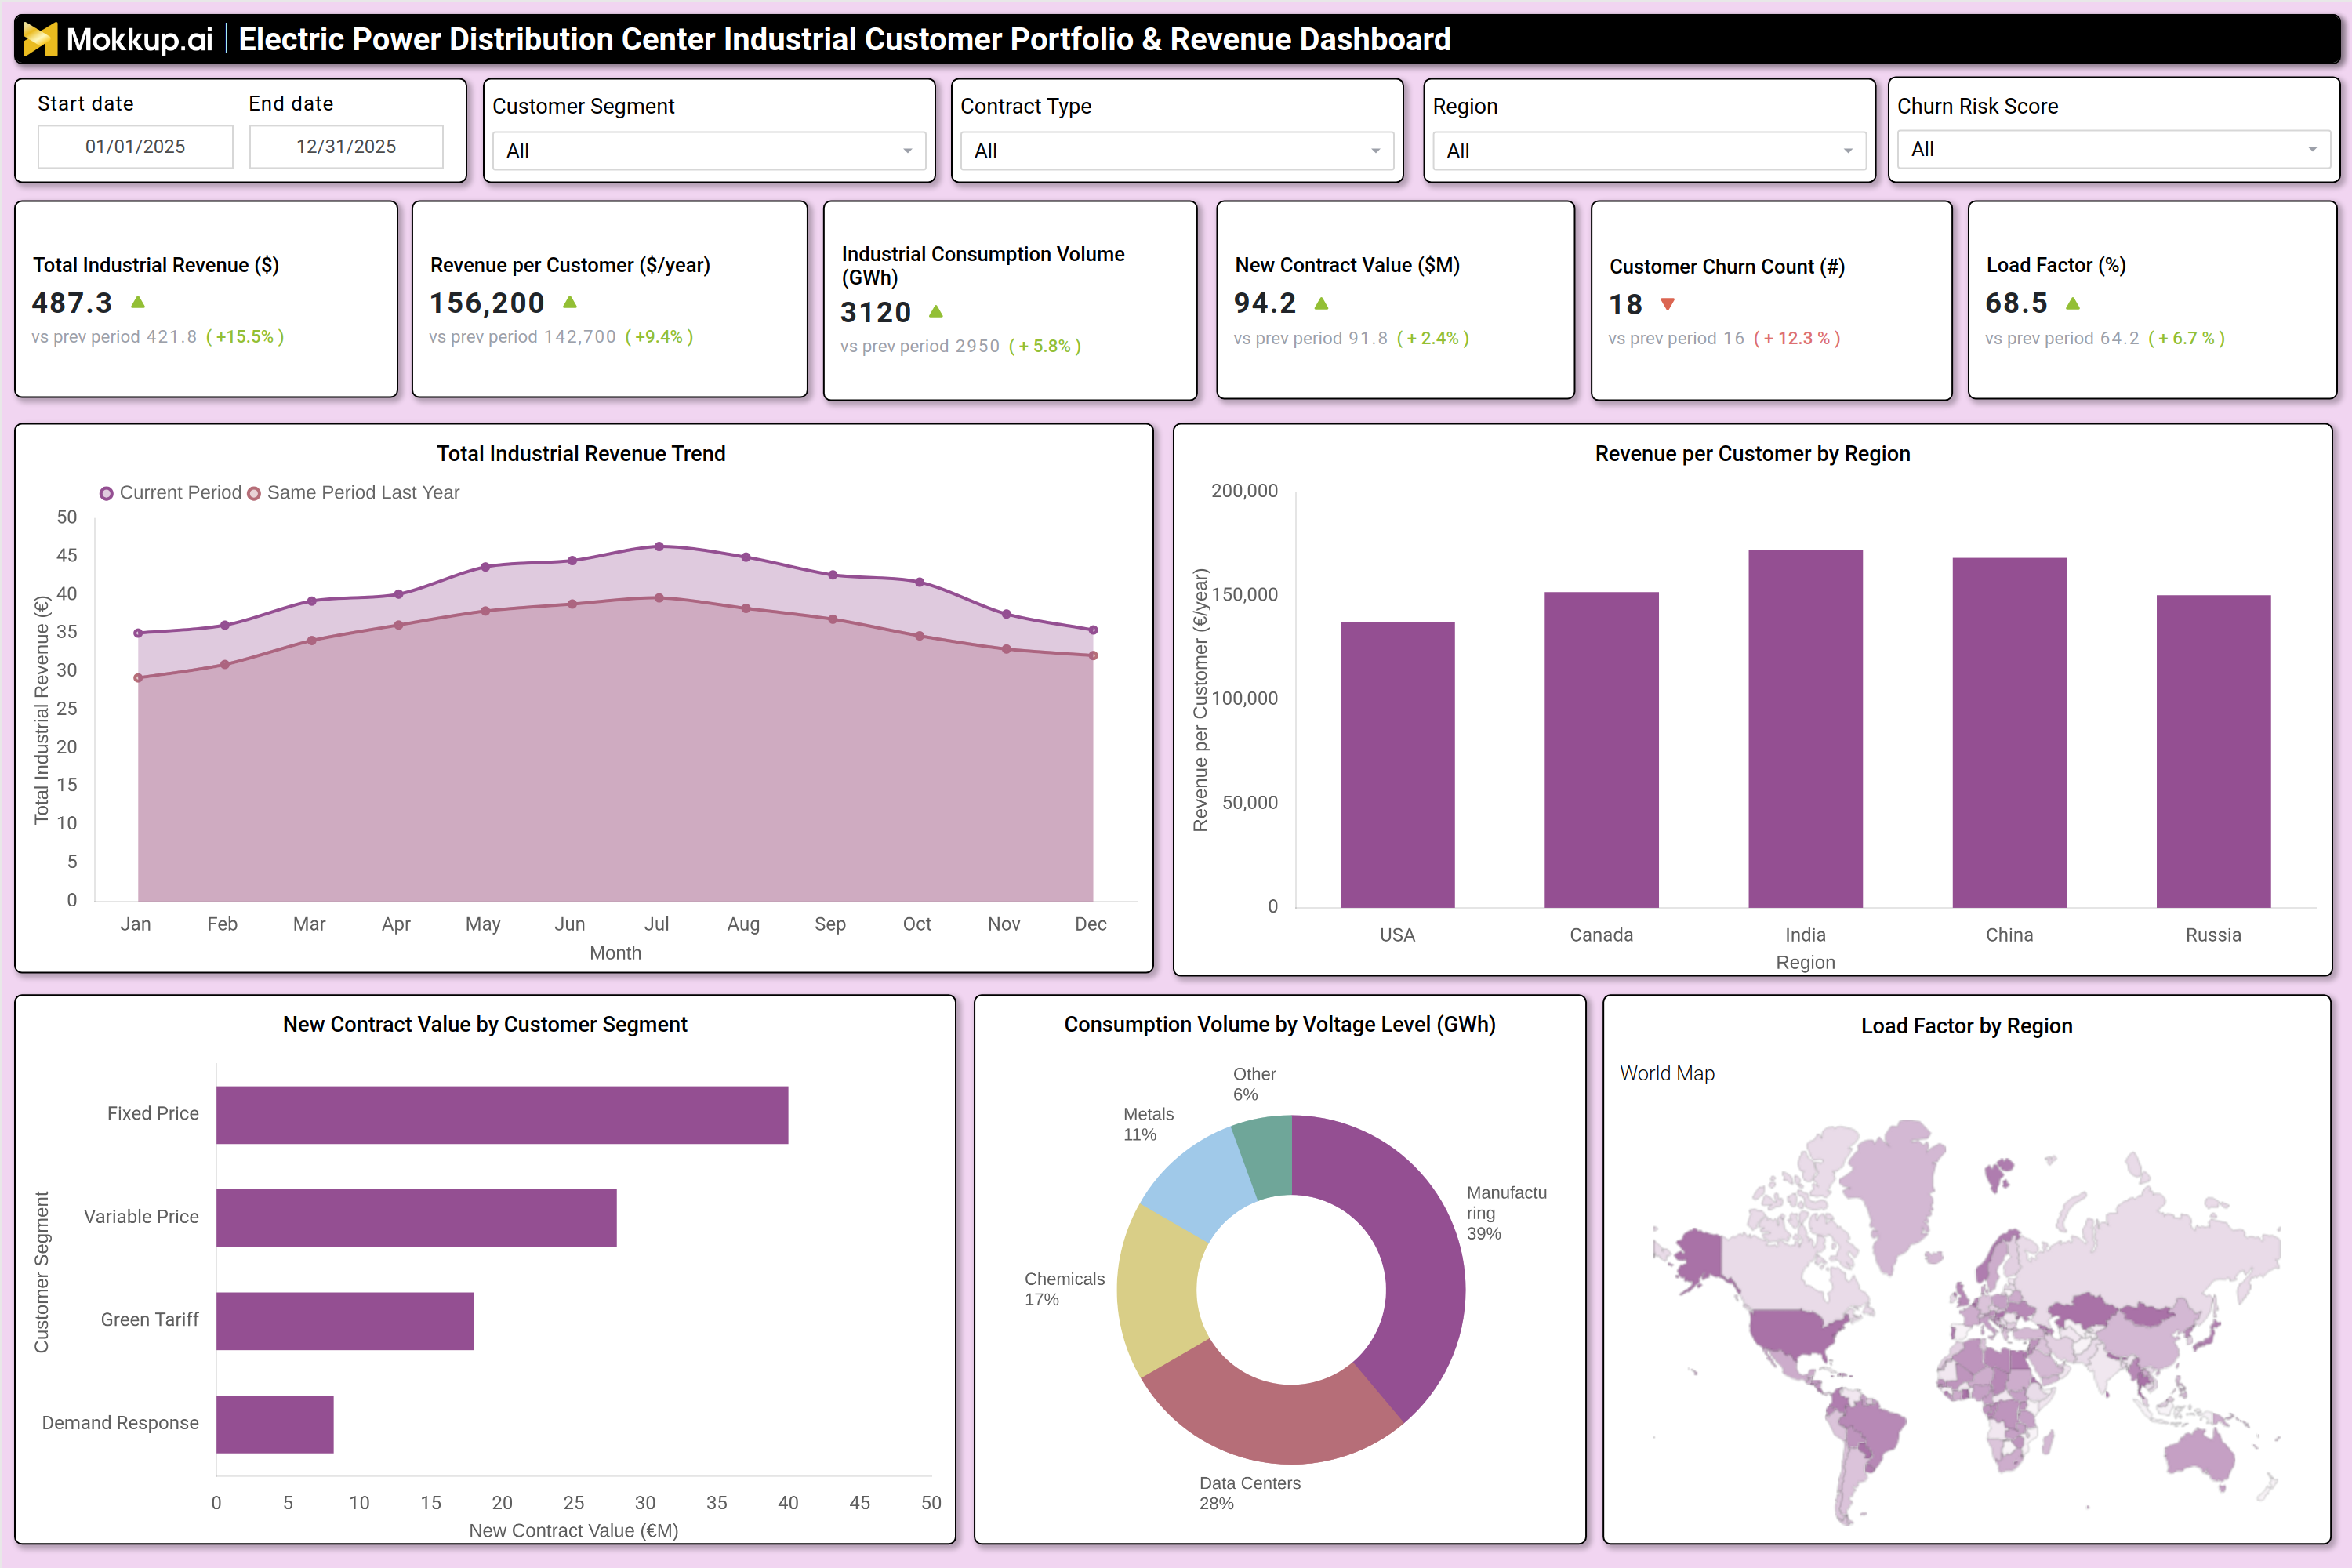
A well-structured power distribution center revenue management dashboard includes dynamic filters for date ranges, customer segments, contract types, and geographic regions. Key performance tiles display total industrial revenue, revenue per customer, industrial consumption volume (GWh), new contract value, customer churn count, and load factor percentage, along with year-over-year comparisons. Trend charts track industrial revenue trends (€/MWh) over time, while bar graphs compare revenue per customer by region, highlighting high revenue markets like China, India, and Canada. A new contract value breakdown by customer segment (fixed price, variable price, green tariff, demand response) helps utilities assess contract performance. Meanwhile, a consumption volume pie chart by voltage level reveals which industrial sectors (manufacturing, data centers, chemicals) drive the most demand. A world map visualizes load factor by region, enabling DSOs to identify efficiency gaps and optimize grid performance. Together, these components form a DSO customer analytics dashboard for industrial power consumption, providing actionable insights for revenue growth and operational efficiency.
How to Analyze Data in an Electric Power Distribution Center Industrial Customer Portfolio & Revenue Dashboard
Here is how you can analyze data from this dashboard:
- Track total industrial revenue trends to assess overall financial health and identify growth or decline patterns.
- Monitor revenue per customer to evaluate profitability across different industrial segments.
- Analyze industrial consumption volume (GWh) to detect demand fluctuations and optimize grid capacity planning.
- Review new contract values to measure the success of customer acquisition strategies.
- Assess customer churn count to identify at risk industrial clients and implement retention strategies.
- Evaluate load factor percentages to improve grid efficiency and reduce operational costs.
- Compare revenue by region to prioritize high value markets and allocate resources effectively.
- Break down consumption by voltage level to understand sectorspecific demand and tailor pricing models.
- Examine contract types to determine which pricing structures (fixed, variable, green tariff) drive the most revenue.
Benefits of an Electric Power Distribution Center Industrial Customer Portfolio & Revenue Dashboard
The following are the benefits of using this industrial contract performance dashboard:
- Enhance Revenue Visibility: Track industrial customer portfolios and financial performance to gain clearer insights into revenue contribution.
- Improve Customer Retention: Identify churn risks and high-value clients to strengthen relationships and maintain long-term contracts.
- Optimize Pricing Strategies: Use consumption and revenue analytics to refine pricing models for industrial customers.
- Support Demand Forecasting: Analyze industrial energy consumption data to predict demand and improve planning.
- Reduce Revenue Leakage: Monitor contract performance to ensure accurate billing and prevent revenue loss.
- Enable Data-Driven Decision-Making: Provide actionable insights to guide industrial sector engagement and strategic initiatives.
- Streamline Reporting: Automate KPI tracking and trend analysis to deliver consistent and efficient reporting.
- Boost Operational Efficiency: Align grid capacity planning with industrial demand to optimize resource utilization.
KPIs to Track in an Electric Power Distribution Center Industrial Customer Portfolio & Revenue Dashboard
The following key KPIs can be tracked by using this DSO grid performance dashboard:
- Total Industrial Revenue (€): Measures overall revenue generated from industrial customers.
- Revenue per Customer (€/year): Tracks average revenue contribution per industrial client.
- Industrial Consumption Volume (GWh): Monitors total energy consumption by industrial sectors.
- New Contract Value (€M): Evaluates the financial impact of newly acquired industrial contracts.
- Customer Churn Count (#): Tracks the number of industrial customers lost within a period.
- Load Factor (%): Assesses grid efficiency by comparing actual vs. peak energy usage.
- Revenue Growth Rate (%): Measures year-over-year revenue growth from industrial clients.
Frequently Asked Questions
1. What is an industrial customer portfolio dashboard for electric power distribution centers?
It is an analytics tool that tracks revenue, consumption, and customer retention for industrial clients in power distribution utilities.
2. How does an electric utility revenue tracking dashboard benefit DSOs?
It helps utilities optimize pricing, reduce churn, and improve financial performance by monitoring industrial customer data..
3. What data sources feed into this power distribution portfolio dashboard?
Billing systems, customer relationship management (CRM) tools, smart meters, and contract management platforms.