What is an Electric Power Distribution Center Grid Sustainability & Compliance Dashboard?
An Electric Power Distribution Center Grid Sustainability & Compliance Dashboard is a data-driven analytics platform designed for distribution system operators (DSOs) to monitor environmental performance, regulatory adherence, and grid efficiency. The regulatory compliance dashboard for distribution system operators consolidates emissions tracking, energy losses, renewable integration, and compliance metrics into a single interface, enabling the Center to meet sustainability targets while avoiding penalties.
By integrating carbon footprint monitoring, SF₆ emissions tracking, and regulatory fine analysis, the dashboard helps DSOs optimize operations, reduce environmental impact, and ensure compliance with local and international regulations. It provides actionable insights for grid modernization, renewable energy deployment, and emissions reduction strategies, making it an essential tool for sustainable power distribution management.
How to Create an Electric Power Distribution Center Grid Sustainability & Compliance Dashboard
You don’t need to build your report from scratch; just start with a ready-to-use dashboard template from Mokkup. Add in your data and export it however you like. Here’s how to do it:
1. Create or Log in to Your Mokkup Account
Start by signing up on Mokkup.ai using your email. If you already have an account, just log in, and you’ll be good to go.
2. Choose and Customize Your Dashboard Template
Find the Grid Sustainability & Compliance Dashboard template in the Templates section. Use the drag and drop editor to adjust KPIs, edit filters, or add elements based on your data.
3. Export to Your BI Tool
Once your dashboard wireframe is ready, use the BI Tool Export feature to send it directly to Power BI or Tableau for further analysis and enhancements. You can also download the dashboard as a PDF, PNG, or JPEG, embed it on a platform, or invite your team to collaborate.
Note: This is a Pro template. You’ll need a Pro subscription on Mokkup to use and customize this dashboard wireframe. Upgrade anytime to unlock full access.
Electric Power Distribution Center Grid Sustainability & Compliance Dashboard Example
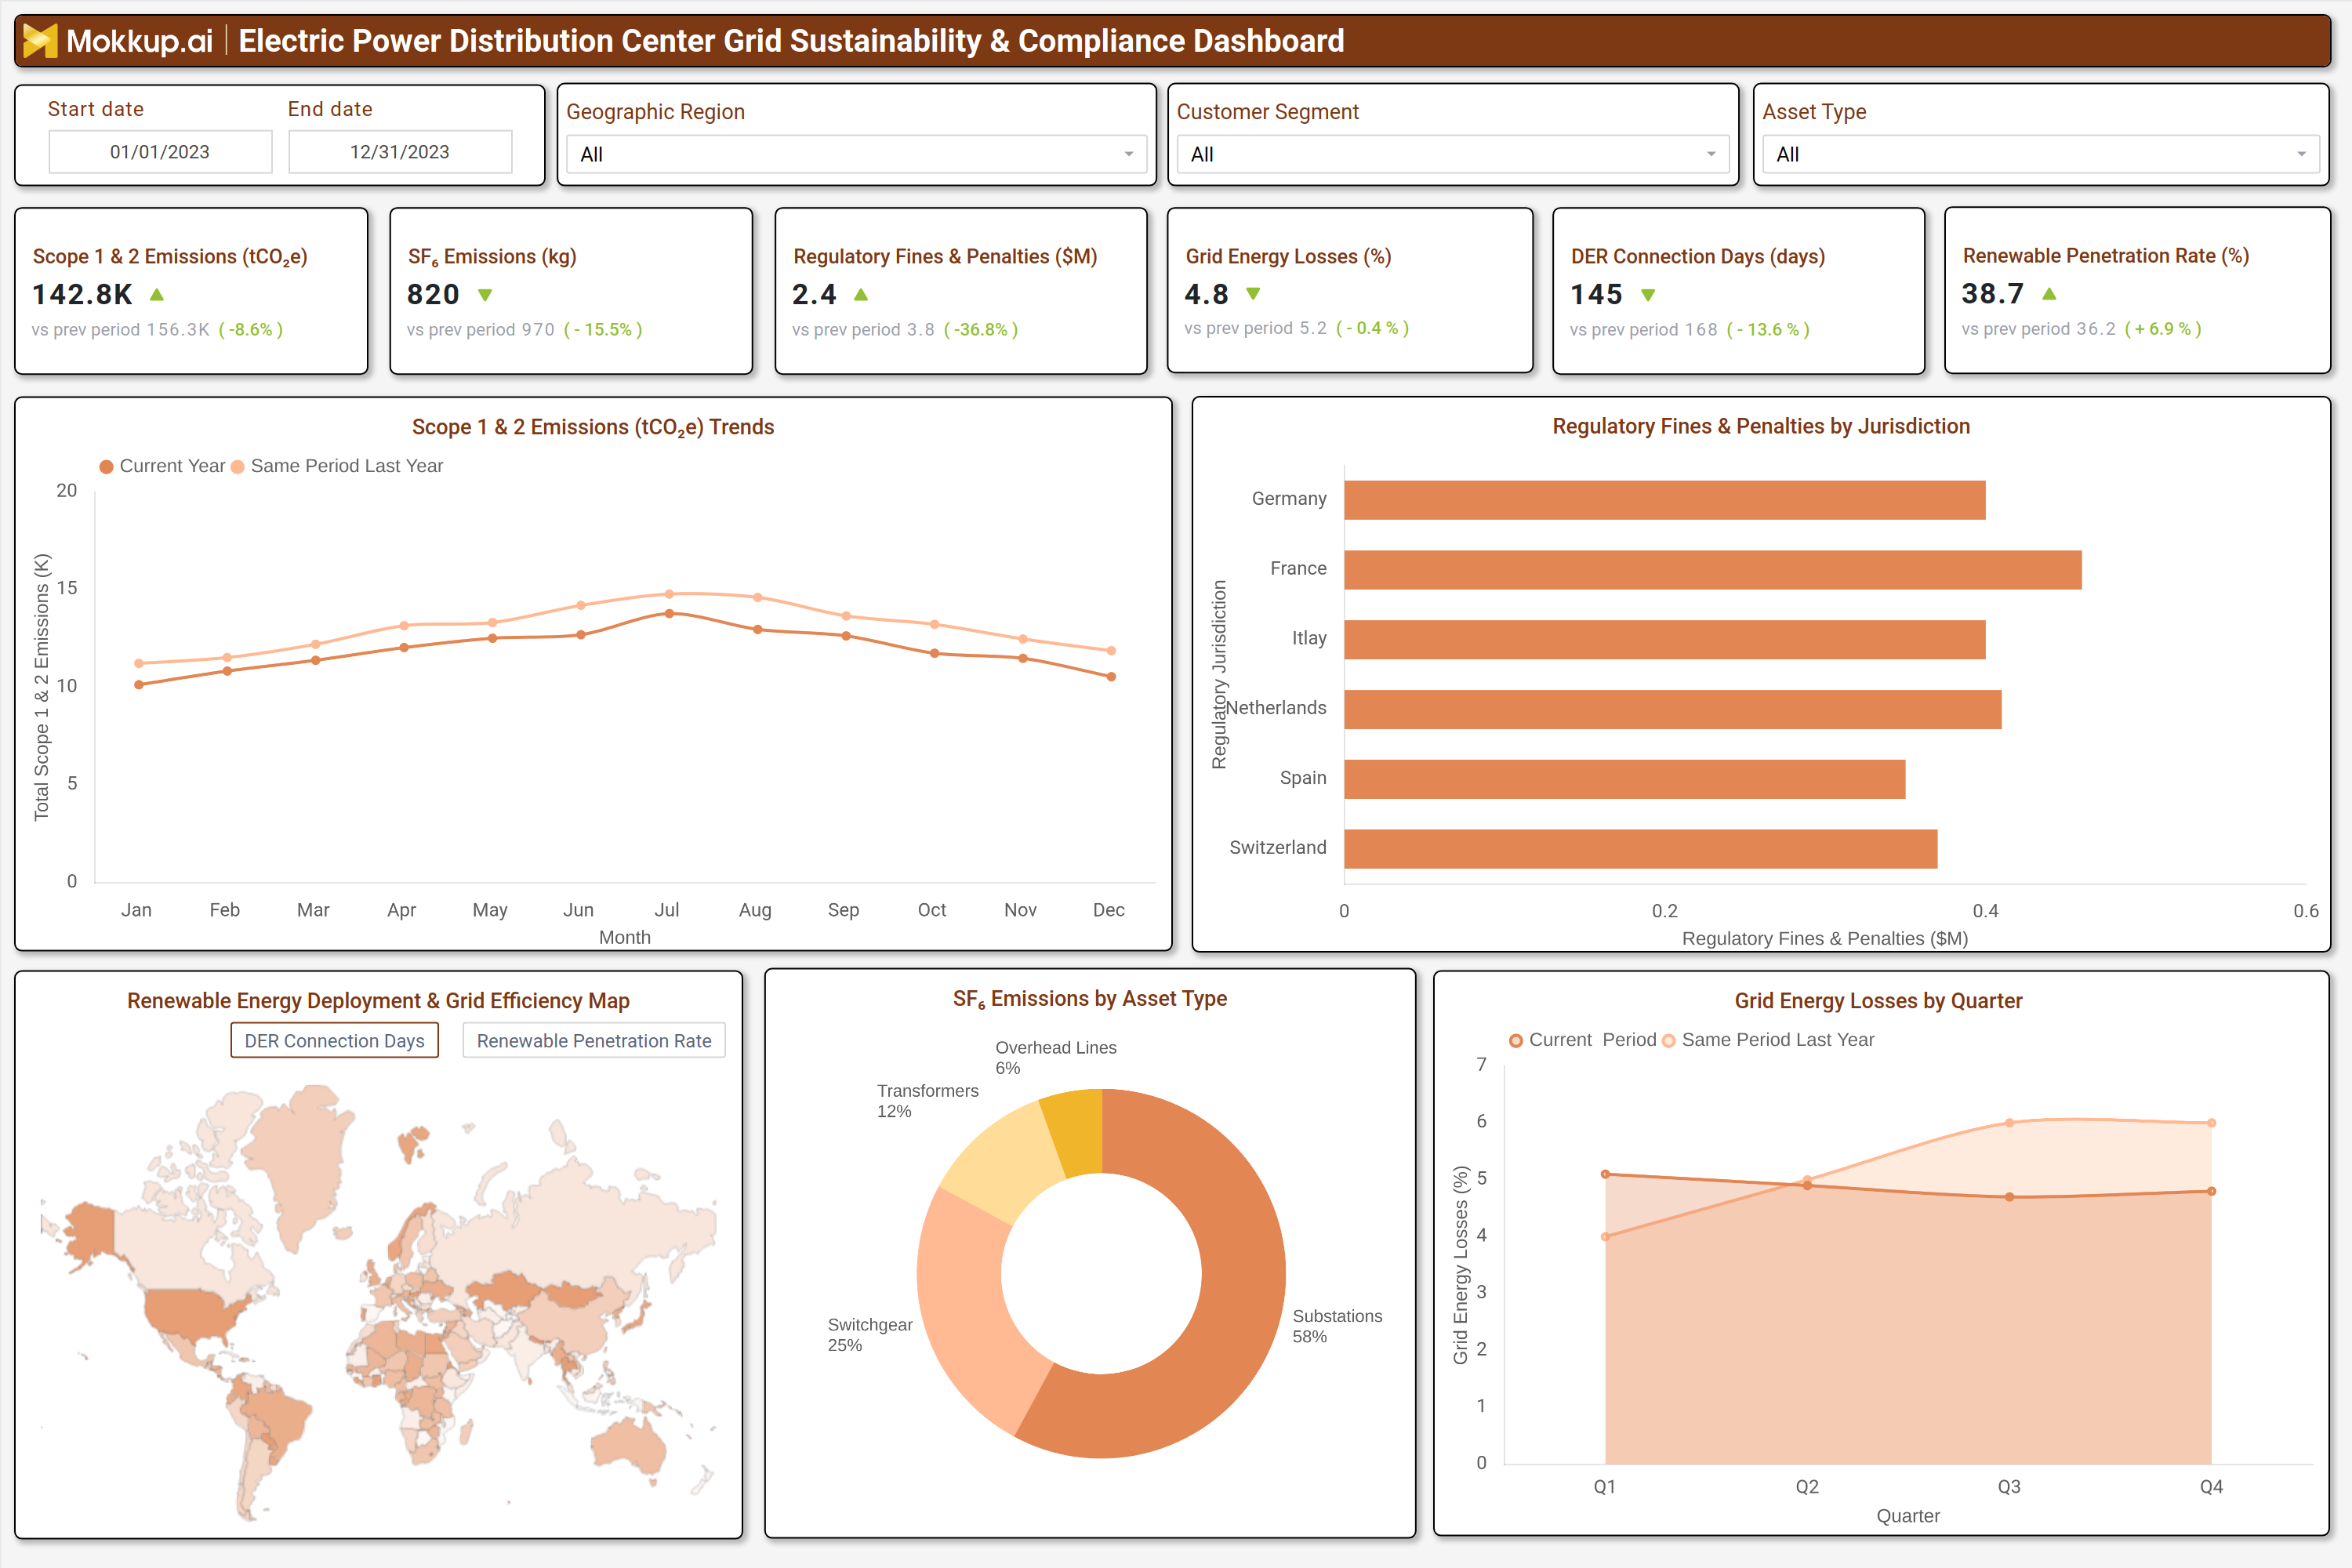
A well-structured regulatory compliance dashboard for distribution system operators (DSOs) includes interactive filters for date ranges, geographic regions, customer segments, and asset types. Key performance tiles display Scope 1 & 2 emissions (tCO₂e), SF₆ emissions (kg), regulatory fines ($M), grid energy losses (%), distributed energy resource (DER) connection days, and renewable penetration rate (%).
Trend charts compare current year emissions against historical data, while a regulatory fines breakdown by jurisdiction highlights compliance risks. A renewable energy deployment map visualizes DER connection days and renewable penetration rates across service territories. Additionally, SF₆ emissions by asset type (substations, switchgear, transformers, overhead lines) help identify high-emission infrastructure for targeted upgrades. Together, these components form a comprehensive sustainability and compliance monitoring system, enabling DSOs to track progress, optimize grid efficiency, and ensure regulatory adherence.
How to Analyze Data in an Electric Power Distribution Center Grid Sustainability & Compliance Dashboard
Here is how you can analyze data from this automated regulatory reporting for the Power Distribution Center dashboard:
- Monitor Scope 1 & 2 emissions trends to assess progress toward decarbonization goals.
- Track SF₆ emissions by asset type to identify high-leakage equipment for replacement.
- Analyze regulatory fines by jurisdiction to prioritize compliance improvements in high-risk regions.
- Compare grid energy losses against historical data to detect inefficiencies in distribution networks.
- Evaluate DER connection days to streamline renewable energy integration processes.
- Assess renewable penetration rates to measure progress toward clean energy adoption.
- Review emissions and compliance metrics by region to allocate resources effectively.
- Benchmark performance against industry standards to identify areas for improvement.
Benefits of a Electric Power Distribution Center Grid Sustainability & Compliance Dashboard
The following are the benefits of using this carbon footprint monitoring for electric grid operators dashboard:
- Enhances regulatory compliance by automating emissions and fine tracking.
- Reduces carbon footprint through data driven emissions reduction strategies.
- Improves grid efficiency by identifying and minimizing energy losses.
- Accelerates renewable energy adoption with DER integration analytics.
- Lowers operational costs by optimizing asset performance and reducing fines.
- Supports sustainability reporting with automated data collection and visualization.
- Enables proactive compliance management by flagging potential regulatory risks.
- Strengthens stakeholder trust with transparent sustainability performance tracking.
KPIs to Track in an Electric Power Distribution Center Grid Sustainability & Compliance Dashboard
The following key KPIs can be tracked by using this automated regulatory reporting for the Power Distribution Center dashboard, enabling stronger grid sustainability analytics for electric power distribution:
- Scope 1 & 2 Emissions (tCO₂e) – Measures total greenhouse gas emissions from utility operations.
- SF₆ Emissions (kg) – Tracks sulfur hexafluoride leaks from highvoltage equipment.
- Regulatory Fines & Penalties ($M) – Monitors financial penalties due to noncompliance.
- Grid Energy Losses (%) – Measures energy lost during transmission and distribution.
- DER Connection Days (days) – Tracks time taken to connect distributed energy resources.
- Renewable Penetration Rate (%) – Indicates the share of renewable energy in the grid.
Frequently Asked Questions
1. What is the purpose of a sustainability dashboard for an electric power distribution Center?
It helps DSOs track emissions, energy efficiency, and regulatory compliance to meet sustainability goals and avoid penalties.
2. How does this dashboard improve regulatory compliance?
By automating emissions reporting, tracking fines, and flagging noncompliance risks before they escalate.
3. Who should use grid sustainability analytics for an electric power distribution dashboard?
Utility managers, sustainability officers, regulatory compliance teams, and grid operators.