
What is a Tele-Mental Health Utilization Dashboard?
A Tele-Mental Health Utilization Dashboard template designed to monitor, evaluate, and optimize the performance of virtual mental health services. It helps clinics track patient interactions, session utilization, appointment adherence, and clinical efficiency. By visualizing KPIs such as session success rate, average call duration, missed appointments, and patient satisfaction, clinics can gain actionable insights to improve service delivery. These dashboards bridge the gap between healthcare and IT by integrating analytics into everyday mental health practices. They support clinicians, administrators, and policymakers with clear metrics, enabling better decisions for improving patient engagement and reducing dropout rates.
How To Create Tele-Mental Health Utilization Dashboards?
You don’t need to build your report from scratch—just start with a ready-to-use Tele-Mental Health Utilization dashboard template from Mokkup. Plug in your own data and export it however you like. Here’s how to do it:
1. Create or Log in to Your Mokkup Account
Start by signing up on Mokkup.ai using your email. Already have an account? Just log in, and you’re good to go.
2. Choose and Customize Your Dashboard Template
Find the Tele-Mental Health Utilization Dashboard template in the Templates section. Use the drag-and-drop editor to adjust KPIs, edit filters, or add elements based on your data.
3. Export to Your BI Tool
Once your dashboard is ready, use the BI Tool Export feature to send it directly to Power BI or Tableau for further analysis and enhancements. You can also download the dashboard as a PDF, PNG, or JPEG, embed it on a platform, or invite your team to collaborate.
Note: This is a Pro template. To use and customize this dashboard wireframe, you’ll need a Pro subscription on Mokkup. Upgrade anytime to unlock full access.
Tele-Mental Health Utilization Dashboard Example
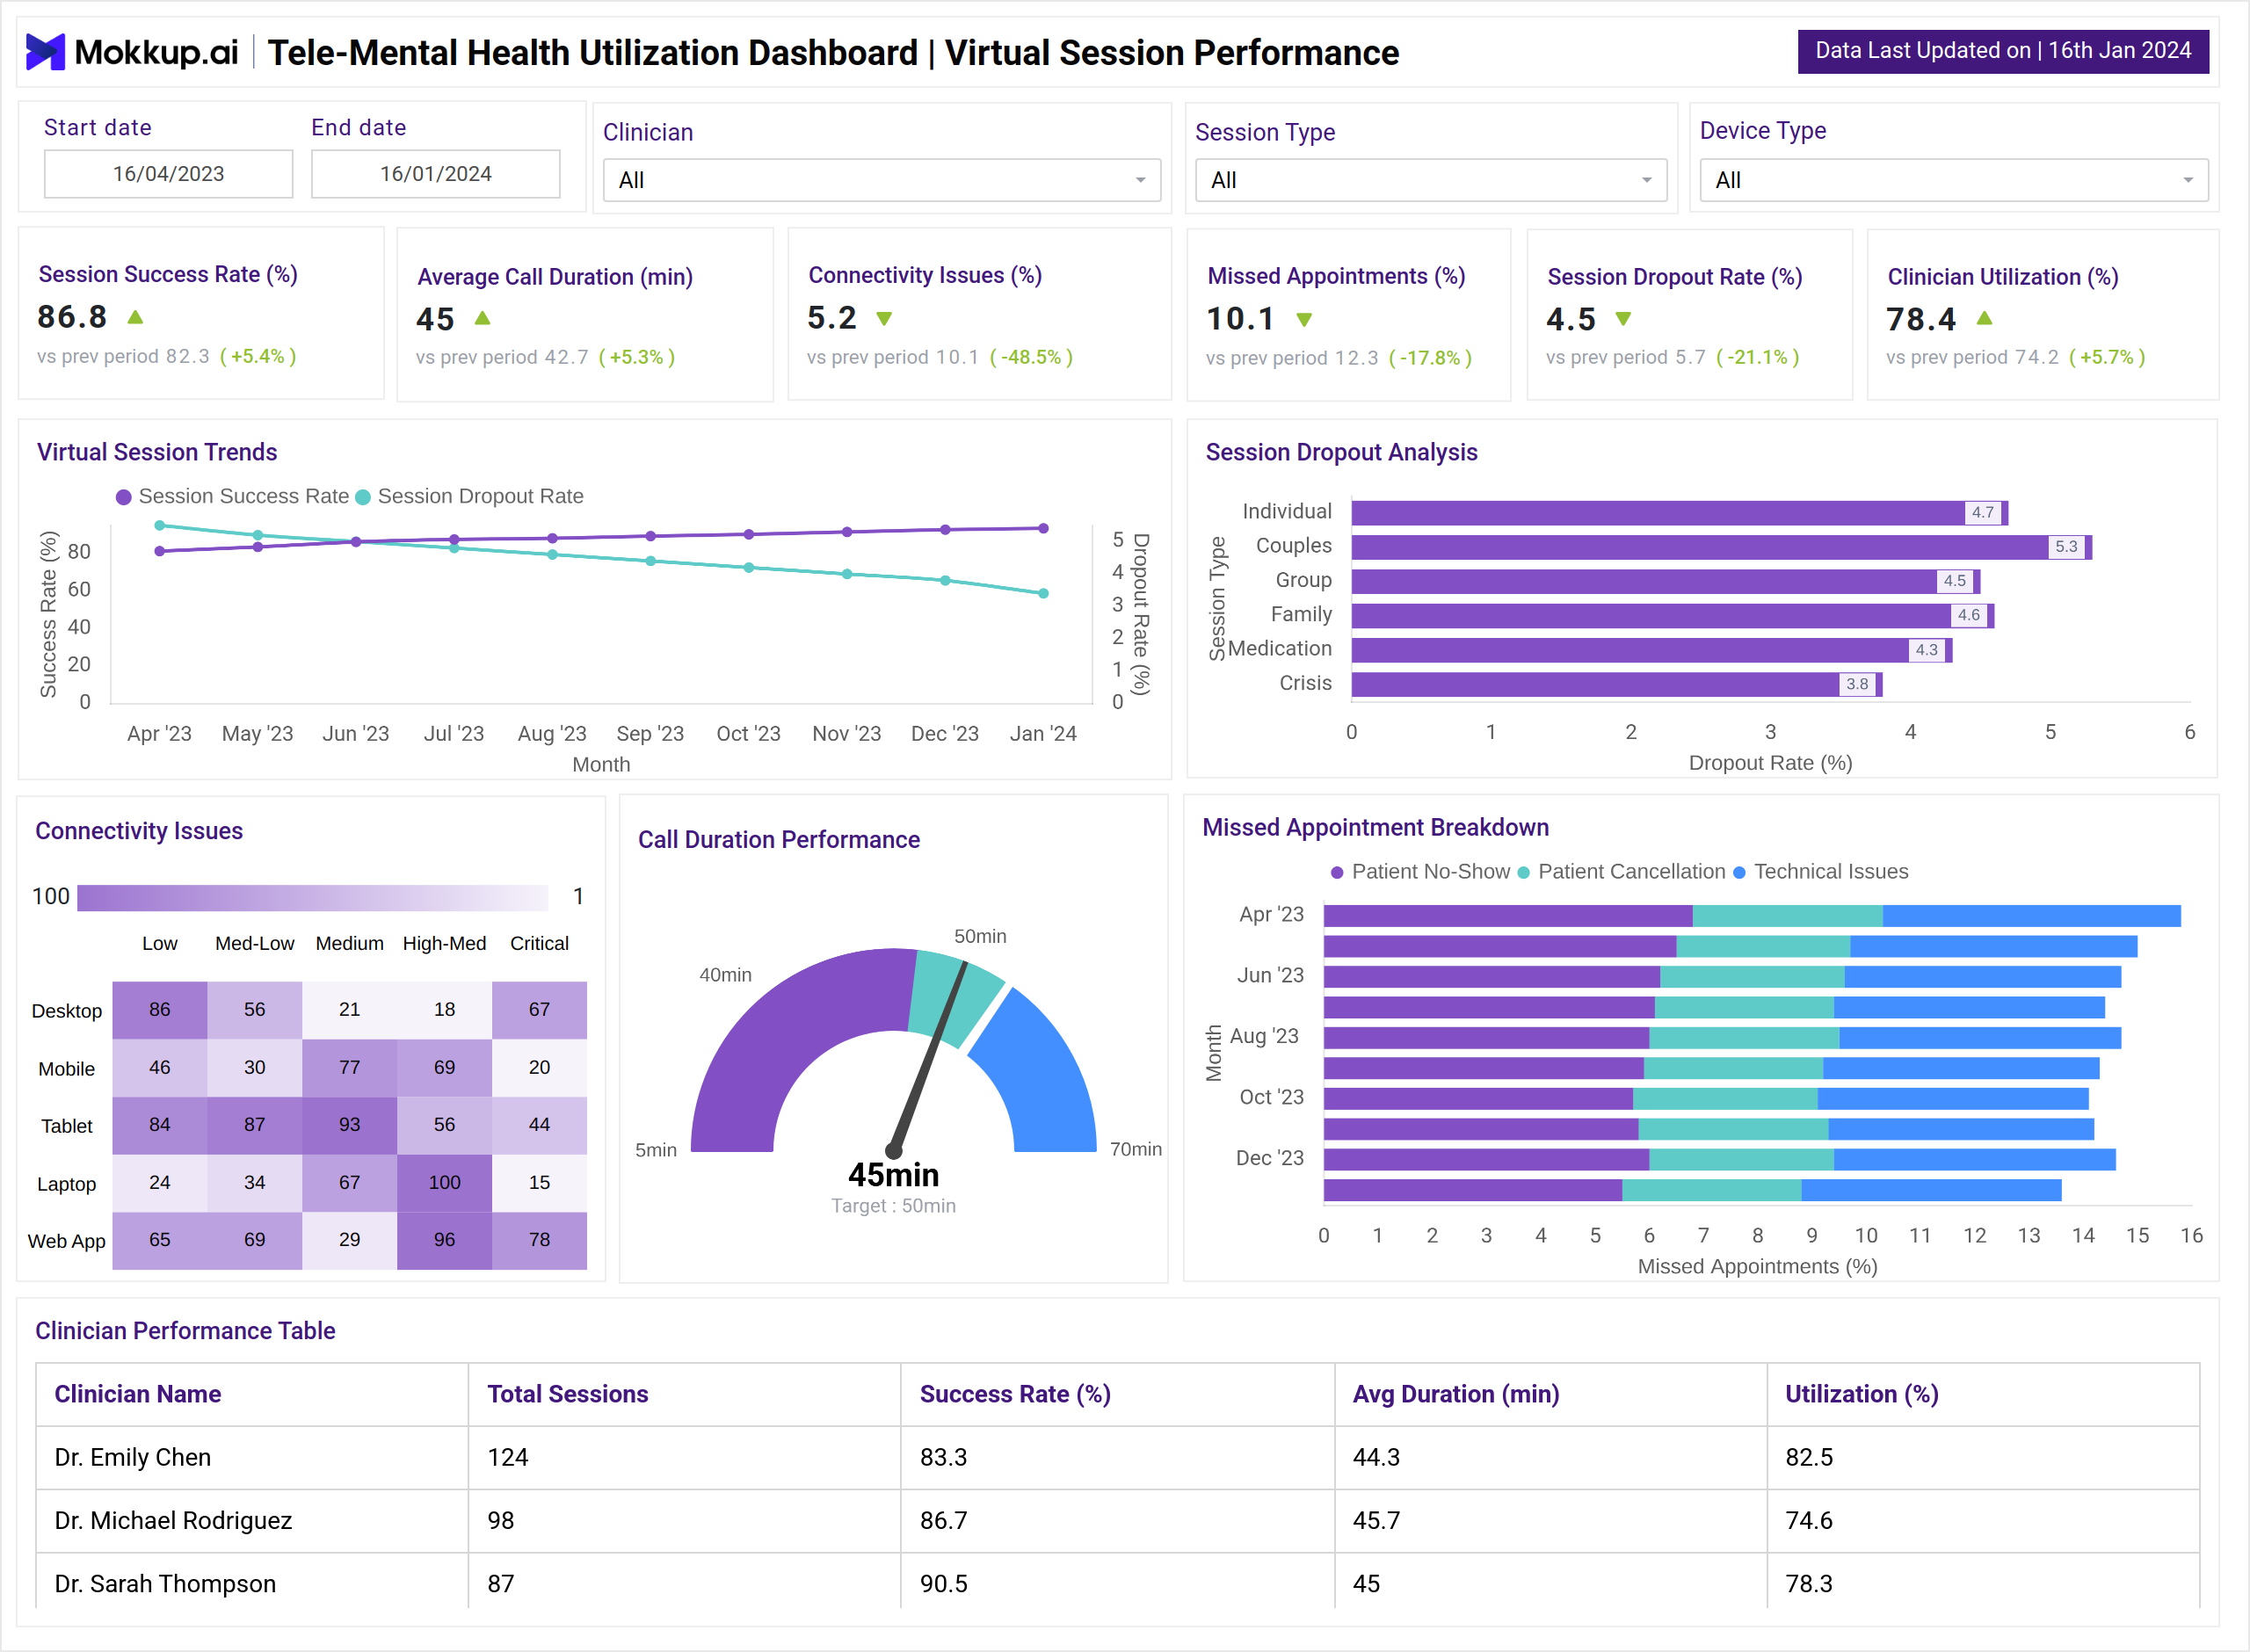
The Tele-Mental Health Utilization Dashboard integrates both virtual session operations and patient engagement insights into one comprehensive view. It highlights key KPIs such as session success rate, average call duration, clinician utilization, connectivity performance, missed appointments, and dropout trends. Visualizations like trend lines track performance over time, while clinician comparison tables show differences in workload, efficiency, and outcomes across providers.
At the same time, the dashboard also monitors patient-focused metrics, including satisfaction scores, feedback sentiment, repeat session rates, and demographic engagement. Additional insights capture time-to-session booking, patient interaction quality, and preferences across session types such as video, phone, or follow-up care. Charts such as bar graphs, pie charts, and correlation heatmaps provide clarity on engagement levels and highlight areas where patient experience can be improved.
By combining operational efficiency with patient satisfaction analytics, this utilization dashboard equips mental health providers with the insights needed to reduce barriers, optimize clinician productivity, and deliver more effective virtual care.
How to Analyze Data in Tele-Mental Health Utilization Dashboards?
When analyzing tele-mental health dashboards, focus on:
- Session Trends: Compare success rate vs dropout rate across months.
- Clinician Performance: Review session counts, average duration, and utilization to assess productivity.
- Connectivity Analysis: Identify device-specific issues (desktop, mobile, tablet) that impact patient experience.
- Appointment Metrics: Track missed appointments by category—patient no-shows, cancellations, or technical failures.
- Patient Engagement: Measure feedback sentiment, demographic coverage, and repeat booking patterns.
- Interaction Correlation: Use heatmaps to connect satisfaction, engagement, and booking speed with demographic groups.
Benefits of Tele-Mental Health Utilization Dashboard
A Tele-Mental Health Utilization Dashboard template helps healthcare providers and administrators monitor, analyze, and optimize virtual mental health services for better outcomes and efficiency:
- Improves Patient Outcomes: Identifies dropout patterns and no-show trends to improve continuity of care.
- Enhances Clinician Productivity: Tracks utilization rates and call durations to optimize workload.
- Reduces Technical Barriers: Monitors connectivity issues across devices for better IT infrastructure support.
- Boosts Patient Satisfaction: Captures feedback sentiment and satisfaction scores to refine care delivery.
- Data-Driven Decision Making: Provides administrators with real-time metrics for operational improvements.
- Supports Compliance & Reporting: Offers evidence-based insights for regulatory compliance and funding reports.
KPIs to Track in the Tele-Mental Health Utilization Dashboards
Tracking key metrics ensures providers can evaluate service effectiveness, identify gaps, and make informed operational decisions:
- Session Success Rate (%): Measures technical and engagement success of virtual sessions.
- Average Call Duration (min): Evaluates session depth and clinician time allocation.
- Connectivity Issues (%): Identifies network-related disruptions across devices.
- Missed Appointments (%): Monitors patient no-shows, cancellations, and technical failures.
- Session Dropout Rate (%): Tracks patients who leave sessions early.
- Clinician Utilization (%): Measures workload balance across staff.
- Patient Satisfaction Score (out of 5): Evaluates overall care quality.
- Feedback Sentiment (%): Analyzes positive, neutral, and negative patient feedback.
- Repeat Session Rate (%): Indicates patient retention and long-term engagement.
Frequently Asked Questions
Q1: Who can use a tele-mental health utilization dashboard?
Clinics, hospitals, mental health practices, and healthcare administrators can use these dashboards to monitor virtual care performance.
Q2: How do dashboards help clinicians?
They provide insights into session success, utilization rates, and technical issues, helping clinicians balance workloads and improve care delivery.
Q3: What IT features are needed for such dashboards?
Cloud-based integration, real-time data visualization, and secure data handling are key IT features for effective dashboard deployment.
Q4: Can patients benefit directly from these dashboards?
Yes. Indirectly, patients benefit through reduced session dropouts, faster booking times, and improved satisfaction due to data-driven improvements.
Q5: How often should data be monitored?
Ideally, dashboards should be reviewed weekly for clinician performance and monthly for patient engagement trends.