
What is a Digital Nutrition Engagement Dashboard?
A Digital Nutrition Engagement Dashboard template is a centralized platform designed to monitor and optimize patient engagement in nutrition and dietetics clinics. Clinics can use this dashboard wireframe to track patient participation, adherence to nutritional plans, and overall program effectiveness. This healthcare digital nutrition performance dashboard template helps visualize complex data in easy-to-read charts and graphs, enabling decision-makers to identify trends, gaps, and opportunities in patient care. By combining technology with clinical nutrition management provides a data-driven approach to improving patient outcomes and operational efficiency.
Clinics can use IT solutions for nutrition and dietetics engagement to streamline workflows, reduce administrative burden, and enhance patient satisfaction. The dashboard wireframe also facilitates patient engagement tracking in nutrition clinics, allowing healthcare professionals to see which patients are actively following plans and where additional interventions may be necessary. This ensures proactive care and strengthens the effectiveness of nutrition programs.
How to Create a Digital Nutrition Engagement Dashboard
You don’t need to build your report from scratch—just start with a ready-to-use Digital Nutrition Engagement dashboard template from Mokkup. Add in your data and export it however you like. Here’s how to do it:
1. Create or Log in to Your Mokkup Account
Start by signing up on Mokkup.ai using your email. If you already have an account, just log in, and you’ll be good to go.
2. Choose and Customize Your Dashboard Template
Find the Digital Nutrition Engagement Dashboard template in the Templates section. Use the drag-and-drop editor to adjust KPIs, edit filters, or add elements based on your data.
3. Export to Your BI Tool
Once your dashboard wireframe is ready, use the BI Tool Export feature to send it directly to Power BI or Tableau for further analysis and enhancements. You can also download the dashboard as a PDF, PNG, or JPEG, embed it on a platform, or invite your team to collaborate.
Note: This is a Pro template. You’ll need a Pro subscription on Mokkup to use and customize this dashboard wireframe. Upgrade anytime to unlock full access.
Digital Nutrition Engagement Dashboard Example
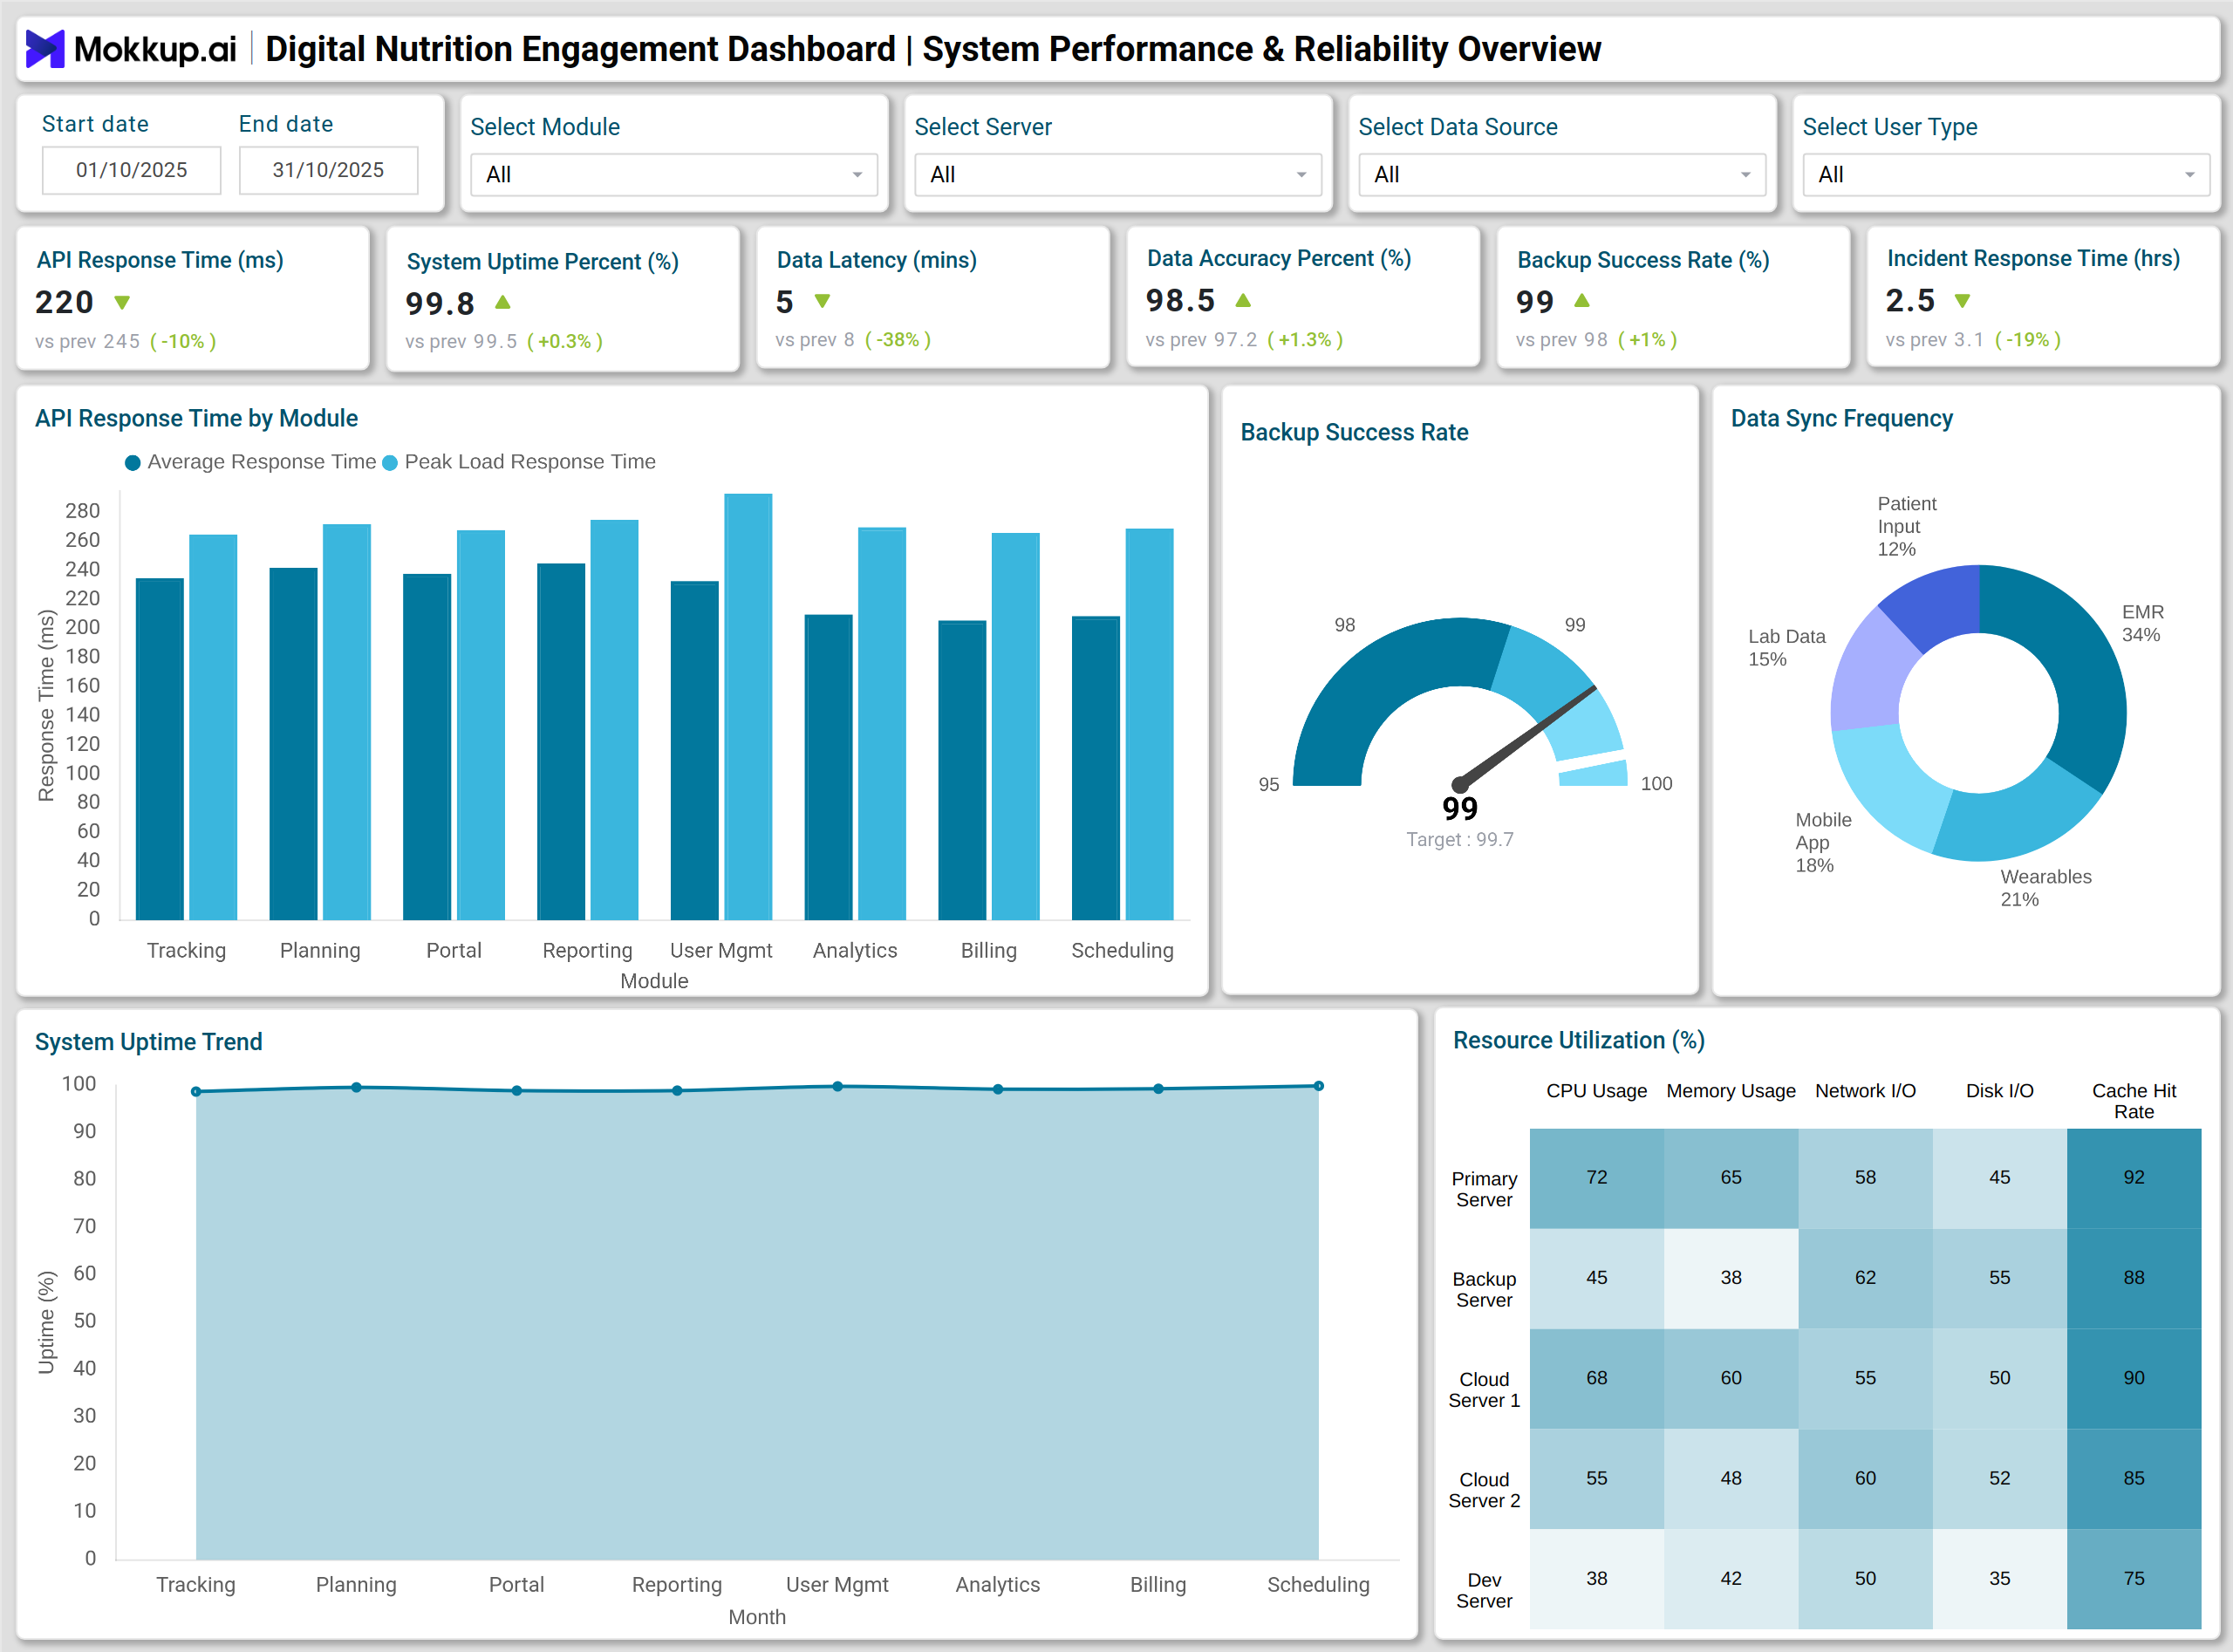
A Digital Nutrition Engagement Dashboard template offers a comprehensive view of system performance, patient activity, and operational metrics. It tracks API response times, system uptime and downtime, and data sync frequency to ensure platform reliability and identify integration gaps. The dashboard wireframe also monitors backup success, server resource utilization, helpdesk ticket resolution, and alert accuracy to optimize operational efficiency.
In addition, it provides insights into patient engagement by analyzing active users, user sessions, and the most accessed modules. This holistic view helps nutrition clinics make data-driven decisions, improve system performance, and enhance patient interaction, supporting strategic planning and quality improvement initiatives.
How to Analyze Data in Digital Nutrition Engagement Dashboards
A Digital Nutrition Engagement Dashboard template helps clinics monitor system performance and patient engagement, enabling data-driven decision-making and operational efficiency:
- Track API Response Time (ms): Monitor response times across modules to ensure smooth system performance and minimize delays.
- Monitor System Uptime Percent: Review uptime and downtime trends to maintain platform reliability.
- Examine Data Latency (minutes): Check how quickly data flows through the system to ensure timely information availability.
- Validate Data Accuracy Percent: Confirm the integrity of patient and operational data to support reliable analytics.
- Evaluate Backup Success Rate Percent: Ensure secure data storage by tracking backup completion rates.
- Assess Incident Response Time (hours): Measure how quickly IT issues are resolved to maintain seamless operations.
- Track Helpdesk Ticket Volume (count): Identify recurring issues and prioritize areas that need attention.
- Validate Alert Accuracy Percent: Minimize false alerts to improve operational focus and reduce unnecessary escalations.
- Measure Report Generation Time (minutes): Ensure timely delivery of analytics and operational reports.
- Monitor Failed Transaction Rate Percent: Track errors to maintain a smooth user experience across the platform.
- Analyze Average User Session Duration (minutes): Understand patient engagement patterns and platform usage trends.
- Review Data Correction Rate Percent: Monitor corrections to maintain ongoing data quality improvements.
Analyzing these metrics allows clinics to make data-driven decisions, optimize patient engagement tracking in nutrition clinics, and improve overall operational efficiency.
Benefits of Digital Nutrition Engagement Dashboards
By centralizing system and engagement data, these dashboards provide clinics with actionable insights for better patient care and IT management:
- Improved Patient Engagement: Real-time insights into patient activity help dietitians tailor interventions.
- Operational Efficiency: Monitor system performance and resource utilization to reduce downtime.
- Data-Driven Decisions: Visualizations of KPIs support informed decision-making in nutrition programs.
- Quality Assurance: Track data accuracy, backup success, and alert performance to maintain high-quality care.
- Resource Optimization: Identify over- or under-utilized modules and servers for better IT resource management.
- Enhanced Reporting: Generate accurate reports faster for internal audits, compliance, and performance reviews.
- Early Issue Detection: Incident resolution tracking ensures quick remediation and minimizes disruptions.
KPIs to Track in Digital Nutrition Engagement Dashboards
Tracking key performance indicators ensures actionable insights for improving patient care and IT system efficiency:
- API Response Time (ms): Measures system speed and responsiveness.
- System Uptime Percent: Tracks platform reliability.
- Data Latency (minutes): Ensures timely data updates.
- Data Accuracy Percent: Confirms integrity of patient and operational data.
- Backup Success Rate Percent: Monitors secure data storage.
- Incident Response Time (hours): Evaluates IT support efficiency.
- Helpdesk Ticket Volume (count): Identifies common issues requiring attention.
Frequently Asked Questions
Q1. What is the main purpose of a Digital Nutrition Engagement Dashboard?
It centralizes patient engagement and operational metrics to improve nutrition program outcomes and optimize IT resources.
Q2. Who can use this dashboard?
Dietitians, nutritionists, healthcare administrators, and IT teams in nutrition and dietetics clinics.
Q3. How does it improve patient engagement?
Tracking active sessions, module usage, and adherence to nutrition plans identifies areas needing intervention.
Q4. Which KPIs are most critical for clinics?
System uptime, API response time, data accuracy, and active user engagement are primary operational and patient performance monitoring metrics.