
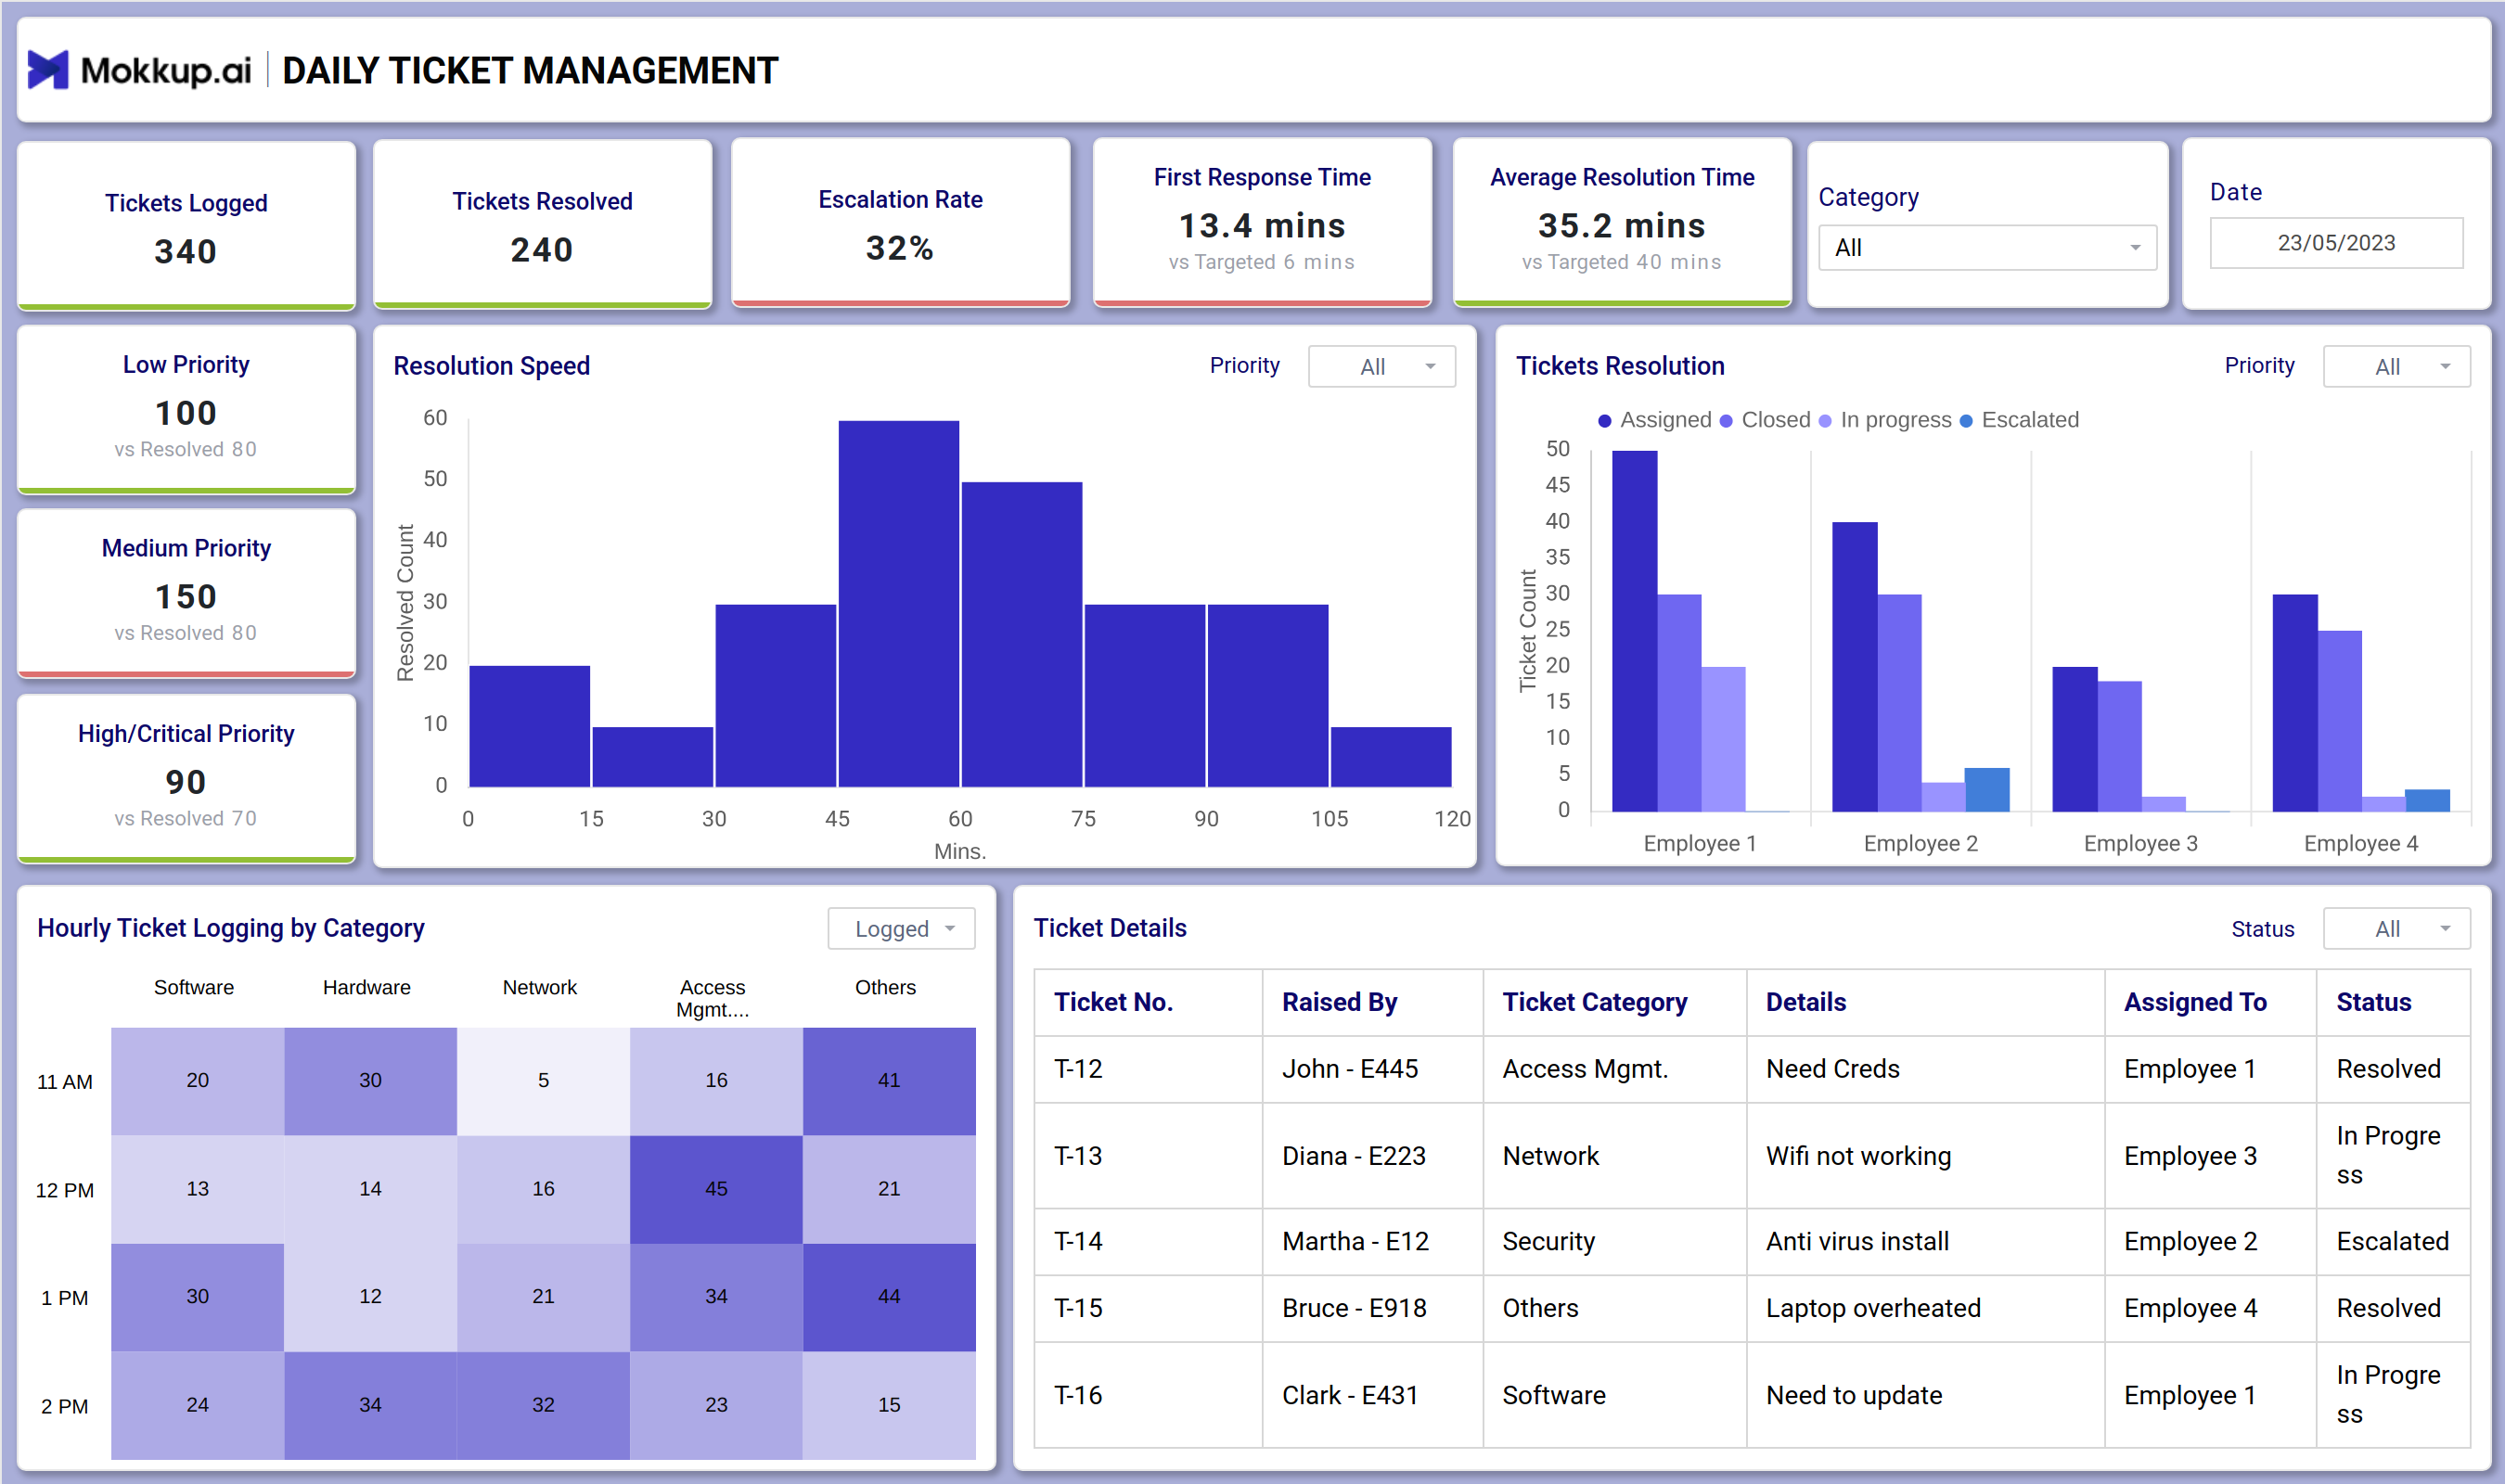
What is a Helpdesk Tracker Dashboard?
The helpdesk dashboard has most IT support ticket tracking metrics for measuring customer satisfaction progress. You will get all the crucial information about ticket resolution, ticket assignment workflow, and ticket prioritization in a single view. Indeed, this support response time analytics dashboard empowers your team to measure their progress in clearing tickets and explore new opportunities to achieve their end goal.
Helpdesk Dashboard Example
The Customer Service Performance Dashboard keeps a centralized view of all real-time metrics related to customer service. With intuitive navigation and dynamic filters, such as date range and category, users can easily drill down into specific insights. The dashboard typically features summary cards highlighting key KPIs like tickets logged, open/resolved tickets, escalation rate, and average response time. Visuals like funnel charts, trend lines, pie charts, and agent leaderboards help teams monitor performance and spot issues at a glance.
How to Analyze Data in Helpdesk Dashboards
With this ticket resolution KPI tracker, users can examine the KPIs that impact the quality of operations and SaaS customer support. Start by reviewing high-level KPIs such as Total Tickets, Open Tickets, Resolved Tickets, First Response Time, Average Resolution Time, escalation rate, and high-priority tickets. These metrics provide a quick snapshot of your support health. Ticket category analysis helps in understanding which issues occur most frequently, and resolution speed examines the time taken by the executive to solve the issue.
How to Create a Helpdesk Dashboard
You don’t need to build your dashboard from scratch. Use Mokkup.ai helpdesk dashboard template to speed up your setup. Add your data and export it in your preferred format. Here's how to get started:
1. Create or Log in to Your Mokkup Account
To access the dashboard templates, sign up on Mokkup.ai using your email. If you already have an account, just log in and use it right away.
2. Choose and Customize Your Dashboard
Head to the Templates section and select the Helpdesk Tracker Dashboard. Use the drag-and-drop editor to modify metrics, apply demographic filters, or add elements to adjust filters for better reporting.
3. Export to Your BI Tool
Once your dashboard is set, use the BI Tool Export feature to move it to Power BI or Tableau for deeper insights. You can also download it as a PDF, PNG, or JPEG, embed it where needed, or share it with your team for enhanced collaboration.
Note: This is a Pro template. A Mokkup Pro subscription is required to use and customize this dashboard. Upgrade anytime to unlock full access.
Benefits of Helpdesk Dashboards
This Helpdesk workflow monitor aims to enhance customer satisfaction by improving the response. When departments know the support performance, they solve problems proactively, leaving no room for service bottlenecks. Here are some more advantages of using this tool:
- This customizable dashboard wireframe reduces the workload for the support teams to manually track each ticket, as it can automate the ticket assignment workflow.
- This can facilitate clear communication between the IT team, HR, operations, and others, resulting in a smoother workflow.
- You can recognize recurring customer service issues and fix them proactively by tracking the key KPIs.
KPIs to Track in Helpdesk Dashboards
In this real-time support metrics dashboard, you can track KPIs like:
- Tickets Logged: The total number of tickets logged and recorded within the ticket management system.
- Tickets Resolved: The total number of tickets successfully resolved by the support team within the specific timeframe.
- Escalation Rate: It shows the percentage of tickets that require extra attention from the higher-level managers.
- First Response Time: This metric measures the amount of time support agents take to send their first reply to a customer support ticket.
- Average Resolution Time: This describes the average time it takes a customer service agent to clear a single ticket.
- Resolution Speed: It measures the average time to resolve a customer or internal support ticket.
Frequently Asked Questions
Q1. How to create an effective helpdesk tracking system?
An effective system uses a centralized dashboard, automates ticket assignments, sets clear priorities, and monitors KPIs to ensure quick resolutions.
Q2. What KPIs should be monitored in customer support dashboards?
Important KPIs include tickets logged, tickets resolved, escalation rate, first response time, average resolution time, and resolution speed.
Q3. Best practices for IT ticket management and tracking?
Best practices include categorizing tickets, automating workflows, tracking high-priority issues, and using analytics to identify recurring problems.
Q4. How to measure customer support team performance?
Team performance can be measured by monitoring resolution times, escalation rates, customer satisfaction scores, and agent leaderboards.
Q5. What metrics are essential for helpdesk analytics?
Essential metrics include total tickets, open vs. resolved tickets, first response time, escalation rate, and average resolution time.