
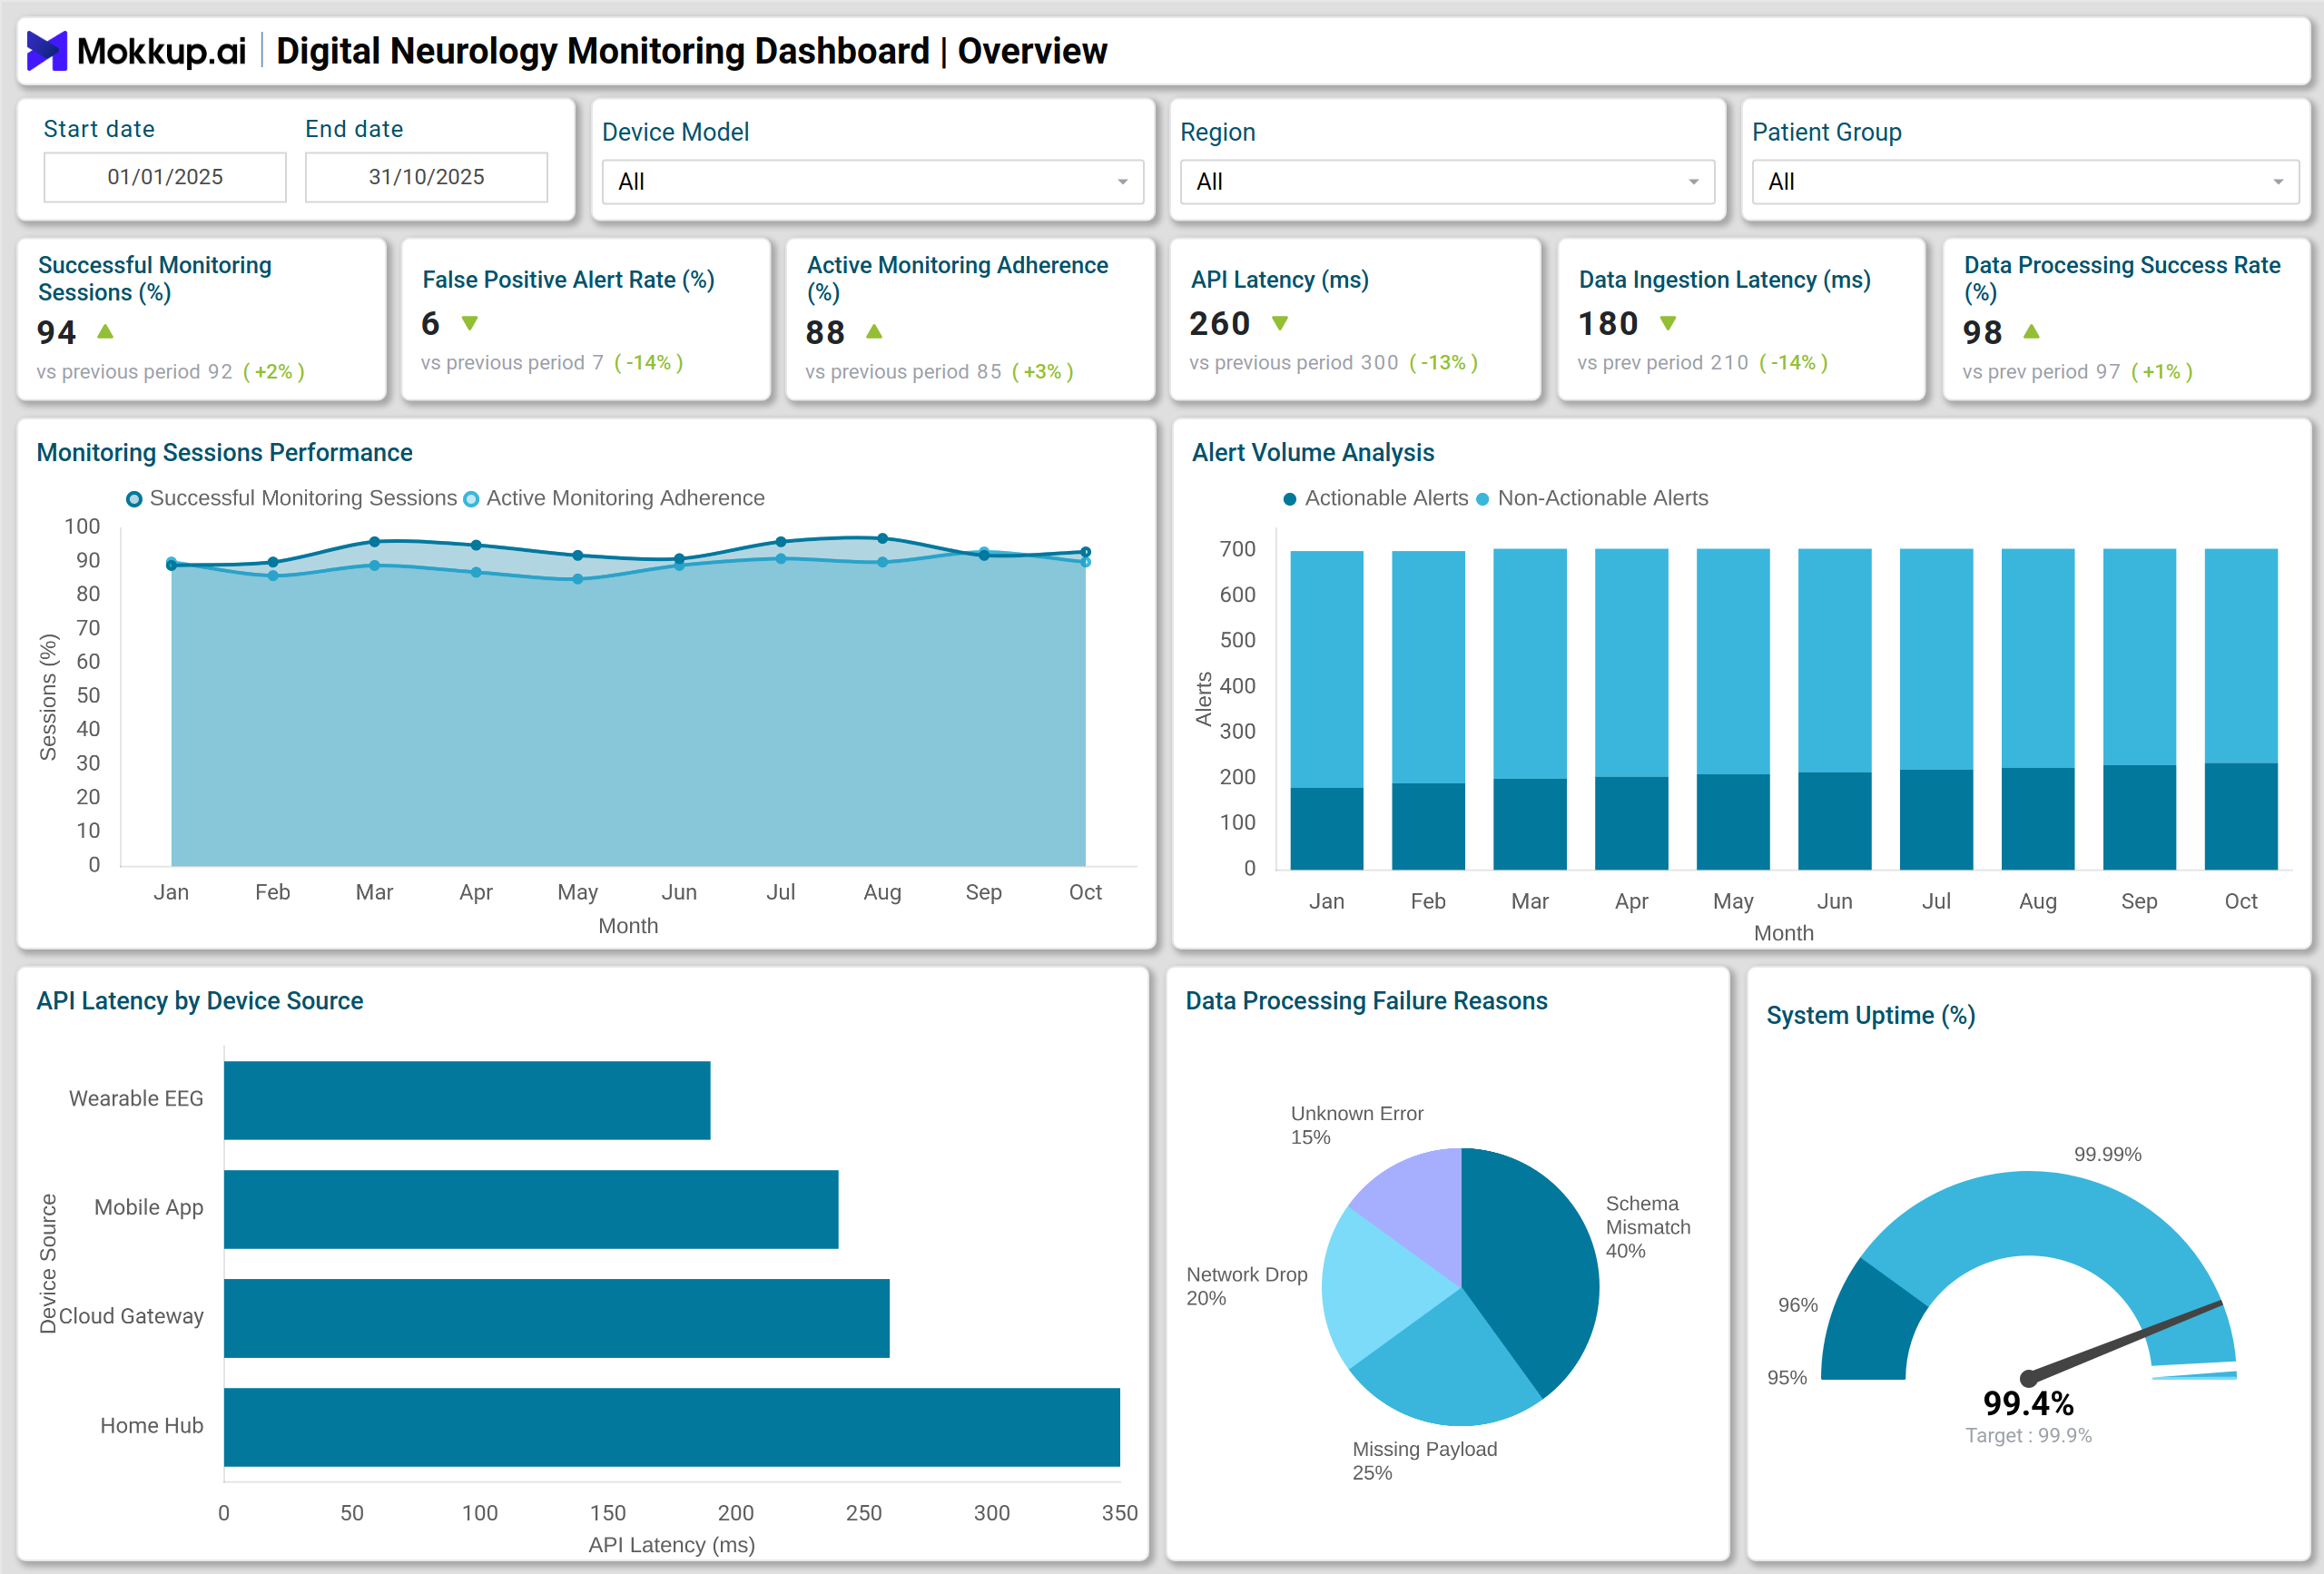
What is a Digital Neurology Monitoring Dashboard?
A Digital Neurology Monitoring Dashboard is a neurological patient monitoring system used in neurology clinics, stroke units, epilepsy programs, and neuro-rehabilitation centers. It consolidates patient vitals, symptom logs, device data, follow-up adherence, alert triggers, escalation events, and outcome trends in a single interface. Neurology clinics use this dashboard to monitor chronic neurological disorders, seizure episodes, stroke recovery progress, Parkinson’s disease symptoms, gait abnormalities, tremors, sleep disturbances, and medication response.
The dashboard integrates data from digital wearables, EMRs, telehealth, and remote monitoring platforms. It functions as a clinical analytics dashboard for neurology centers, supporting care teams with alerts, escalation workflows, device performance, complaint cycles, response times, and intervention outcomes. It also functions as a neurology remote patient monitoring dashboard, enabling neurologists to manage patients outside the clinic, reduce delays in escalation, and standardize communication among clinicians, technicians, and caregivers. The goal is to improve diagnostic accuracy, reduce false-positive notifications, streamline digital workflows, and enhance patient experience. The platform also supports digital tracking and reporting of neurological disorders, allowing clinicians to review seizure patterns, stroke rehabilitation progress, Parkinson’s symptoms, and medication responses using standardized clinical data.
How to Create a Digital Neurology Monitoring Dashboard
You don’t need to build your report from scratch—just start with a ready-to-use dashboard template from Mokkup. Add in your data and export it however you like. Here’s how to do it:
1. Create or Log in to Your Mokkup Account
Start by signing up on Mokkup.ai using your email. If you already have an account, just log in, and you’ll be good to go.
2. Choose and Customize Your Dashboard Template
Find the Digital Neurology Monitoring Dashboard Template in the Templates section. Use the drag-and-drop editor to adjust KPIs, edit filters, or add elements based on your data.
3. Export to Your BI Tool
Once your dashboard wireframe is ready, use the BI Tool Export feature to send it directly to Power BI or Tableau for further analysis and enhancements. You can also download the dashboard as a PDF, PNG, or JPEG, embed it on a platform, or invite your team to collaborate.
Note: This is a Pro template. You’ll need a Pro subscription on Mokkup to use and customize this dashboard wireframe. Upgrade anytime to unlock full access.
Digital Neurology Monitoring Dashboard Example
A large neurology clinic deploys a neurological patient monitoring system to track epilepsy, stroke recovery, migraine cases, and movement disorders. Patients use wearable EEG, accelerometers, seizure detectors, or symptom-logging apps. When abnormal patterns are detected, the system generates alerts and assigns action status to clinicians.
The dashboard visualizes patient volumes, device feeds, seizure episodes, escalation timelines, and treatment adjustments. A seizure and epilepsy monitoring digital dashboard highlights high-risk patients, intervention time, and follow-up outcomes. Stroke patients are analyzed for rehab adherence, mobility progress, speech improvements, gait assessments, and digital engagement.
A decisive advantage is automation. The system filters noise, reduces false-positive alerts, enhances first-contact resolution, and provides a structured pathway for complaint-to-resolution. Patients also complete digital literacy or training modules, enabling them to use home monitoring devices smoothly. Over time, the clinic observes reduced emergency escalations, faster responses, and higher NPS scores.
How to Analyze Data in Digital Neurology Monitoring Dashboards
Here is how you can analyze data through this dashboard:
- Review the trend of Successful Monitoring Sessions Percent to understand monitoring reliability and patient engagement.
- Compare Alert Volume vs Actionable Alerts to measure clinical value and identify noise or false triggers.
- Track monitoring adherence percentage vs. active patients to assess digital participation, especially for remote care.
- Evaluate False-Positive Alert patterns to optimize device calibration and improve clinical workload planning.
- Analyze the distribution of clinical escalations by condition to detect trends in severity across epilepsy, stroke, movement disorders, or cognitive cases.
- Monitor Digital Literacy or Training Completion to identify patients requiring onboarding support.
- Use Average Clinician Response Time to measure communication efficiency between doctors, nurses, and technicians.
- Evaluate the First Contact Resolution Rate to understand the effectiveness of support in a single interaction.
- Audit complaint resolution time across process stages to improve operational bottlenecks.
- Track Patient NPS Trend to measure satisfaction and identify patterns across service lines or device experiences.
Benefits of Digital Neurology Monitoring Dashboards
The following are benefits of using this dashboard:
- Improves neurological patient monitoring and reduces missed alerts in remote care.
- Enhances diagnostic accuracy using device feeds and symptom logs.
- Reduces false-positive alerts and prevents clinician fatigue.
- Strengthens escalation workflows and decreases complication risks.
- Supports seizure, epilepsy, stroke, and Parkinson’s disease follow-up tracking
- Increases monitoring adherence and digital participation
- Enables centralized decision support for neurologists and caregivers.
- Reduces operational delays using automated alert routing and response tracking
- Improves patient satisfaction and digital experience
- Enhances reporting for audits, quality teams, and clinical governance
KPIs to Track in Digital Neurology Monitoring Dashboards
- Successful Monitoring Sessions Percent – Measures the share of completed and uninterrupted monitoring sessions against total scheduled sessions.
- False-Positive Alert Rate – Tracks how many system alerts were non-actionable or clinically irrelevant.
- Alert Volume and Actionable Alert Ratio – Compares the total number of alerts generated with the number of alerts that required clinical action.
- Active Monitoring Adherence Percentage – Indicates the proportion of patients who consistently use devices or apps as prescribed.
- Clinical Escalation Rate – Measures how often monitoring data leads to clinical review or intervention.
- Net Promoter Score (NPS) – Captures overall patient satisfaction with digital monitoring and clinical support.
- Digital Literacy or Training Completion Rate – Indicates the percentage of patients who completed device or platform onboarding training.
Frequently Asked Questions
1. Who uses a Digital Neurology Monitoring Dashboard?
Neurology clinics, epilepsy centers, stroke rehabilitation units, movement disorder programs, and remote monitoring teams.
2. Can this dashboard support remote patients?
Yes. It functions as a neurology remote patient monitoring dashboard, allowing neurologists to monitor patients at home using wearable devices and digital apps.
3. Which neurological conditions can be tracked?
Epilepsy, stroke recovery, Parkinson’s disease, migraine, neuropathies, tremors, balance disorders, and cognitive conditions.