
What is a Neurodegenerative Disease Analytics Dashboard?
A Neurodegenerative Disease Analytics Dashboard is a specialized data visualization and monitoring tool used by neurology centers, memory clinics, and healthcare providers to track, analyze, and improve outcomes for patients suffering from conditions such as Alzheimer’s disease, Parkinson’s disease, and other cognitive impairments. By collecting real-time data from clinical records, diagnostic tests, and patient-reported outcomes, these dashboards provide an integrated view of brain health, disease progression, and treatment adherence.
How to Create a Neurodegenerative Disease Analytics Dashboard
You don’t need to build your report from scratch—just start with a ready-to-use dashboard template from Mokkup. Add in your data and export it however you like. Here’s how to do it:
1. Create or Log in to Your Mokkup Account
Start by signing up on Mokkup.ai using your email. If you already have an account, just log in, and you’ll be good to go.
2. Choose and Customize Your Dashboard Template
Find the Neurodegenerative Disease Analytics Dashboard template in the Templates section. Use the drag-and-drop editor to adjust KPIs, edit filters, or add elements based on your data.
3. Export to Your BI Tool
Once your dashboard wireframe is ready, use the BI Tool Export feature to send it directly to Power BI or Tableau for further analysis and enhancements. You can also download the dashboard as a PDF, PNG, or JPEG, embed it on a platform, or invite your team to collaborate.
Note: This is a Pro template. You’ll need a Pro subscription on Mokkup to use and customize this dashboard wireframe. Upgrade anytime to unlock full access.
Neurodegenerative Disease Analytics Dashboard Example
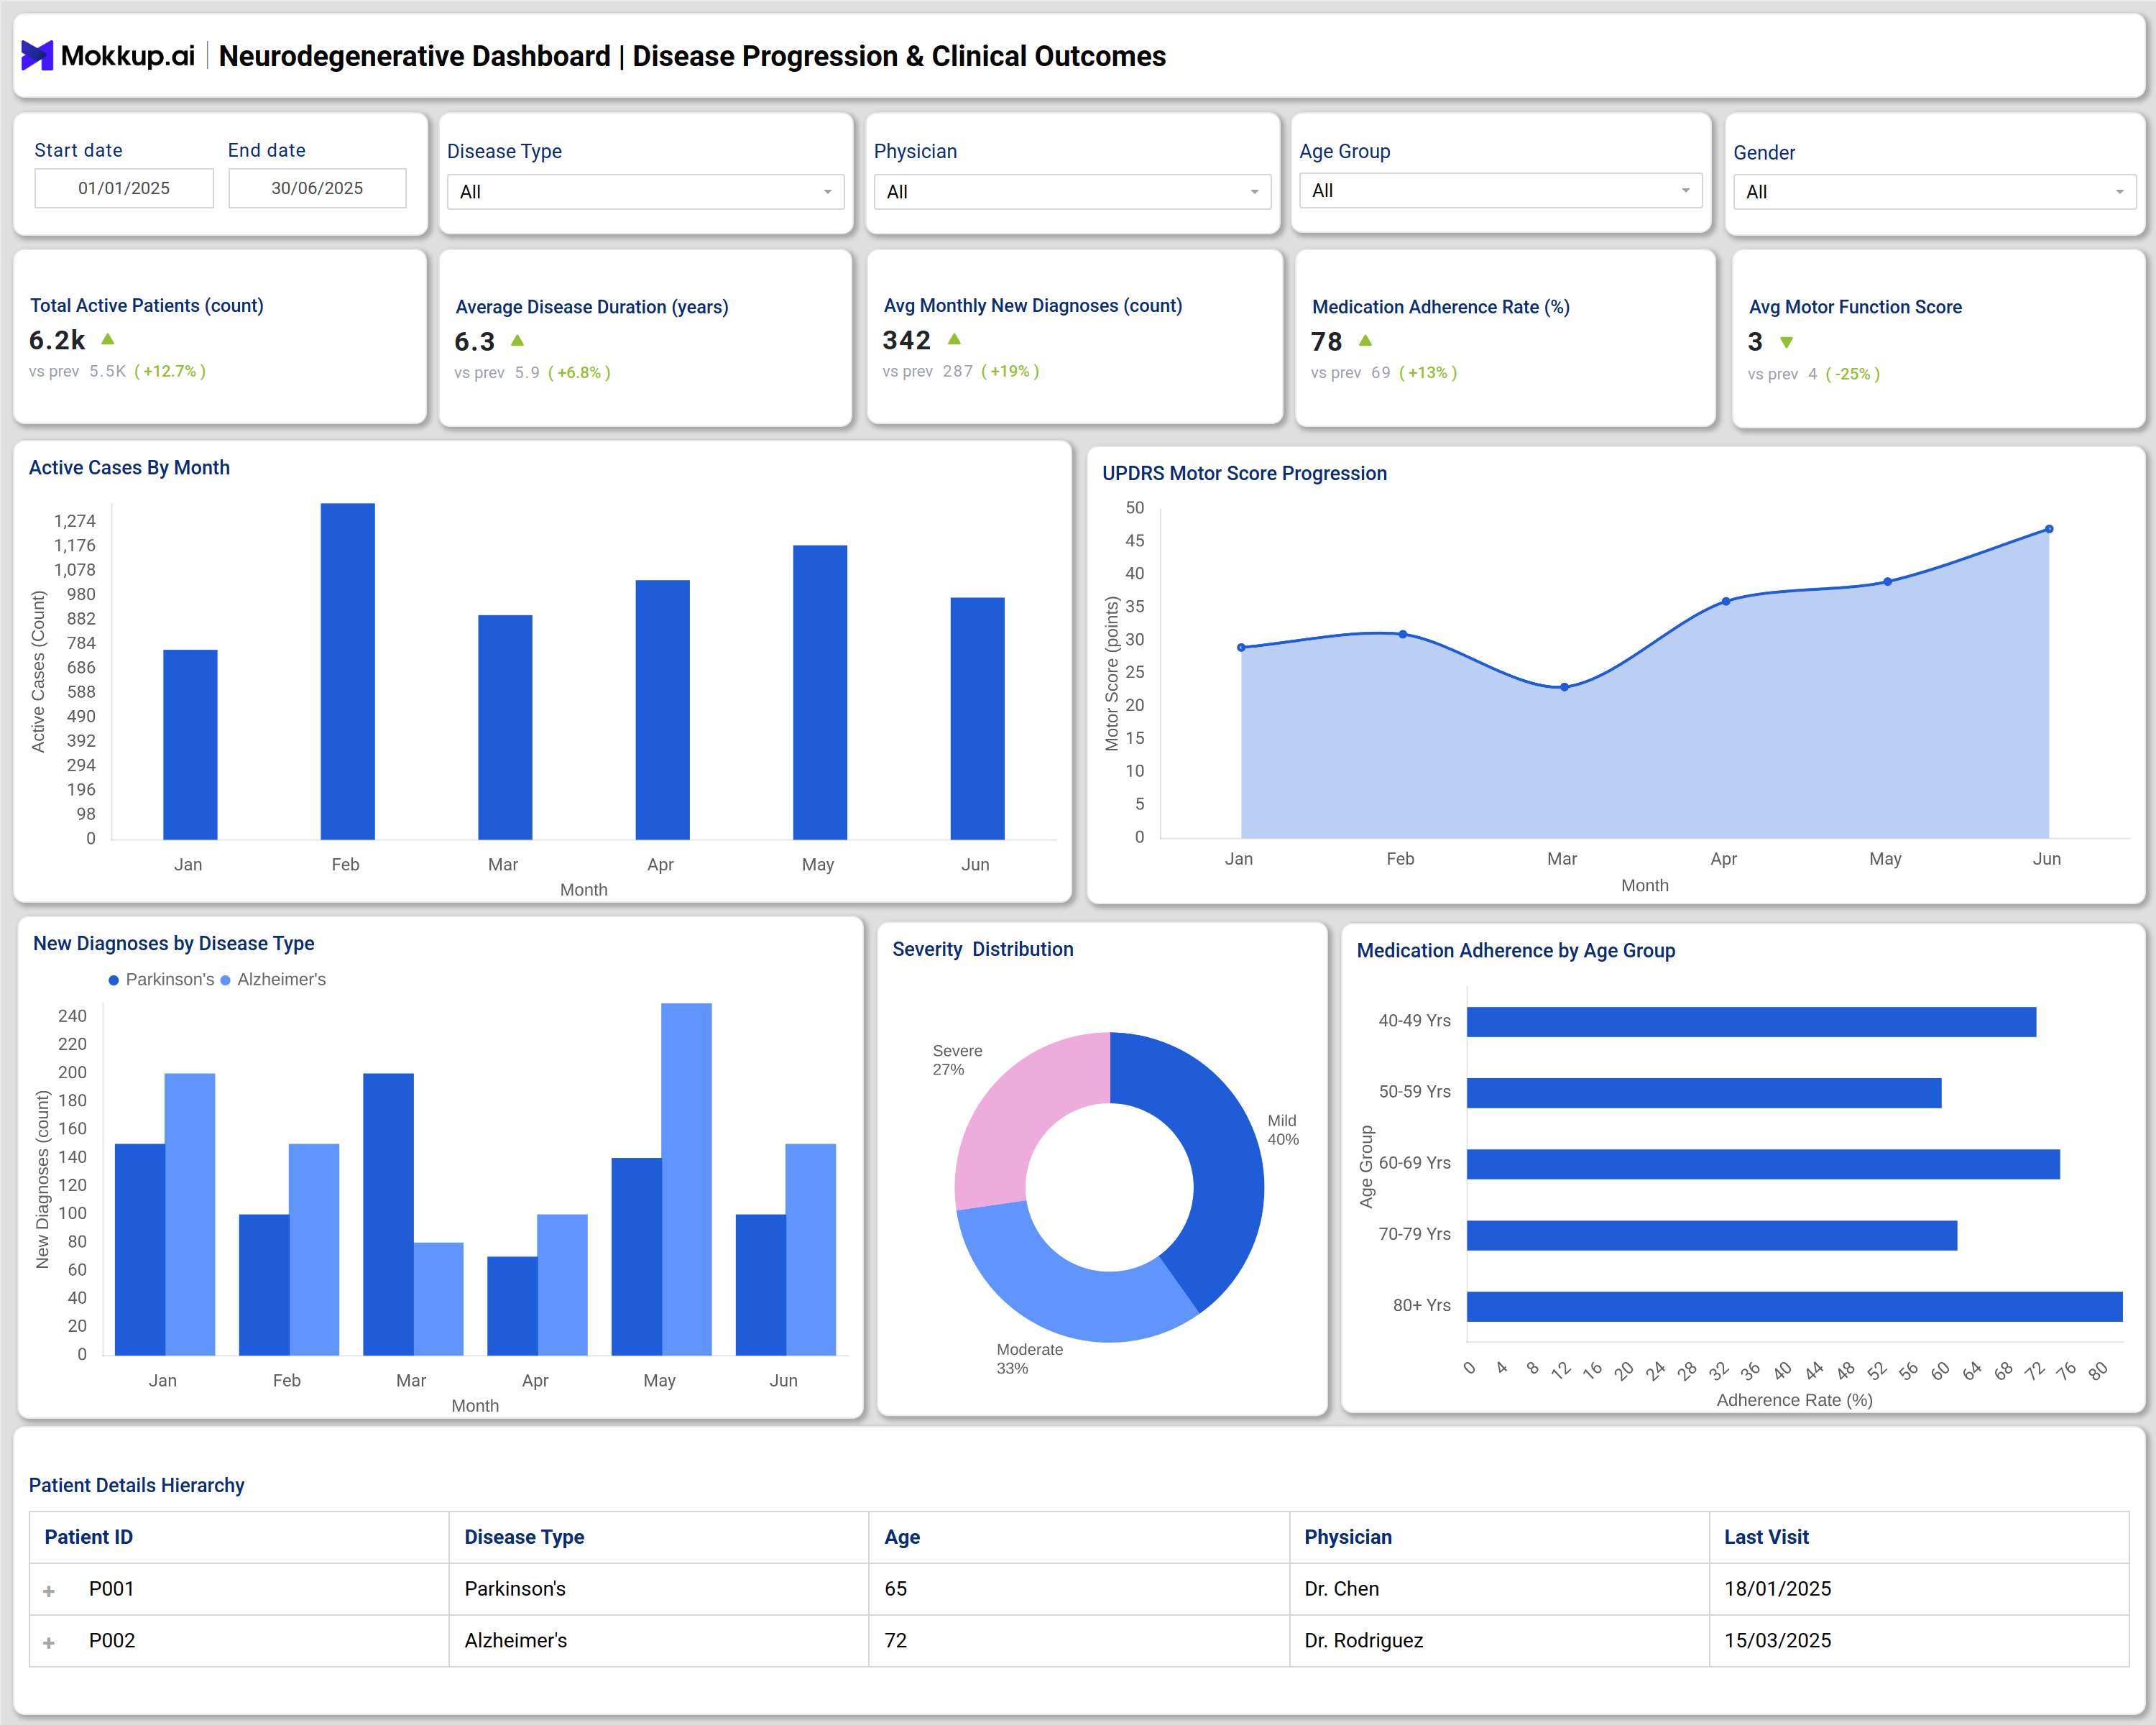
The dashboard typically provides an at-a-glance summary of core metrics, including total active patients, average disease duration, new diagnoses per month, medication adherence rates, and average scores for motor function or cognitive status. Visualizations may include graphs of monthly active cases, severity distributions (mild, moderate, severe), and trends in clinical scores such as the UPDRS Motor Score for Parkinson’s. Further, user-friendly filters allow clinicians to segment data by disease type, age group, gender, or treating physician. The interface streamlines the complex process of tracking hospital performance, making it easier for neurology teams to identify at-risk groups, evaluate therapy outcomes, and allocate resources effectively.
How to Analyze Data in Neurodegenerative Disease Dashboards
- Apply filters for age, gender, disease type, physician, or diagnosis year to create focused cohorts.
- Examine monthly and year-over-year trends in new and active cases to understand changes in prevalence and incidence.
- Assess medication adherence rates, stratified by age group, to monitor patient engagement and highlight populations where intervention may be needed.
- Review clinical severity distribution graphs to prioritize care for moderate and severe cases.
- Use progression charts for key metrics (e.g., UPDRS, cognitive decline scores) to identify disease acceleration or treatment response.
- Compare costs, therapy types, and service utilization for evidence-based resource planning.
- Validate improvements or deviations across different KPIs over time to support continuous care quality improvement.
Benefits of Neurodegenerative Disease Analytics Dashboards
- Centralizes dementia monitoring, Alzheimer’s data, and Parkinson’s statistics for fast, holistic patient management.
- Enables clinicians to track clinical and cognitive deterioration trends, supporting individualized care planning.
- Supports early detection and intervention through continuous tracking of disease progression analytics.
- Increases care team efficiency by simplifying access to relevant clinical and therapy data.
- Facilitates research and outcome measurement through standardized, exportable metrics.
- Enhances reporting and compliance by automating KPI visualization and documentation for regulatory requirements.
KPIs to Track in Neurodegenerative Disease Dashboards
- Total Active Patients: Current number of patients being monitored for neurodegenerative diseases.
- Average Disease Duration: Overall mean length of time since each patient's diagnosis.
- Avg Monthly New Diagnoses: Number of new patients diagnosed each month with Alzheimer’s, Parkinson’s, or dementia.
- Medication Adherence Rate: Percentage of patients consistently following prescribed medication protocols.
- Avg Motor Function Score: Mean clinical rating (such as UPDRS) for patients’ physical abilities.
- Severity Distribution: Ratio of patients at mild, moderate, or severe disease stages.
Frequently Asked Questions
1. Who uses neurodegenerative disease analytics dashboards?
These dashboards are used by neurology specialists, care coordinators, memory clinics, hospital administrators, and researchers tracking cognitive and motor impairment outcomes.
2. What types of diseases can be tracked?
Dashboards are designed for conditions such as Alzheimer’s disease, Parkinson’s disease, dementia, ALS, and other cognitive disorders.
3. How do dashboards improve patient outcomes?
They enable early risk detection, prompt intervention, adherence tracking, and outcome monitoring, leading to personalized and evidence-based care decisions.