
What is a Digital Dialysis Monitoring Dashboard?
A Digital Dialysis Monitoring Dashboard is a centralized IT solution for dialysis centers to track, analyze, and optimize both clinical and operational performance. It integrates multiple data sources, including dialysis machines, remote patient monitoring (RPM) systems, and IT platforms, into a single interface. This allows administrators and IT managers to monitor device uptime, telemetry completeness, API performance, and patient session compliance. By using a dialysis patient monitoring dashboard template, dialysis centers can reduce treatment interruptions, improve workflow efficiency, and ensure high-quality patient care. Additionally, the dashboard wireframe provides actionable insights into operational costs, vendor performance, and system reliability, supporting strategic decision-making for healthcare providers.
This dashboard serves as a comprehensive IT monitoring solution for dialysis centers, allowing administrators to proactively detect integration errors, SLA breaches, and false alarms. It also helps ensure compliance with regulatory standards, making it an essential tool for modern dialysis centers that seek to enhance both patient care and operational efficiency through technology.
How to Create a Digital Dialysis Monitoring Dashboard
You don’t need to build your report from scratch—just start with a ready-to-use Digital Dialysis Monitoring dashboard template from Mokkup. Add in your data and export it however you like. Here’s how to do it:
1. Create or Log in to Your Mokkup Account
Start by signing up on Mokkup.ai using your email. If you already have an account, just log in, and you’ll be good to go.
2. Choose and Customize Your Dashboard Template
Find the Digital Dialysis Monitoring Dashboard template in the Templates section. Use the drag-and-drop editor to adjust KPIs, edit filters, or add elements based on your data.
3. Export to Your BI Tool
Once your dashboard wireframe is ready, use the BI Tool Export feature to send it directly to Power BI or Tableau for further analysis and enhancements. You can also download the dashboard as a PDF, PNG, or JPEG, embed it on a platform, or invite your team to collaborate.
Note: This is a Pro template. You’ll need a Pro subscription on Mokkup to use and customize this dashboard wireframe. Upgrade anytime to unlock full access.
Digital Dialysis Monitoring Dashboard Example
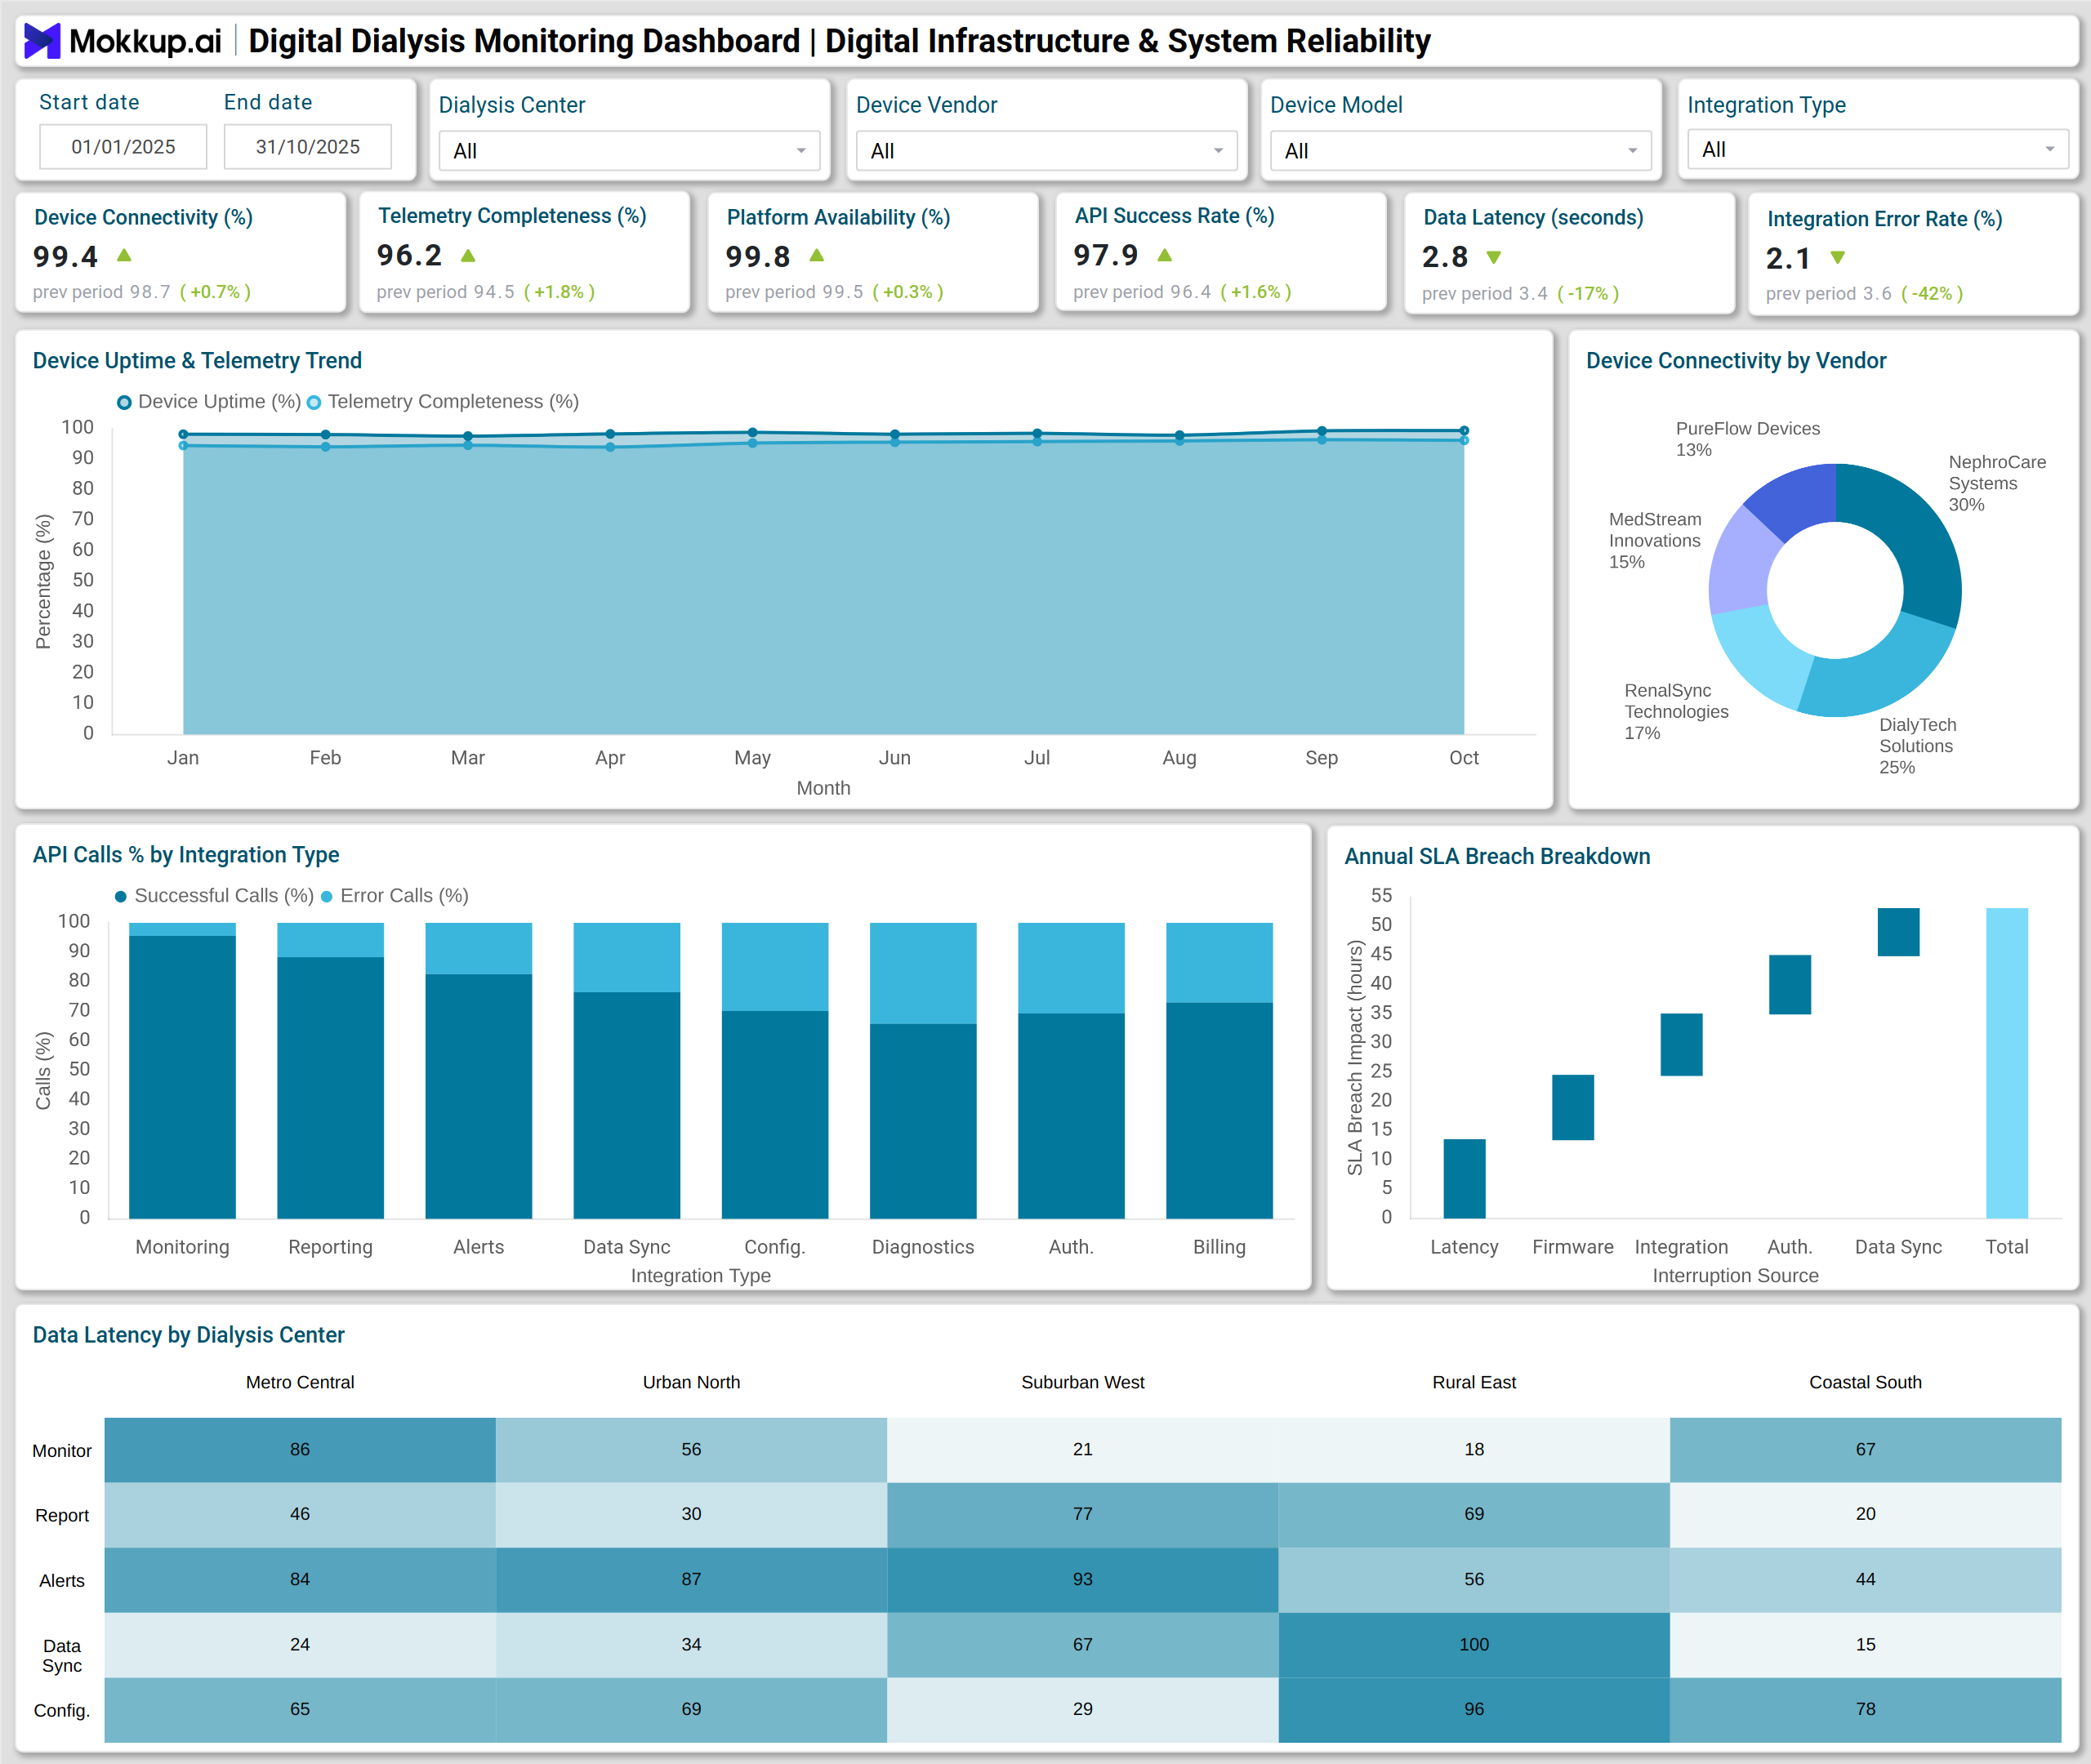
In practice, a Digital Dialysis Monitoring Dashboard visualizes multiple key performance metrics using intuitive charts and analytics. For instance, a line chart showing device uptime and telemetry trends enables managers to track system stability month-over-month. Stacked column charts for API calls by integration type highlight success and error rates, while heatmaps for data latency pinpoint centers experiencing slower telemetry updates.
Operational efficiency can also be assessed with waterfall charts for SLA breach breakdowns, donut charts comparing device connectivity by vendor, and column charts monitoring RPM utilization across centers and shifts. Cost tracking is simplified using monthly cost-per-monitored-patient column charts, and workflow efficiency is monitored through funnel charts of digital alert handling, including validation, escalation, and resolution. Lastly, alarm distribution stacked bar charts and audit-log compliance treemaps allow managers to monitor false alarm rates and audit completeness, providing a comprehensive view of center performance. This setup acts as a dialysis treatment performance tracking system and a dialysis machine uptime monitoring tool, combining operational and clinical outcomes in one centralized platform.
How to Analyze Data in Digital Dialysis Monitoring Dashboards
Digital dialysis monitoring dashboards help administrators oversee IT performance, device reliability, and patient data flow to ensure uninterrupted care delivery:
- Track Device Connectivity and Uptime Trends: Identify potential equipment failures before they impact patient treatment.
- Monitor Session Telemetry Completeness: Measure the percentage of sessions with complete telemetry data to ensure accuracy and reliability.
- Use Data Latency Heatmaps: Detect centers with slow system responses to enhance performance.
- Analyze API Success and Integration Error Rates: Ensure seamless data exchange between devices and IT systems.
- Assess RPM Utilization: Review usage trends across shifts and centers to gauge operational adoption.
- Review Escalation and False Alarm Rates: Optimize alert management and reduce unnecessary escalations.
- Track Cost per Monitored Patient: Identify opportunities to improve financial efficiency.
- Examine SLA Breaches and Audit-Log Coverage: Maintain regulatory compliance and IT accountability.
Benefits of Digital Dialysis Monitoring Dashboards
A digital dialysis monitoring dashboard consolidates operational, technical, and compliance insights, helping dialysis centers enhance efficiency and reliability:
- Improved Operational Efficiency: Real-time insights into device uptime, API performance, and RPM usage.
- Enhanced Patient Care: Ensure continuous monitoring and reduce treatment interruptions.
- Compliance Assurance: Monitor audit-log coverage and SLA adherence for regulatory standards.
- Cost Management: Track monthly costs per monitored patient and optimize resource allocation.
- Proactive Maintenance: Identify potential device failures or integration issues before they escalate.
- Vendor Performance Insights: Compare connectivity and uptime across multiple dialysis machine vendors.
- Data-Driven Decision Making: Transform operational and clinical data into actionable insights.
KPIs to Track in Digital Dialysis Monitoring Dashboards
These KPIs help dialysis center administrators evaluate IT system reliability, compliance, and operational performance:
- Device Connectivity / Uptime (%): Measures how consistently dialysis machines stay online.
- Percent Sessions with Complete Telemetry (%): Tracks data accuracy across patient monitoring sessions.
- Data Latency (seconds): Indicates system responsiveness and data transmission speed.
- Platform Availability / SLA Compliance (%): Ensures adherence to uptime and service-level standards.
- API Success Rate (%): Monitors the reliability of system integrations and data exchange.
- Integration Error Rate (%): Highlights technical issues affecting data synchronization.
- RPM Utilization Rate (%): Evaluates the adoption and effectiveness of remote patient monitoring tools.
Frequently Asked Questions
Q1. What is the primary purpose of a Digital Dialysis Monitoring Dashboard?
It centralizes dialysis and IT performance data to ensure operational efficiency, system reliability, and high-quality patient care.
Q2. Can this dashboard help reduce treatment interruptions?
Yes. By tracking device uptime, telemetry, and alarm workflows, centers can proactively resolve issues before they affect patients.
Q3. How does it support compliance?
The dashboard monitors SLA adherence and audit-log coverage, helping dialysis centers meet regulatory and operational standards.
Q4. Is it suitable for multiple dialysis centers?
Absolutely. Data can be analyzed by center, shift, and vendor, making it ideal for multi-center dialysis networks.
Q5. Can it help manage operational costs?
Yes. The dashboard tracks cost per monitored patient and highlights areas for cost reduction without compromising patient care.