
What is a Dialysis Center Clinical Performance Dashboard?
A Dialysis Center Clinical Performance Dashboard is a specialized digital tool designed to help kidney care facilities monitor, analyze, and optimize their treatment operations. It provides visibility into core metrics such as dialysis treatment completion, machine downtime, patient outcomes, and complication rates. This dashboard is essential for tracking Kidney Dialysis Performance, ensuring high-quality patient care, and supporting chronic kidney disease monitoring within medical institutions.
How to Create a Dialysis Center Clinical Performance Dashboard
You don’t need to build your report from scratch—start with a ready-to-use dashboard template from Mokkup. Add in your data and export it however you like. Here’s how to do it:
1. Create or Log in to Your Mokkup Account
Start by signing up on Mokkup.ai using your email. If you already have an account, log in, and you’ll be ready.
2. Choose and Customize Your Dashboard Template
The Dialysis Center Clinical Performance Dashboard template is in the Templates section. Use the drag-and-drop editor to adjust KPIs, edit filters, or add elements based on your data.
3. Export to Your BI Tool
Once your dashboard wireframe is ready, use the BI Tool Export feature to send it directly to Power BI or Tableau for further analysis and enhancements. You can also download the dashboard as a PDF, PNG, or JPEG, embed it on a platform, or invite your team to collaborate.
Note: This is a Pro template. You’ll need a Pro subscription on Mokkup to use and customize this dashboard wireframe. Upgrade anytime to unlock full access.
Dialysis Center Clinical Performance Dashboard Example
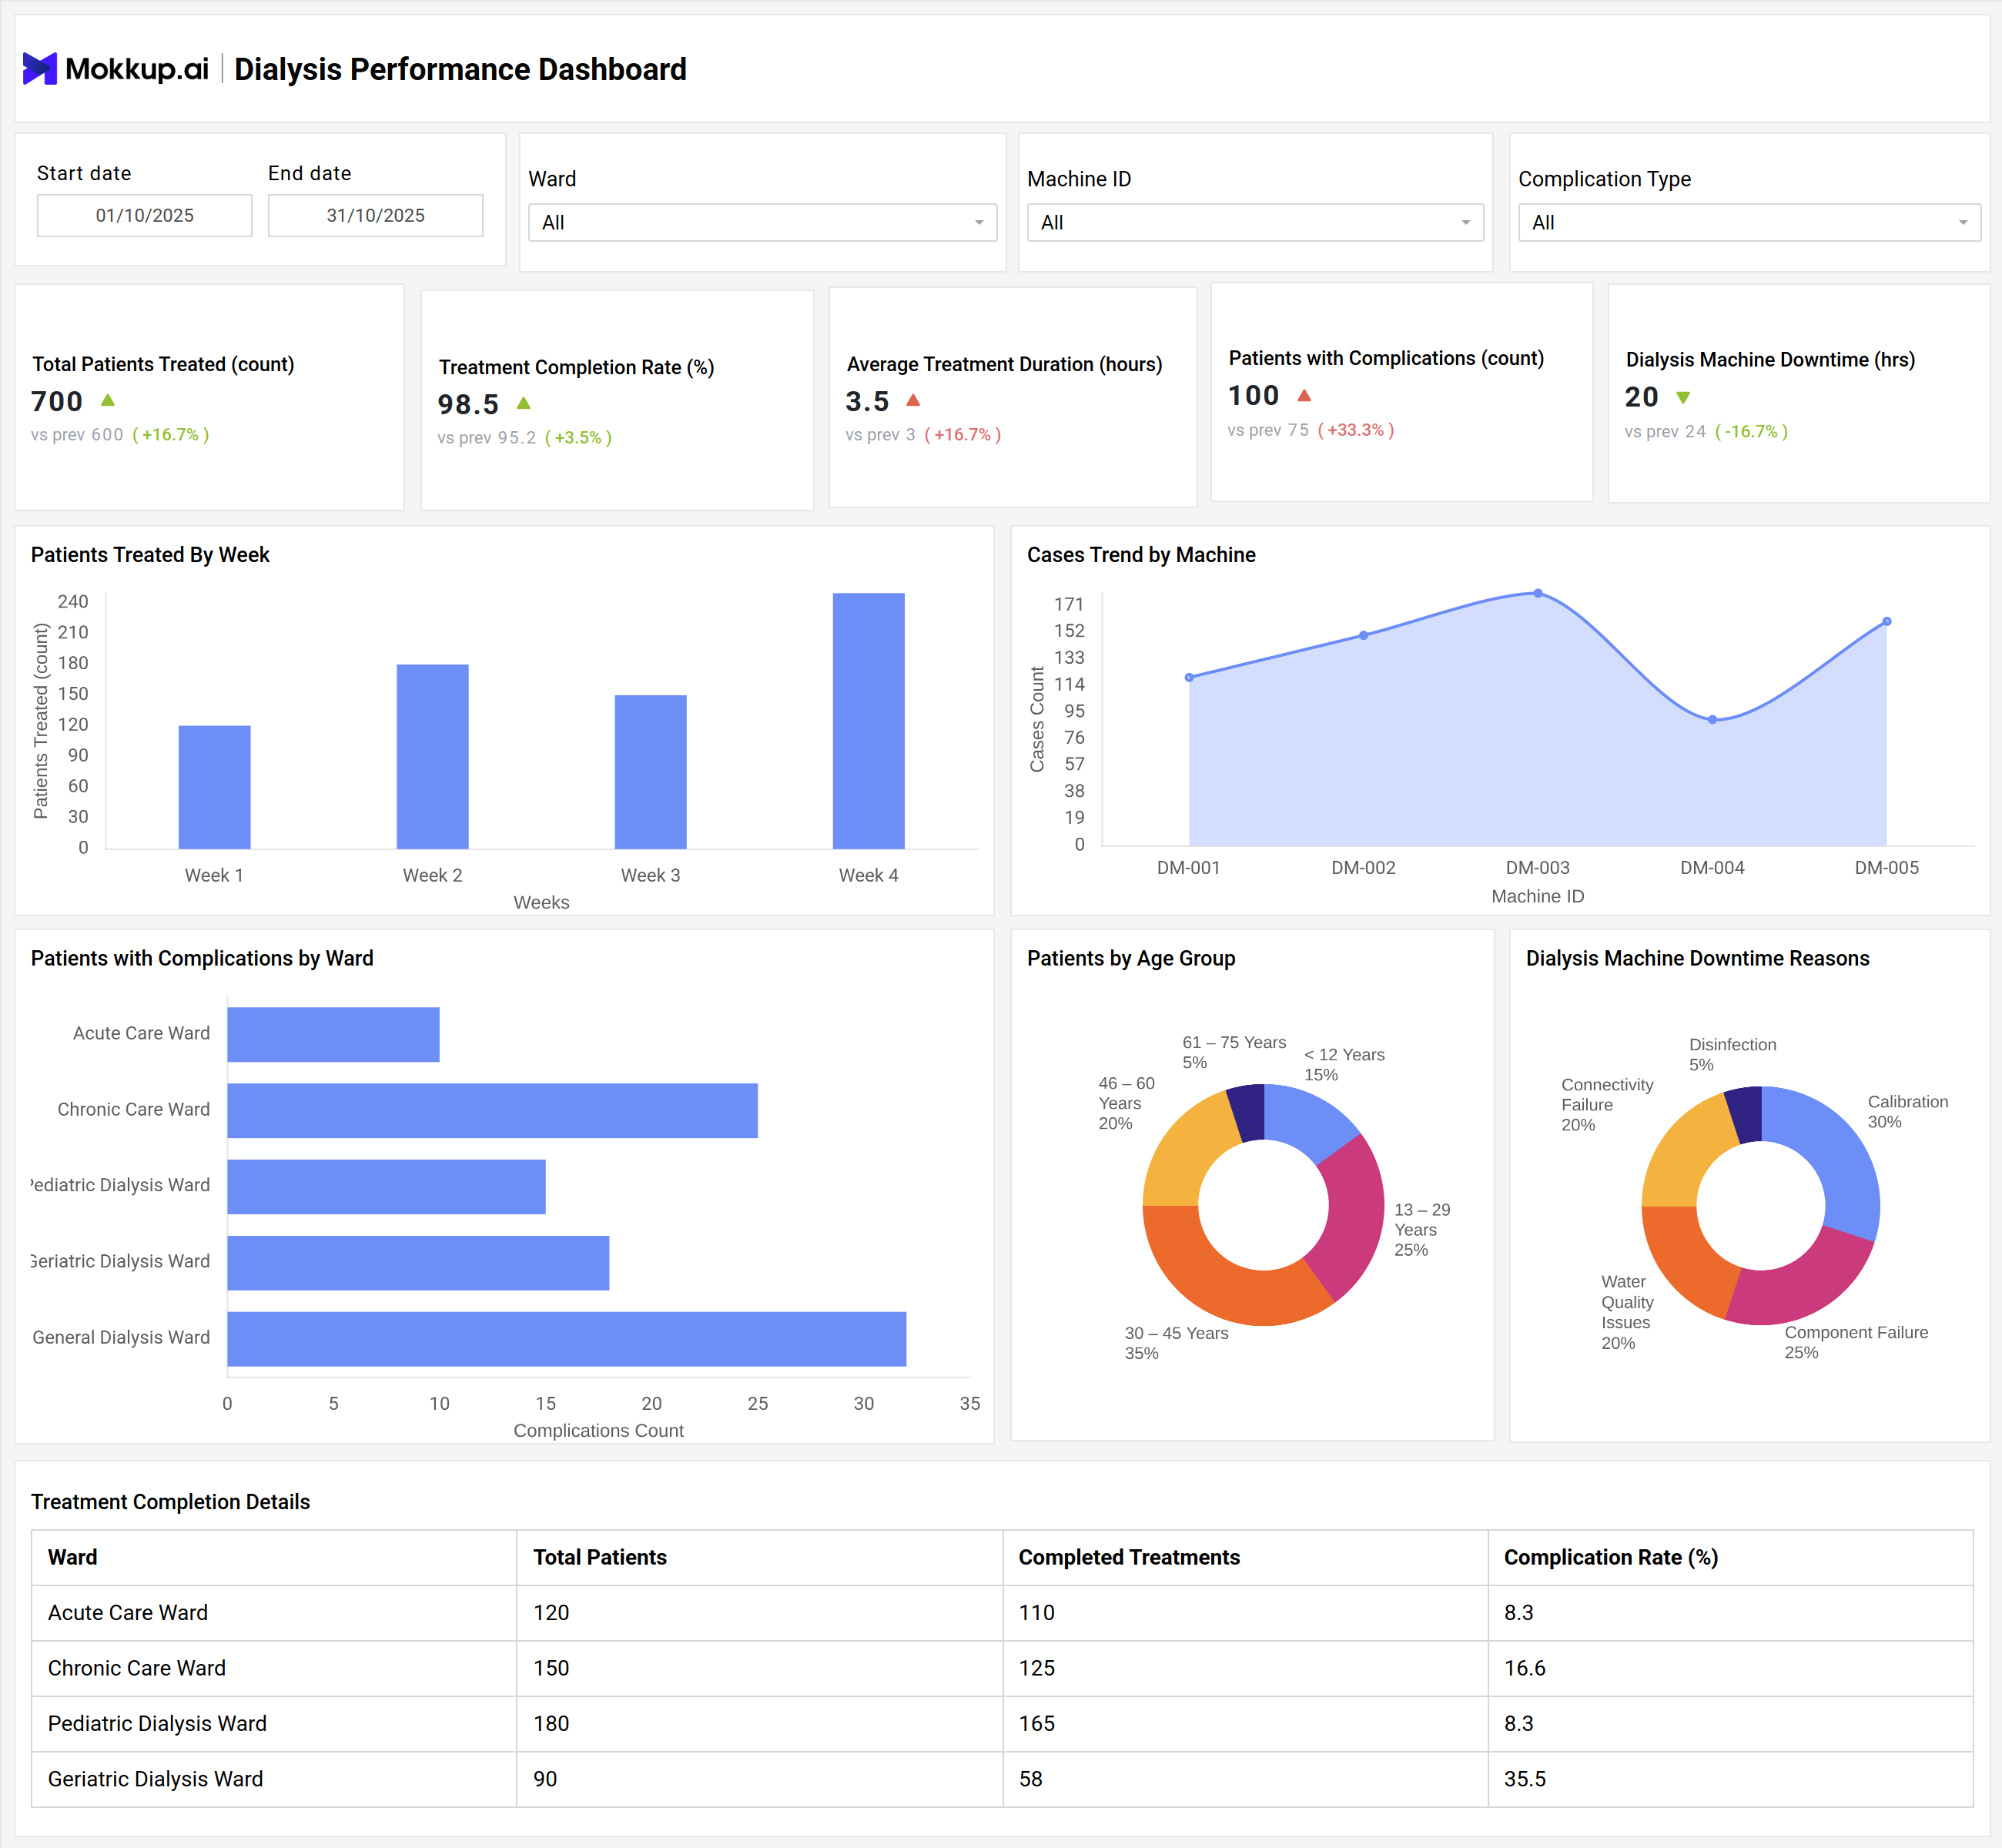
In a typical implementation, the Dialysis Center Clinical Performance Dashboard displays metrics such as the total number of patients treated, treatment completion rate, average treatment duration, and patient complication counts. For instance, a dashboard might show that 700 patients were treated in a month, with a 98.5% treatment completion rate. Additional panels provide detailed breakdowns by ward, track dialysis machine downtime, visualize patient demographics by age group, and list reasons for machine downtime. All these features support data-driven decisions, continuous monitoring of Dialysis Quality Metrics, and improved Dialysis Patient Outcomes.
How to Analyze Data in Dialysis Center Dashboards
Here is how you can analyze data in the Dialysis Center Dashboard:
- Review weekly patient treatment trends to identify throughput and scheduling gaps.
- Monitor complication rates by ward to target quality improvement efforts.
- Track machine-specific case trends for preventive maintenance planning.
- Analyze dialysis machine downtime by reason to optimize resource allocation.
- Segment patients by age group to identify disparities in outcomes.
- Benchmark key indicators, such as treatment completion and complication rates, against historical data to drive continuous improvement.
Benefits of Dialysis Center Clinical Performance Dashboards
These are the benefits of using the Dialysis Center Clinical Performance Dashboard:
- Enables real-time tracking of key metrics such as patient outcomes and machine performance.
- Supports compliance with national dialysis quality standards and regulatory requirements.
- Identifies operational inefficiencies and resource constraints quickly.
- Improves decision-making for clinical managers and administrators.
- Drives targeted quality improvement initiatives in renal care.
- Enhances patient satisfaction through better scheduling and reduced downtime.
KPIs to Track in Dialysis Center Dashboards
Some key performance indicators (KPIs) every hospital should monitor include:
- Total Patients Treated: Number of unique patients receiving treatment.
- Treatment Completion Rate: Percentage of treatments completed as scheduled.
- Average Treatment Duration (hours): Mean length of dialysis sessions per patient.
- Patients with Complications: Number of patients experiencing adverse events during treatment.
- Dialysis Machine Downtime (hours): Total hours the machines are not operational.
- Complications by Ward: Distribution of complications across different facility wards.
Frequently Asked Questions
1. What is the main purpose of a Dialysis Center Clinical Performance Dashboard?
The primary purpose is to provide dialysis centers with a precise view of clinical and operational metrics, enabling them to monitor Kidney Dialysis Performance and enhance patient outcomes.
2. How does the dashboard help with Chronic Kidney Disease Monitoring?
It provides centralized tracking of key indicators, such as treatment completion, complication rates, and machine uptime, all of which are critical for ongoing management of chronic kidney disease.
3. Can this dashboard be used for both Hemodialysis and Peritoneal Dialysis Quality assessment?
Yes, the dashboard tracks metrics relevant for both modalities, enabling comprehensive Renal Care Dashboard functionality.