
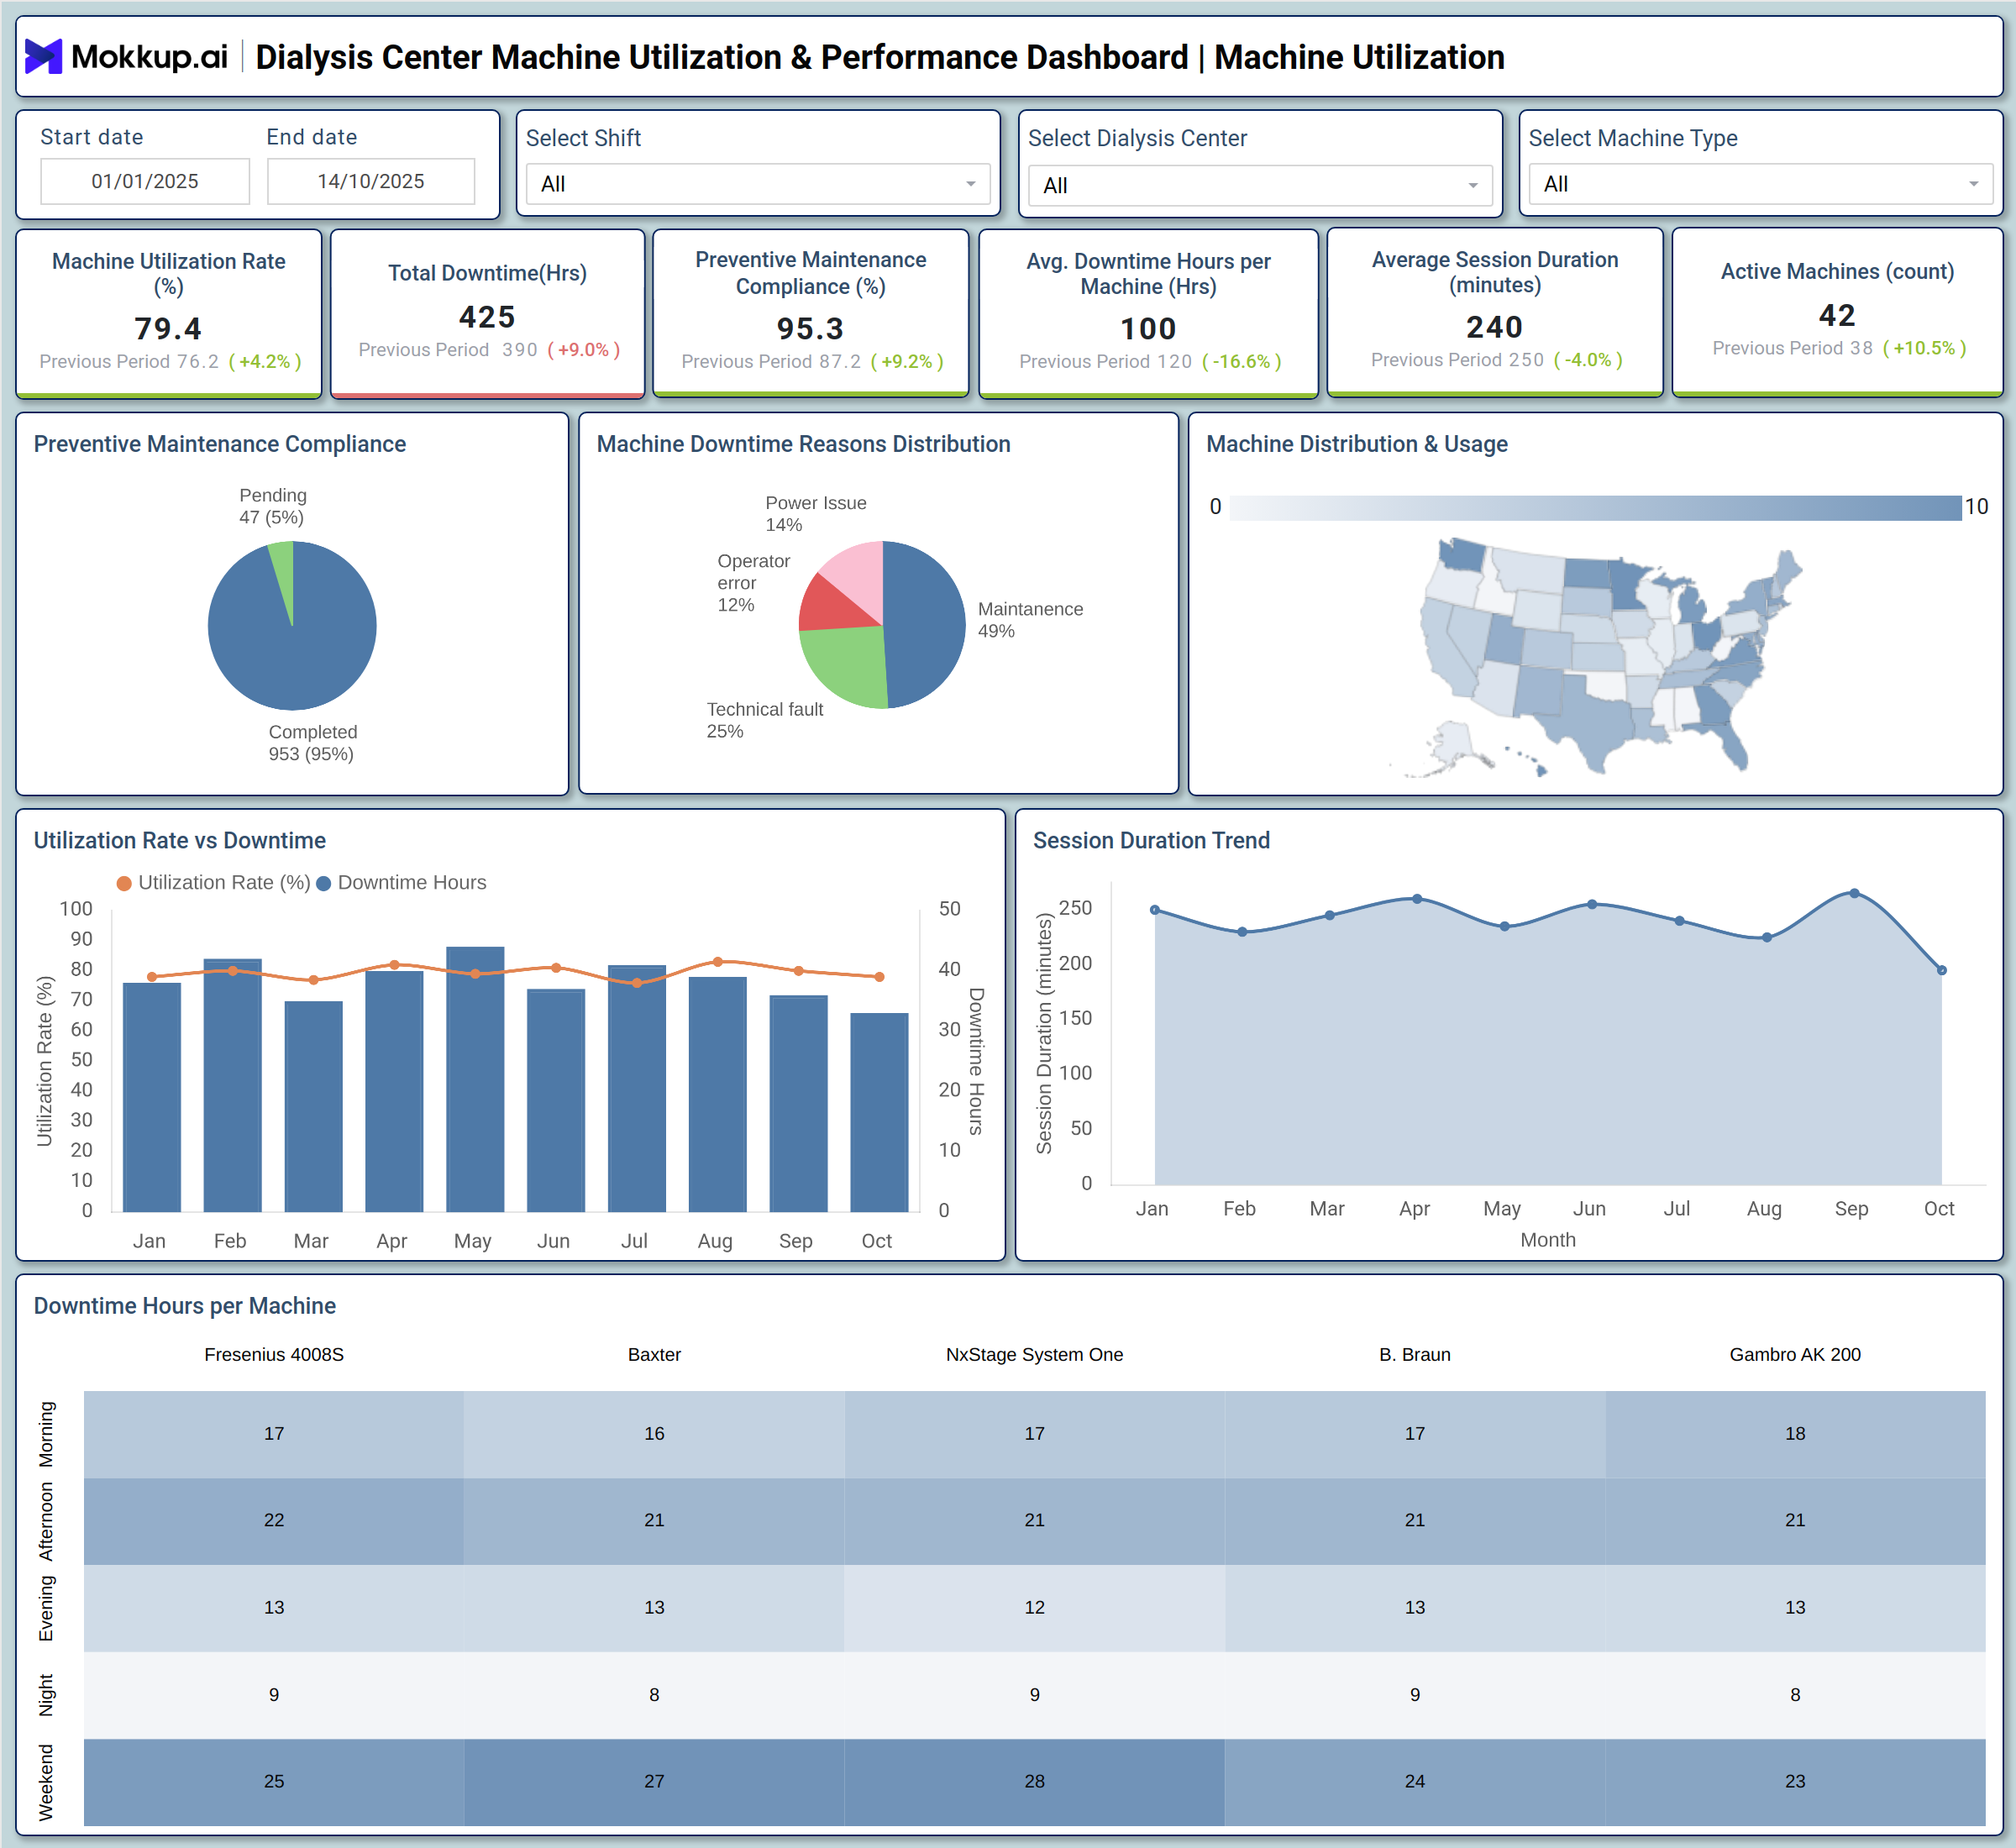
What is a Dialysis Center Machine Utilization and Operational Efficiency Dashboard?
A Dialysis Center Machine Utilization and Operational Efficiency Dashboard is a centralized platform designed to monitor machine performance, downtime, session durations, and compliance with preventive maintenance across dialysis centers. It enables operations managers, technical supervisors, and finance managers to track equipment usage and financial impact. By combining operational and financial data, this dashboard enables resource optimization, performance tracking, and cost management, ensuring maximum machine uptime and smooth center operations.
This operational analytics dashboard for dialysis center equipment usage helps identify underperforming machines, optimize scheduling, and enhance overall machine utilization metrics for dialysis centers.
How to Create a Dialysis Machine Utilization & Performance Dashboard
You don’t need to build your report from scratch-just start with a ready-to-use dashboard template from Mokkup. Add your data and export it as needed. Here’s how to do it:
1. Create or Log in to Your Mokkup Account
Start by signing up on Mokkup.ai using your email. If you already have an account, simply log in, and you’ll be all set.
2. Choose and Customize Your Dashboard Template
Find the Dialysis Machine Utilization & Performance Dashboard in the Templates section. Use the drag-and-drop editor to adjust KPIs, edit filters, or add elements based on your data.
3. Export to Your BI Tool
Once your dashboard wireframe is ready, use the BI Tool Export feature to send it directly to Power BI or Tableau for further analysis and enhancements. You can also download the dashboard as a PDF, PNG, or JPEG, embed it on a platform, or invite your team to collaborate.
Note: This is a Pro template. You’ll need a Pro subscription on Mokkup to use and customize this dashboard wireframe. Upgrade anytime to unlock full access.
Dialysis Machine Operations & Performance Dashboard Example
This dashboard template tracks dialysis machine usage, session durations, downtime, and preventive maintenance compliance. It highlights machines or shifts that face operational bottlenecks. By providing these insights, it helps optimize dialysis center operations and maximize machine uptime. The template also monitors machine-related costs, maintenance expenditures, and error incidents. It identifies machines with a high financial impact or frequent issues. These insights guide budgeting, replacements, and effective machine performance monitoring in dialysis centers.
How to Analyse Data in a Dialysis Machine Dashboard
- Start with KPIs: Machine utilization rate, downtime hours, preventive maintenance compliance, active machines, session durations, error incidents, and cost per session.
- Assess Operational Efficiency: Compare downtime hours and session durations across machines, shifts, and centers using the operational analytics dashboard for dialysis center equipment usage.
- Track Cost & Performance Trends: Monitor cost per machine session, maintenance expenditures, and performance efficiency scores to detect high-cost or underperforming machines.
- Analyze Machine & Center Insights: Heatmaps, pie charts, and map visuals help identify underutilized machines or centers with consistent downtime.
- Detect Patterns & Anomalies: Apply filters by time, machine type, shift, or center to detect recurring errors or unusually long session durations.
Benefits of a Dialysis Center Machine Dashboard
- Insights on machine utilization and operational efficiency – Provides instant visibility into how effectively dialysis machines are being used.
- Optimizes preventive maintenance and scheduling to maximize uptime – Helps plan maintenance and sessions to reduce downtime and improve availability.
- Identifies high-cost machines and reduces financial wastage – Highlights machines with high operating costs to cut unnecessary expenses.
- Tracks machine errors and performance trends for proactive interventions – Monitors faults and usage patterns to prevent issues before they escalate.
- Supports healthcare dialysis performance tracking for dialysis machines – Enables performance monitoring for each machine to ensure consistent patient care.
- Enables optimal resource allocation and transparency across centers – Assists management in distributing machines efficiently and maintaining operational clarity.
KPIs to Track in Dialysis Center Machine Dashboard
- Machine Utilization Rate (%) – Measures total usage versus available time to identify underused or overused machines.
- Total Downtime Hours – Displays total downtime to identify operational bottlenecks and maintenance requirements.
- Preventive Maintenance Compliance (%) – Tracks adherence to schedules to reduce unplanned downtime.
- Average Cost per Machine Session – Includes maintenance, consumables, and overhead to highlight cost efficiency.
- Performance Efficiency Score – A Weighted metric combining utilization, downtime, and errors to evaluate machine performance.
Frequently Asked Questions
1. How can machine performance monitoring help optimize dialysis center operations beyond downtime?
By combining session durations, error incidents, and preventive maintenance compliance, managers can identify operational bottlenecks, balance machine load, and improve scheduling to maximize machine uptime.
2. Why is analyzing cost per session alongside utilization important for dialysis centers?
Machines with high usage but excessive maintenance or downtime costs indicate inefficiencies. Tracking both metrics enables operational analytics for dialysis center equipment usage, helping to prioritize budget allocation.
3. How does monitoring preventive maintenance compliance improve performance tracking?
Compliance rates reveal machines at risk of unplanned downtime. Early identification supports healthcare dialysis performance tracking for dialysis machines and ensures operational reliability.