
What is a Desalination Intake & Outfall Operations Dashboard?
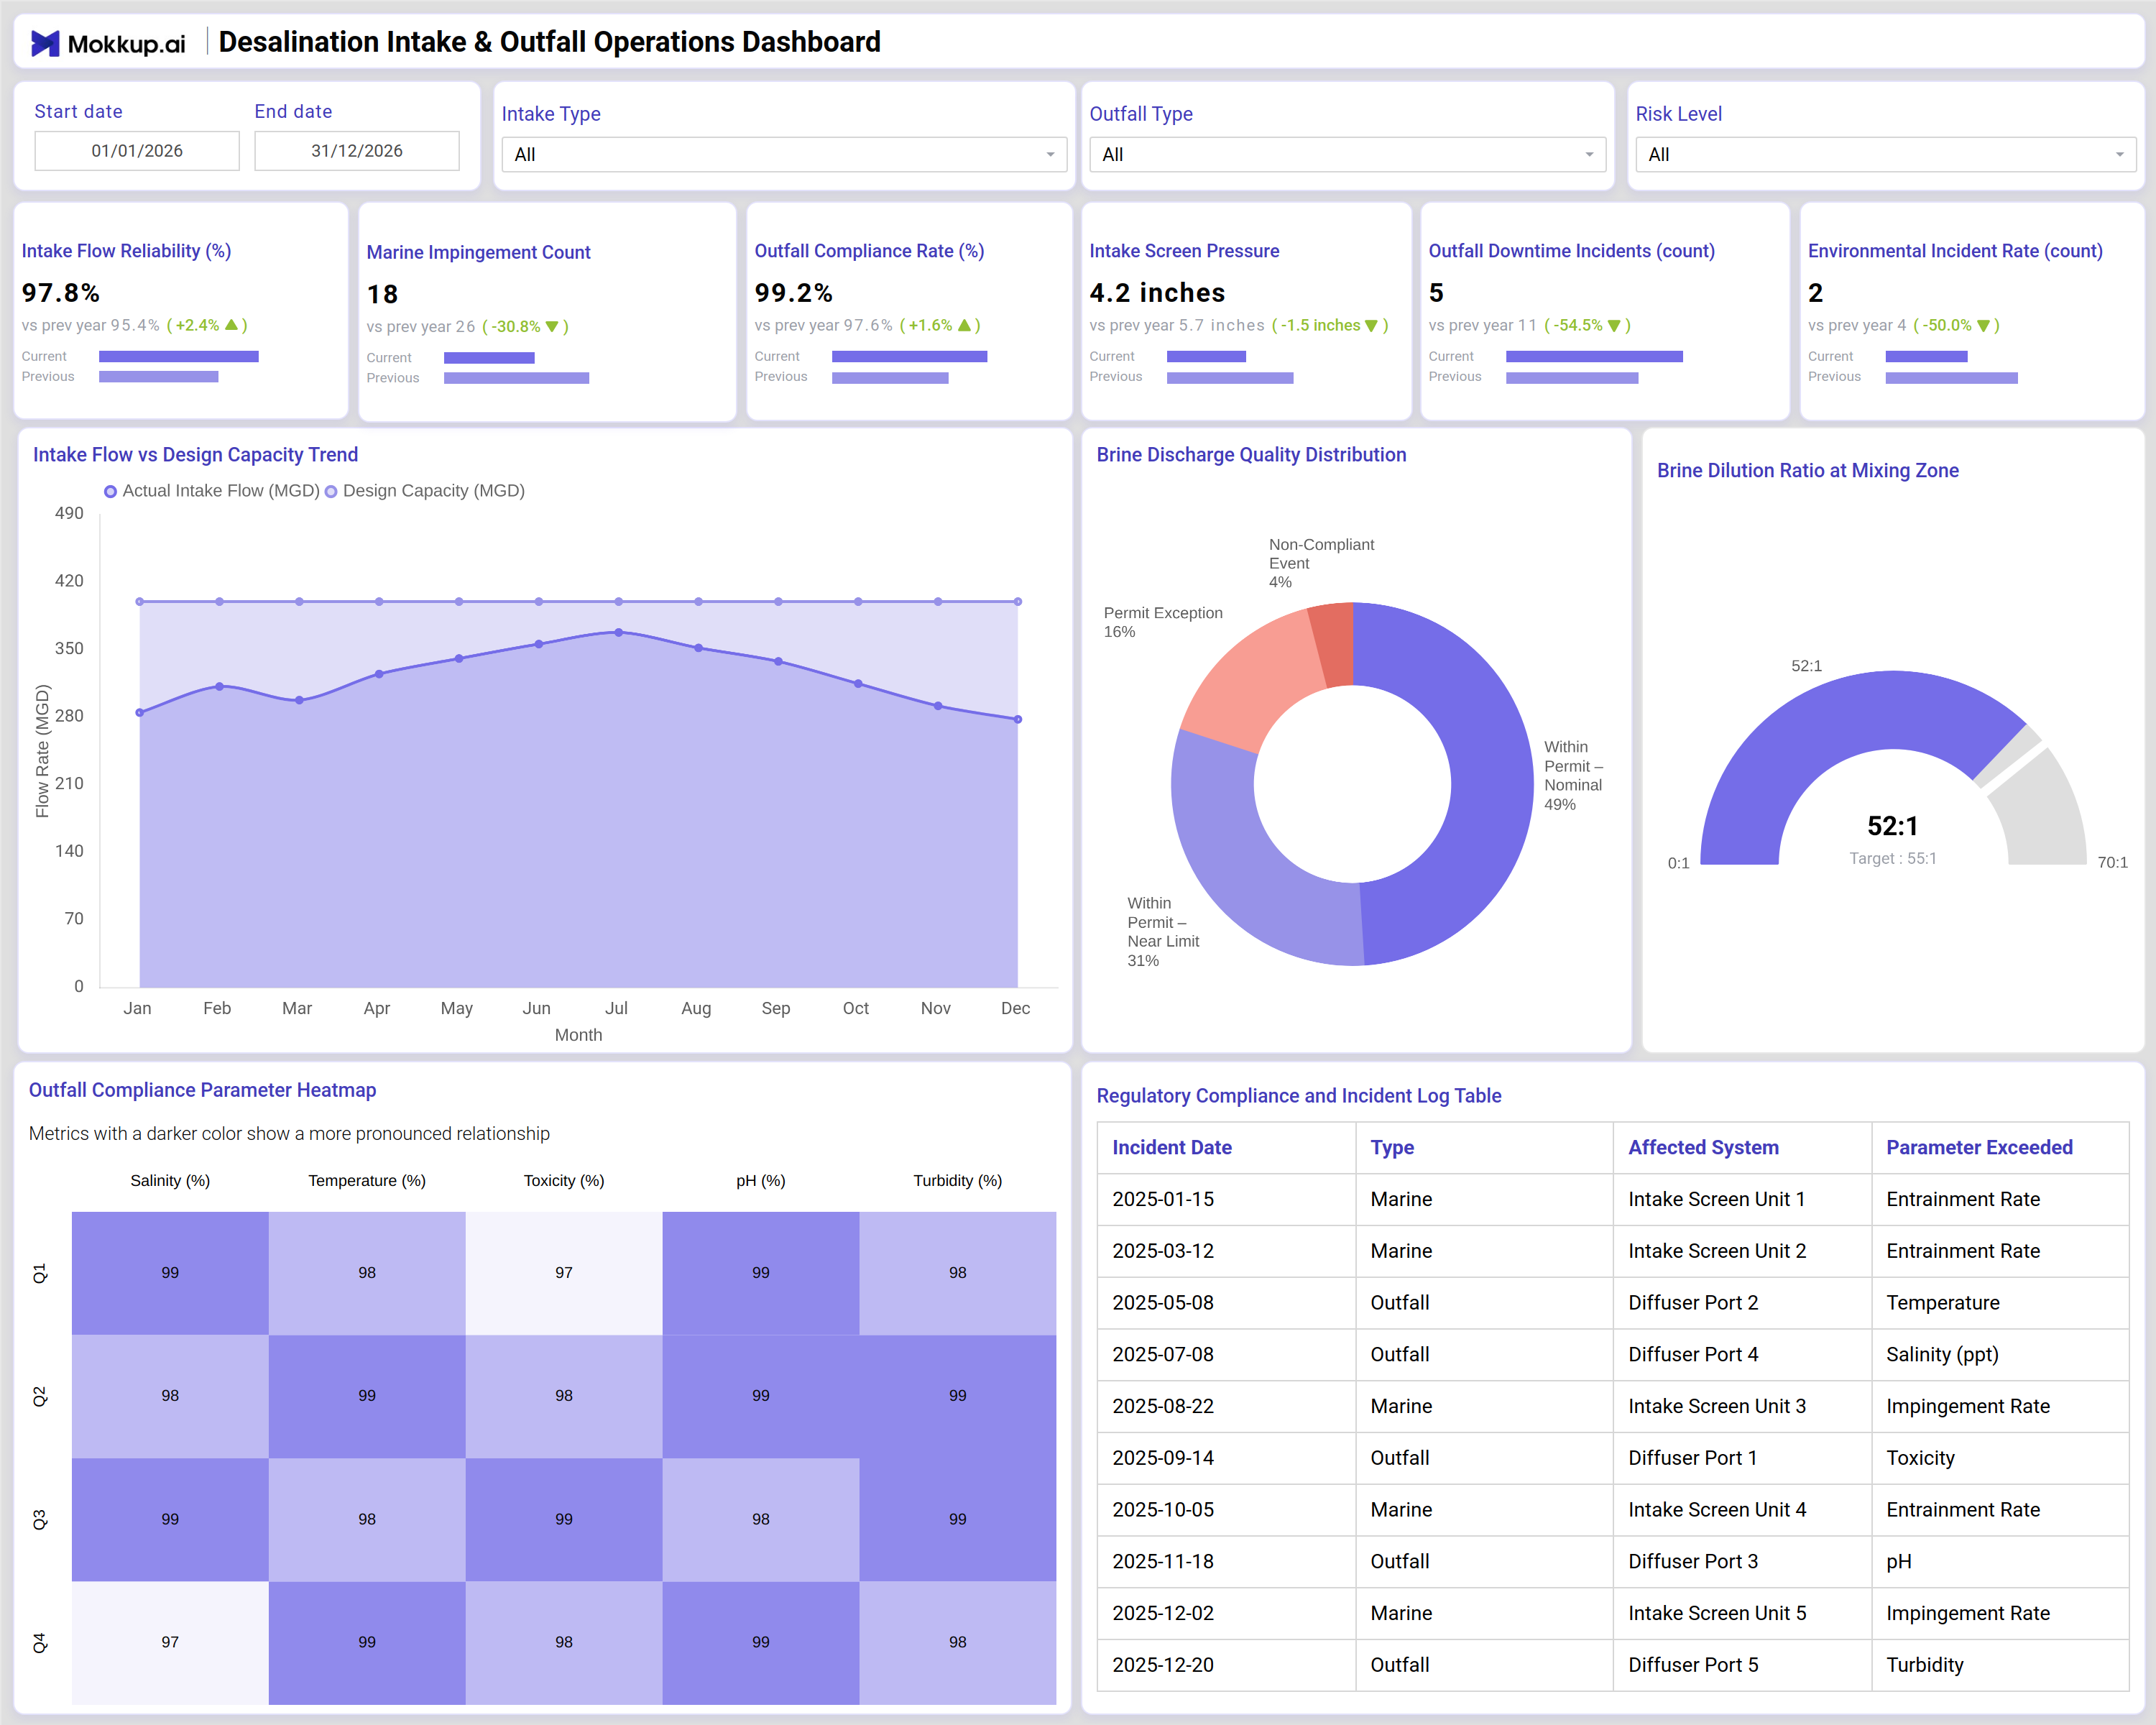
The Desalination Intake & Outfall Operations Dashboard is a structured desalination intake operations dashboard built for water utility operators, environmental compliance teams, and plant engineers managing seawater desalination facilities. It consolidates intake performance, outfall discharge behavior, and environmental incident data into a single monitoring view, enabling teams to track intake flow reliability tracking across the full annual cycle. The dashboard covers six core KPI tiles — Intake Flow Reliability, Marine Impingement Count, Outfall Compliance Rate, Intake Screen Pressure, Outfall Downtime Incidents, and Environmental Incident Rate — alongside trend charts, a brine quality donut, a dilution ratio gauge, a compliance heatmap, and a regulatory incident log table. It is designed for daily operational review as well as regulatory reporting cycles.
How to Create a Desalination Intake & Outfall Operations Dashboard
1. Create or Log in to Your Mokkup Account
Start by signing up on Mokkup.ai using your email. If you already have an account, just log in, and you'll be good to go.
2. Choose and Customize Your Dashboard Template
Find the Desalination Intake & Outfall Operations Dashboard template in the Templates section. Use the drag-and-drop editor to adjust KPIs, edit filters, or add elements based on your data.
3. Export to Your BI Tool
Once your dashboard wireframe is ready, use the BI Tool Export feature to send it directly to Power BI or Tableau for further analysis and enhancements. You can also download the dashboard as a PDF, PNG, or JPEG, embed it on a platform, or invite your team to collaborate.
Note: This is a Pro template. You'll need a Pro subscription on Mokkup to use and customize this dashboard wireframe. Upgrade anytime to unlock full access.
Desalination Intake & Outfall Operations Dashboard Example
An environmental compliance officer at a coastal desalination facility opens this dashboard at the start of each week to determine whether intake and outfall systems are operating within permitted boundaries. The top-row KPI tiles provide an immediate read on how the facility is performing across reliability, pressure, incident frequency, and outfall compliance monitoring — enabling the officer to spot deteriorating trends before they become reportable violations. The outfall compliance monitoring dashboard view is particularly useful during high-demand months when discharge volumes peak and brine discharge quality tracking becomes critical for permit adherence. Operations managers use the Intake Flow vs Design Capacity area chart to assess whether actual intake flow is tracking close to design thresholds month over month. When intake flow dips or spikes unexpectedly, the chart gives the team a clear basis for investigating screen blockages or pump performance issues.
Alongside this, the Brine Dilution Ratio at Mixing Zone gauge allows planners to verify that the dilution ratio stays above the regulatory target — a key check for outfall permit compliance. Environmental scientists use the Outfall Compliance Parameter Heatmap to understand which parameters — salinity, temperature, toxicity, pH, or turbidity — showed the strongest pressure across each quarter. When a darker cell appears in a specific quarter-parameter combination, the team investigates the corresponding entries in the Regulatory Compliance and Incident Log Table, which details the incident date, type, affected system, and parameter exceeded. This structured incident log transforms compliance review from a manual paper trail into a filterable, sortable audit view.Taken together, the dashboard gives intake operations and environmental teams the structured visibility they need to manage marine impingement monitoring desalination requirements, prepare for regulatory audits, and make data-backed decisions about maintenance scheduling and operational adjustments throughout the year.
How to Analyze Data in a Desalination Intake & Outfall Operations Dashboard
Here is how you can analyze data from this dashboard:
- Use the Intake Type and Outfall Type filters to isolate performance for specific intake or discharge configurations.
- Monitor the Intake Flow vs Design Capacity area chart to detect when actual flow deviates from design capacity thresholds.
- Track the Brine Dilution Ratio at Mixing Zone gauge to verify dilution stays above the regulatory target of 40:1.
- Review the Brine Discharge Quality Distribution donut to assess the share of non-compliant events versus within-permit discharges.
- Analyze the Outfall Compliance Parameter Heatmap to identify which quarter and parameter combination shows the most pronounced compliance pressure.
- Filter by Risk Level to prioritize high-risk incidents and focus attention on the most operationally significant events.
- Use the Regulatory Compliance and Incident Log Table to trace each incident by date, type, affected system, and parameter exceeded.
- Compare Outfall Downtime Incidents against Marine Impingement Count quarterly to identify periods where both operational and environmental stress coincide.
Benefits of a Desalination Intake & Outfall Operations Dashboard
The following are the benefits of using this dashboard:
- Centralizes intake flow, outfall discharge, and incident data across the full facility operation in one structured template.
- Supports outfall compliance monitoring dashboard review for both daily operations and regulatory reporting cycles.
- Reduces manual data compilation for permit reports with pre-built KPI tiles and a structured incident log table.
- Enables quarter-level analysis of brine discharge quality tracking trends to guide environmental remediation decisions.
- Provides a heatmap breakdown of five outfall compliance parameters — salinity, temperature, toxicity, pH, and turbidity.
- Helps environmental compliance teams and operations managers align on the same performance view without rebuilding reports.
- Gives plant engineers and regulatory officers a shared audit trail through the Incident Log Table and brine quality charts.
KPIs to Track in a Desalination Intake & Outfall Operations Dashboard
The following key KPIs can be tracked by using this dashboard:
- Intake Flow Reliability (%): Measures the percentage of time intake systems deliver flow within acceptable design parameters — central to intake flow reliability tracking and identifying pump or screen degradation early.
- Marine Impingement Count: Tracks the number of marine organism impingement events at intake screens — a primary indicator in marine impingement monitoring desalination compliance programs.
- Outfall Compliance Rate (%): Measures the proportion of outfall discharge events that meet all regulatory permit conditions — the headline indicator in any outfall compliance monitoring dashboard.
- Intake Screen Pressure: Monitors hydraulic pressure on intake screens — elevated readings signal blockages or fouling that require maintenance intervention.
- Outfall Downtime Incidents (count): Counts operational interruptions to the outfall system — used to assess desalination plant environmental compliance risk during extended downtime periods.
- Environmental Incident Rate (count): Tracks the total number of environmental incidents recorded — a cross-cutting measure linking brine discharge quality tracking outcomes to regulatory reporting obligations.
Frequently Asked Questions
1. Who benefits most from the Desalination Intake & Outfall Operations Dashboard?
Environmental compliance officers, plant operations managers, and regulatory affairs teams at seawater desalination facilities benefit most. It is also useful for environmental consultants managing permit audits and monitoring programs across multiple facilities.
2. Can this dashboard track brine discharge quality across multiple permit parameters?
Yes. The Brine Discharge Quality Distribution donut chart categorizes discharge events by compliance status, and the Outfall Compliance Parameter Heatmap tracks salinity, temperature, toxicity, pH, and turbidity separately across each quarter for granular parameter-level analysis.
3. How does the Regulatory Compliance and Incident Log Table work?
The table records each compliance incident with its date, type (Marine or Outfall), the affected system, and the specific parameter that was exceeded. It gives teams a structured audit trail for regulatory submissions without requiring separate manual logging.