What is a Dental Hospital Operations Dashboard?
A Dental Hospital Operations Dashboard is a performance analytics tool designed to monitor and optimize the daily operations of dental clinics. It tracks clinical productivity, resource utilization, maintenance compliance, and operational efficiency. The dashboard integrates appointment data, equipment usage, and staff performance metrics to help clinics deliver quality care while minimizing downtime.
By using this Dental Hospital Operations Dashboard template, administrators gain real-time visibility into patient flow, chair utilization, treatment duration, and maintenance efficiency. It serves as a real-time dental performance monitoring dashboard, ensuring a smooth balance between patient care delivery and operational effectiveness.
How To Create a Dental Hospital Operations Dashboard
You don’t need to build your report from scratch—just start with a ready-to-use sample blood safety & compliance dashboard template from Mokkup. Add in your data and export it however you like. Here’s how to do it:
1. Create or Log in to Your Mokkup Account
Start by signing up on Mokkup.ai using your email. If you already have an account, just log in, and you’ll be good to go.
2. Choose and Customize Your Dashboard Template
You can find the Dental Hospital Operations Dashboard template in the Templates section. Use the drag-and-drop editor to adjust KPIs, edit filters, or add elements based on your data.
3. Export to Your BI Tool
Once your dashboard wireframe is ready, use the BI Tool Export feature to send it directly to Power BI or Tableau for further analysis and enhancements. You can also download the dashboard as a PDF, PNG, or JPEG, embed it on a platform, or invite your team to collaborate.
Note: This is a Pro template. You’ll need a Pro subscription on Mokkup to use and customize this dashboard wireframe. Upgrade anytime to unlock full access.
Dental Hospital Operations Dashboard Example
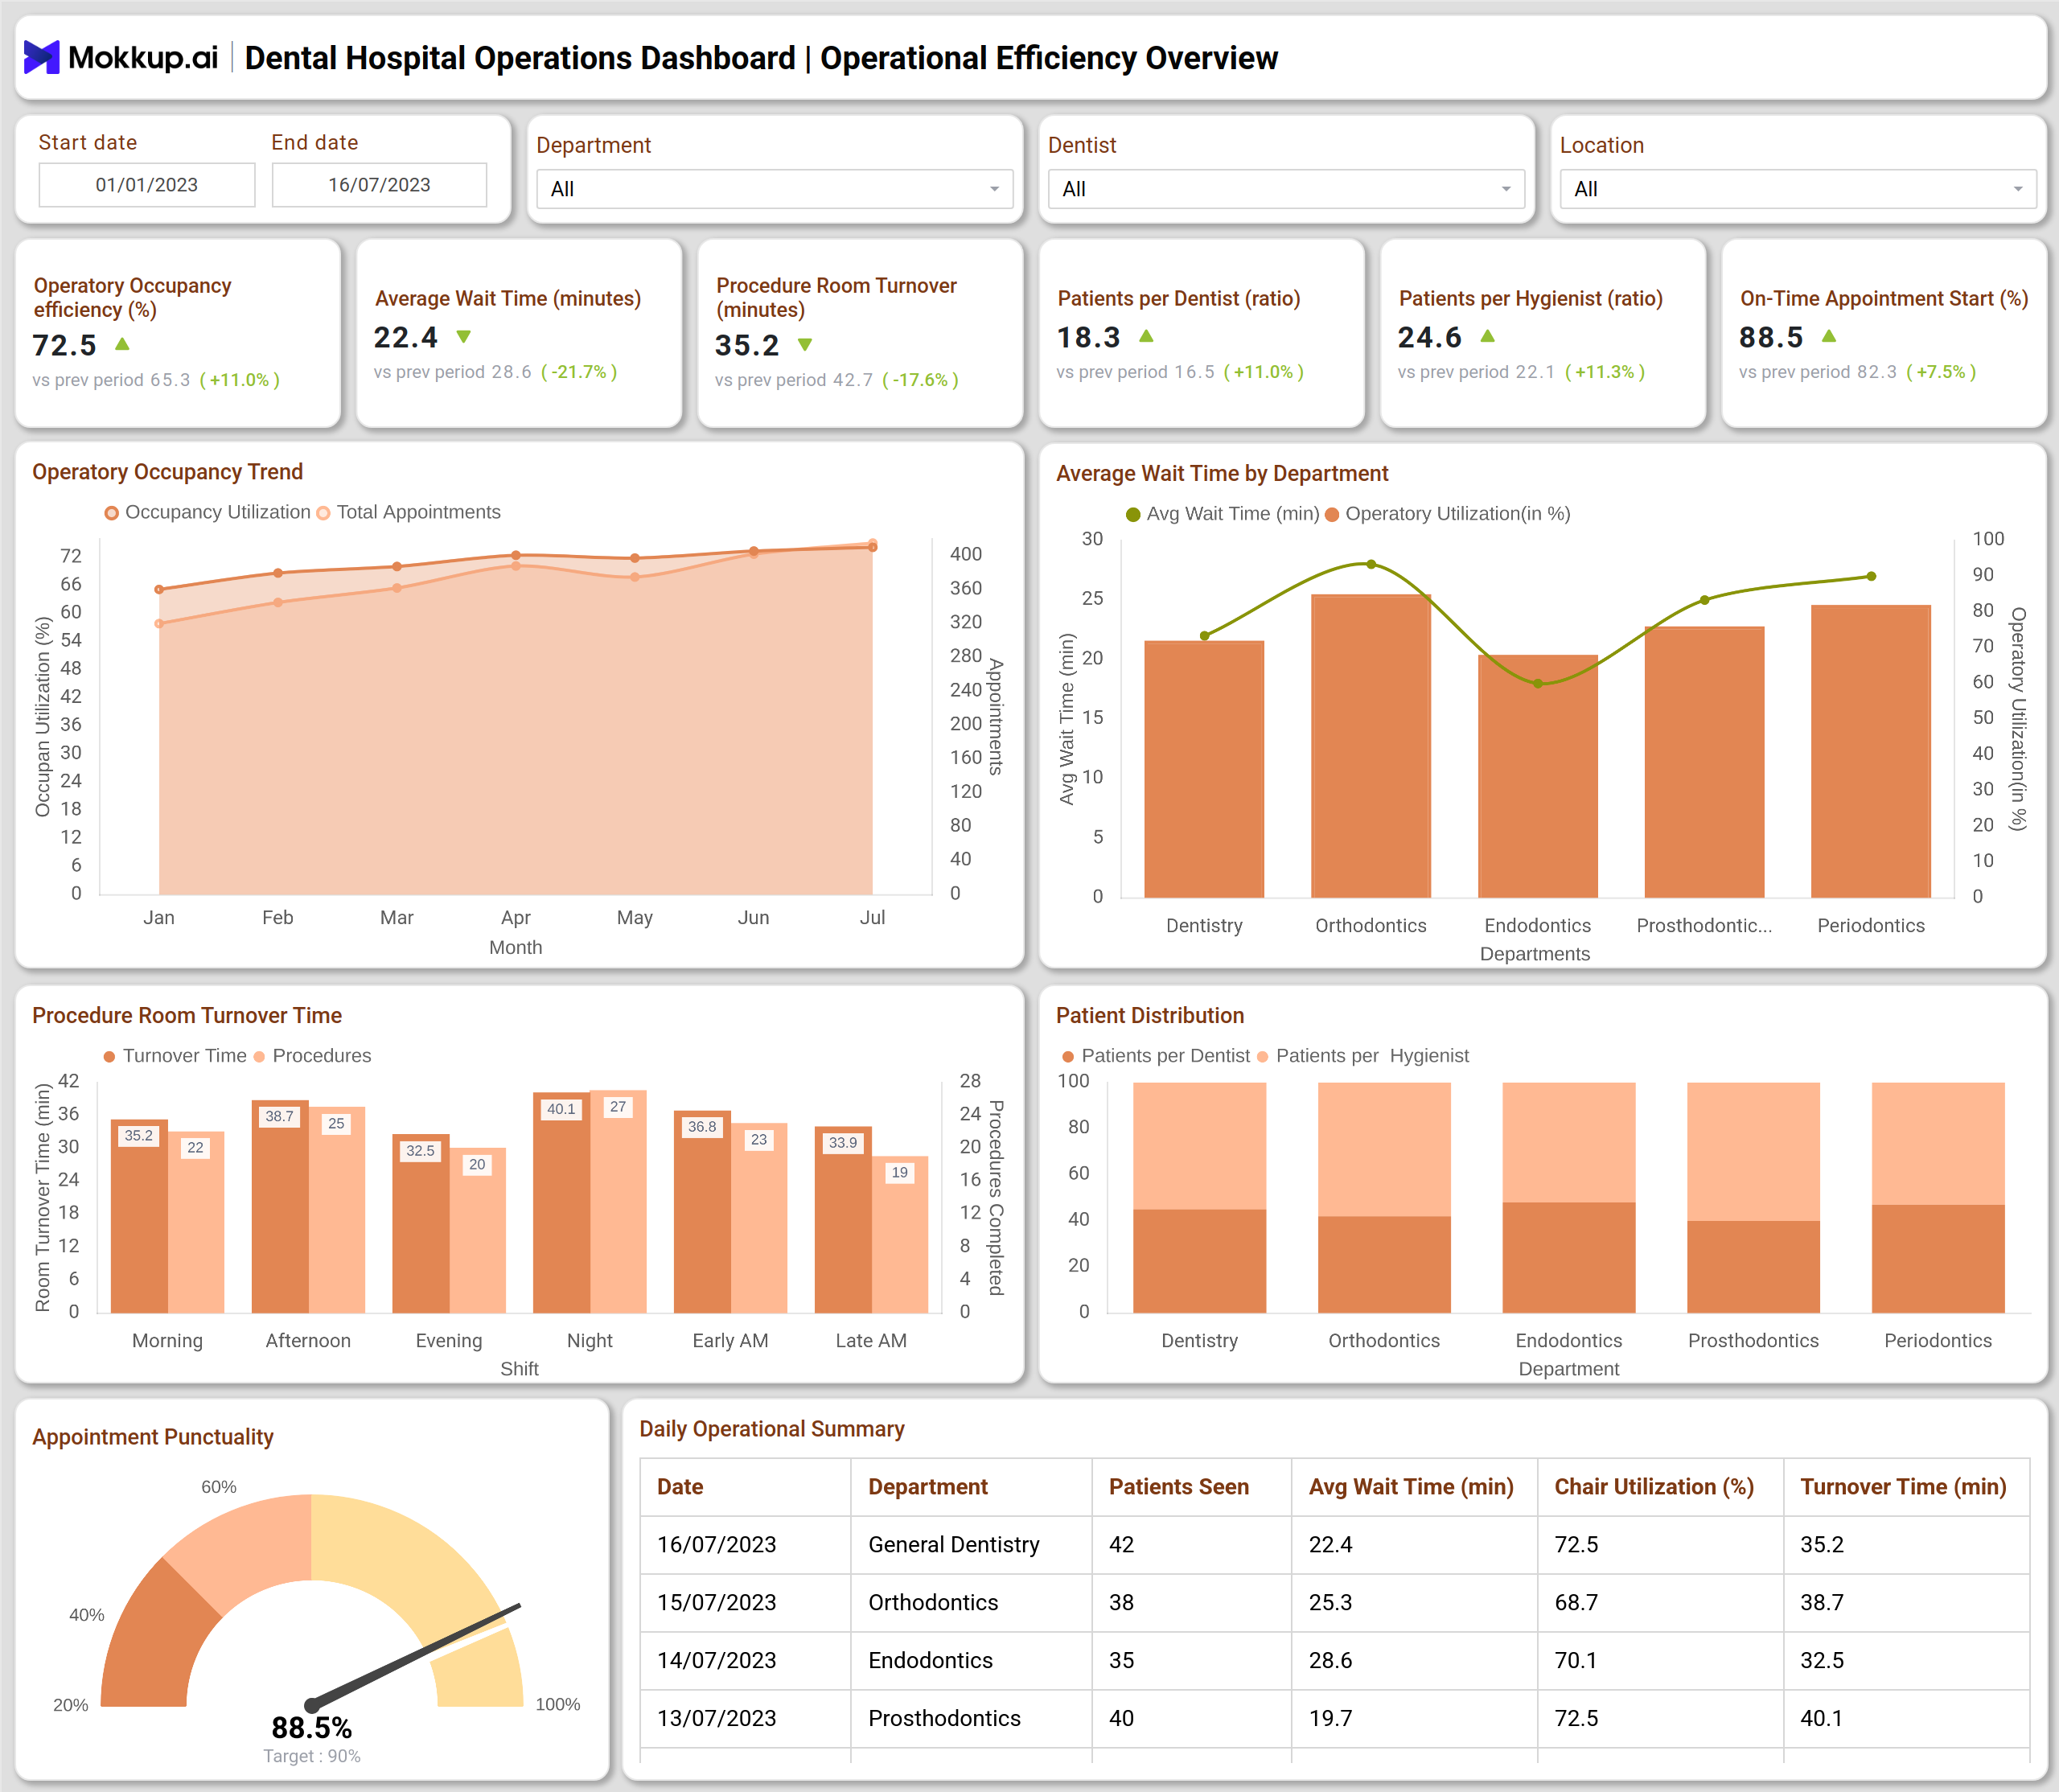
The Dental Hospital Operations Dashboard provides a comprehensive view of clinic performance through two main analytical perspectives: operational efficiency and resource utilization.
The Operational Efficiency Overview screen focuses on key metrics such as chair utilization rate, average wait time, and procedure room turnover. It visualizes patient flow and operational speed, allowing managers to identify time bottlenecks and enhance patient throughput. The chair utilization trend and department-wise wait time analysis help balance scheduling and optimize dentist-to-patient ratios. Meanwhile, the appointment punctuality gauge and daily operational summary enable clinics to track timeliness and consistency in service delivery across departments like orthodontics, prosthodontics, and surgery.
The Resource Utilization & Maintenance screen highlights the performance and availability of clinical assets and staff. Metrics such as equipment downtime, maintenance compliance, and staff utilization rate reflect how efficiently resources are being managed. The maintenance compliance status chart helps identify overdue tasks, while the staff utilization by role graph showcases workload distribution among dentists, hygienists, assistants, and technicians. Additionally, the equipment downtime mapping heatmap and resource summary table help detect underperforming assets and schedule maintenance effectively.
Together, both views deliver a unified operational perspective, enabling dental clinics to maintain smooth workflows, improve patient satisfaction, and ensure optimal resource readiness via this Dental resource management dashboard.
How to Analyze Data in Dental Hospital Operations Dashboards
To make the best use of a Dental Hospital Operations Dashboard template, clinics can follow these analytical steps:
- Track Chair Utilization Trends – Monitor daily and monthly chair use to ensure efficient patient flow.
- Measure Wait and Turnover Time – Compare wait times across departments to identify bottlenecks in service delivery.
- Monitor Equipment Downtime and Maintenance – Use the real-time dental performance monitoring dashboard to minimize operational disruptions.
- Analyze Staff Productivity – Evaluate utilization rates and adjust schedules to prevent workload imbalance.
- Assess Treatment Duration and Efficiency – Identify long procedures or high-demand treatments to allocate resources accordingly.
Benefits of Dental Hospital Operations Dashboards
Implementing a Dental Hospital Operations Dashboard delivers multiple operational and strategic advantages:
- Improved Patient Throughput: Reduces wait time and maximizes chair turnover for higher patient satisfaction.
- Optimized Resource Utilization: The Dental Hospital Operations Dashboard template ensures effective use of staff, rooms, and equipment.
- Enhanced Maintenance Compliance: Preventive maintenance tracking minimizes breakdowns and downtime.
- Performance Transparency: The real-time dental performance monitoring dashboard offers accurate visibility into staff efficiency and operational trends.
- Strategic Decision Support: Helps clinic managers allocate resources based on data-driven insights rather than assumptions.
KPIs to Track in Dental Hospital Operations Dashboards
Here are the KPIs to track in this Dental clinic analytics dashboard:
- Chair Utilization Rate (%): Tracks overall usage of dental chairs to measure operational efficiency.
- Average Wait Time (Minutes): Indicates patient waiting duration before treatment begins, reflecting workflow efficiency.
- Equipment Downtime (Hours): Monitors non-operational hours for equipment, impacting clinic productivity.
- Staff Utilization Rate (%): Evaluates workload distribution among clinical and support staff.
- Maintenance Compliance (%): Assesses adherence to scheduled equipment servicing and preventive maintenance.
Frequently Asked Questions
Q1. How does a Dental Hospital Operations Dashboard improve clinic efficiency?
It integrates clinical, operational, and maintenance data into a single view, enabling real-time tracking of performance, resource use, and bottlenecks.
Q2. What Dentist performance KPIs does this dashboard help measure?
It helps track how effectively dentists use their time and resources. Key dentist performance KPIs include chair utilization rate, average treatment duration, appointment punctuality, patient throughput per dentist, and individual workload distribution. Together, these metrics show productivity, efficiency, and scheduling effectiveness without relying on guesswork.
Q3. What is the ideal frequency to review dental operations data?
Daily monitoring is recommended for operational efficiency, while monthly reports help identify long-term trends and performance gaps.