
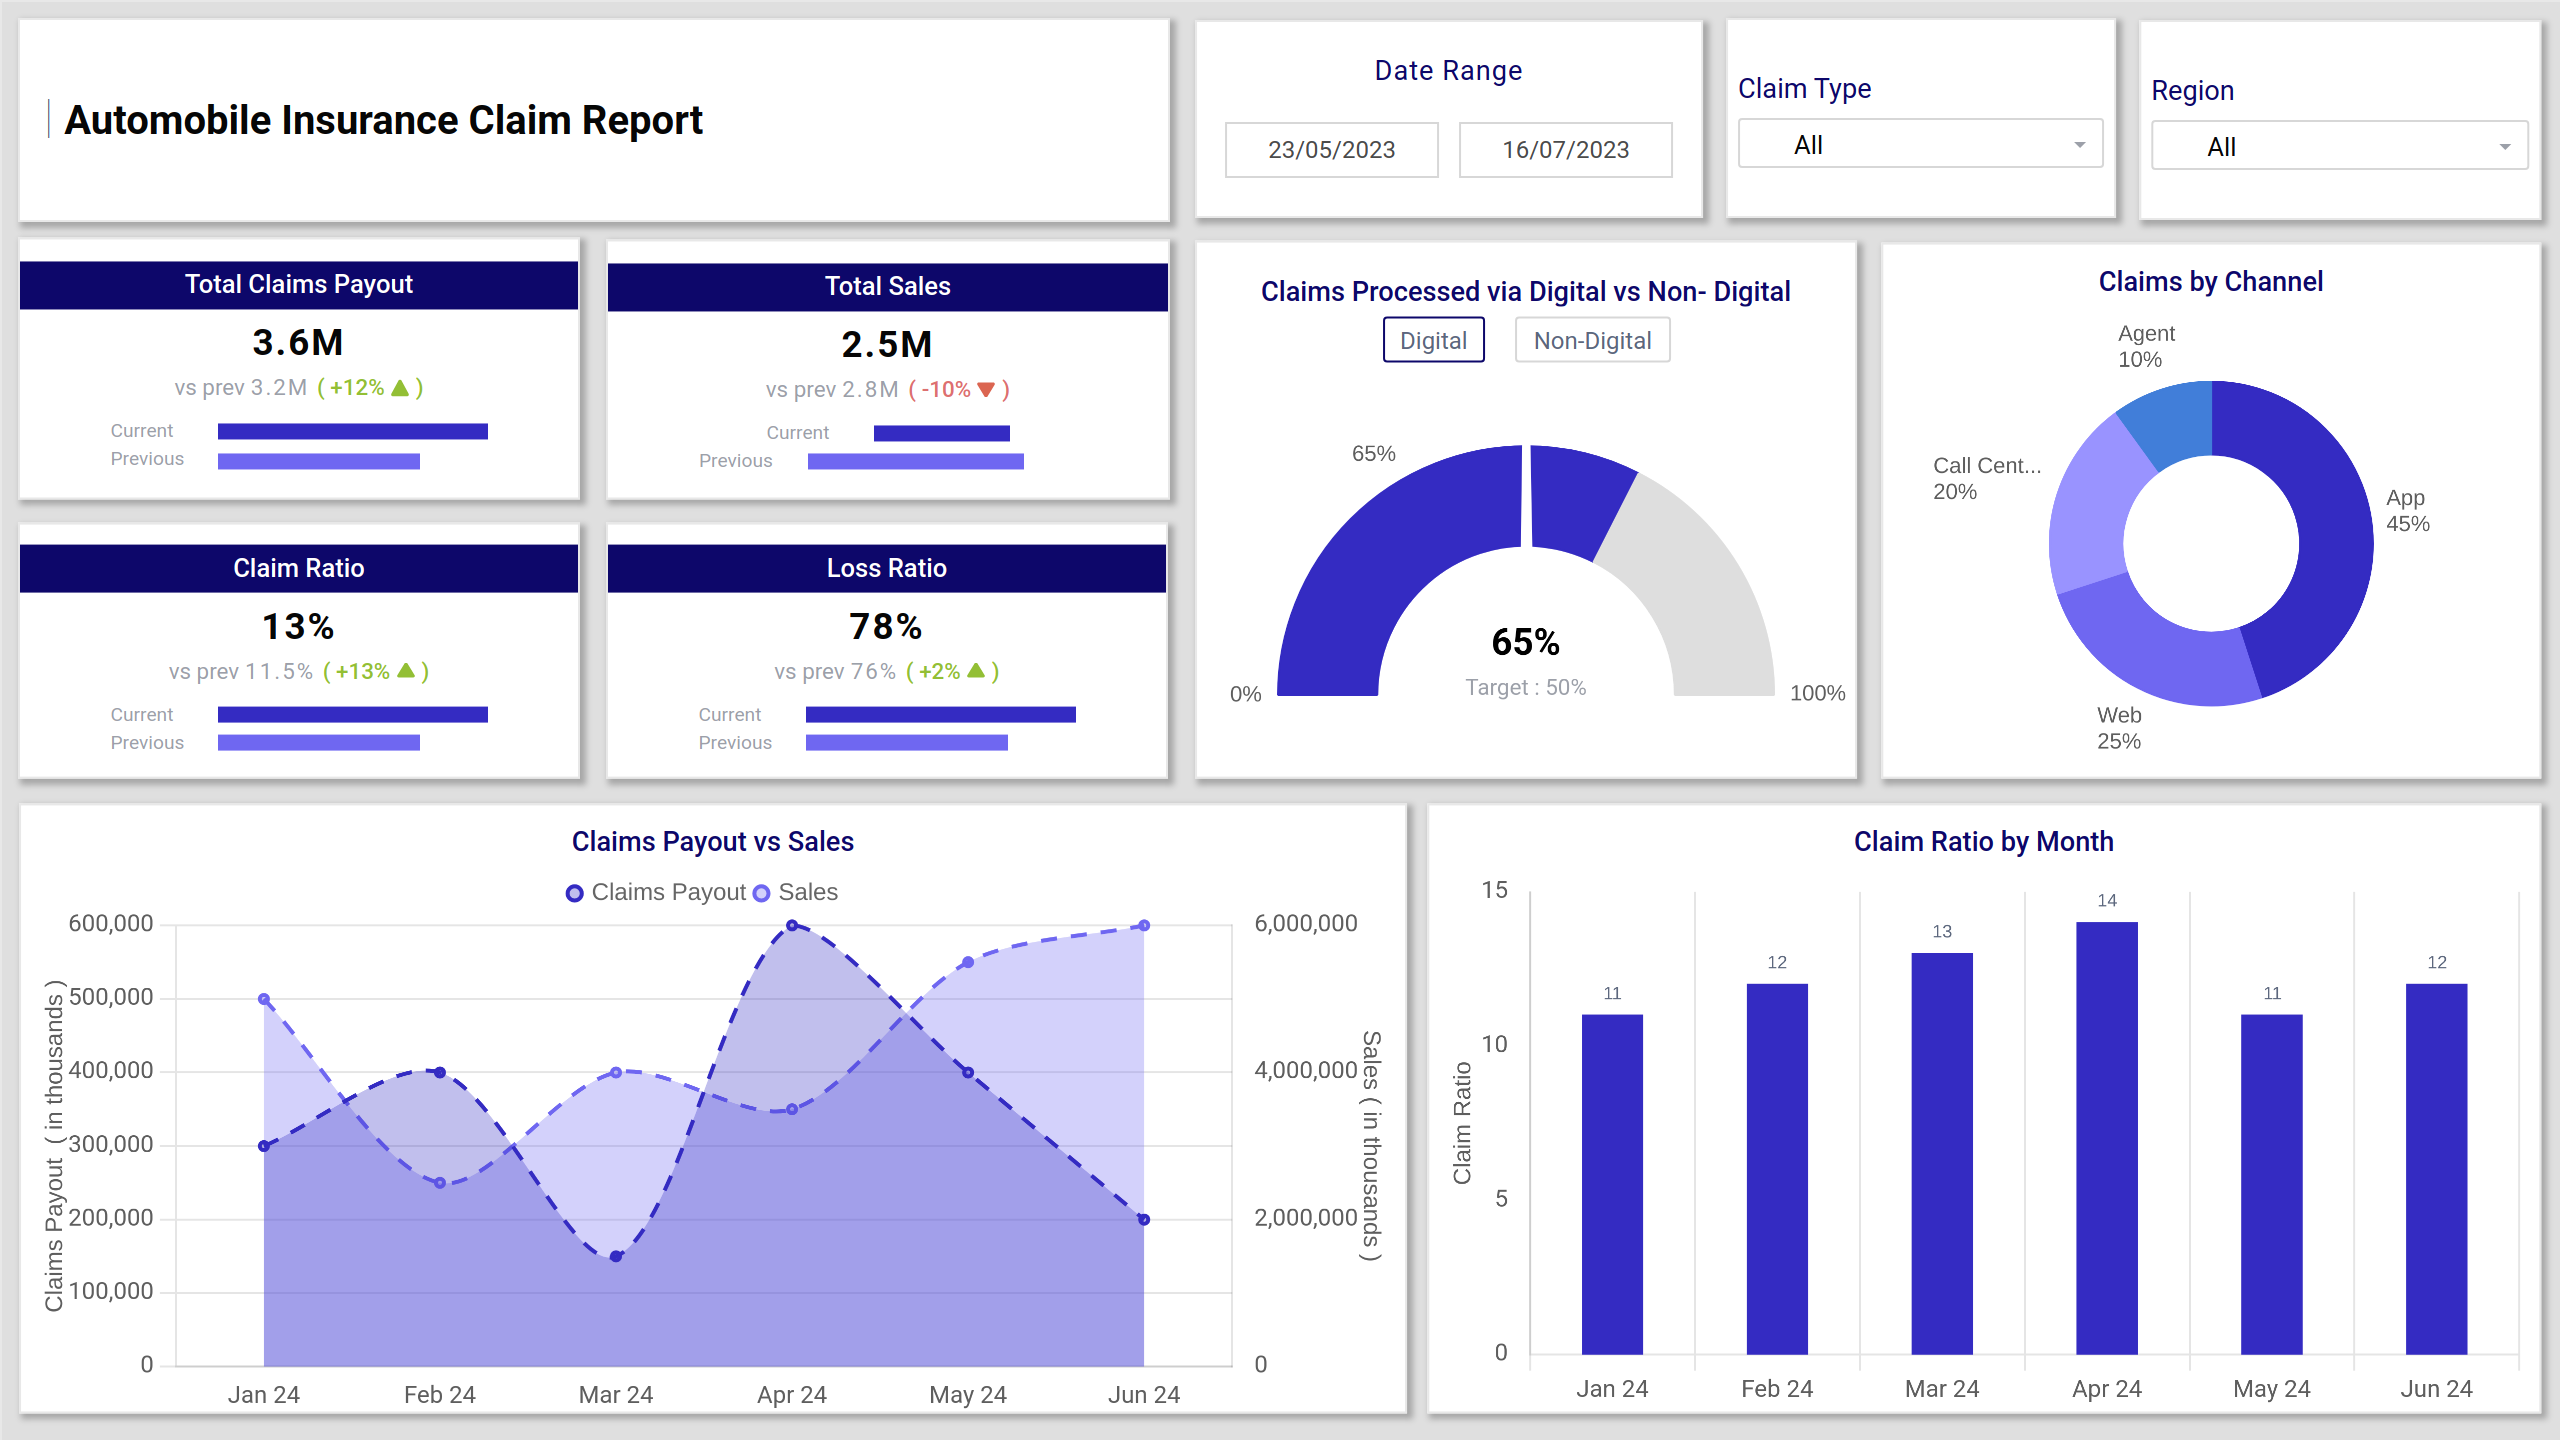
What is an Automotive Insurance Claim Report Dashboard?
An Automotive Insurance Claim Report Dashboard is a comprehensive analytics tool that helps insurance companies track and optimize claims processes. As a type of car insurance claim dashboard, it offers real-time insights into various aspects of claims management, such as claims performance, processing efficiency, and regional trends, enabling insurers to make informed decisions and improve overall operational effectiveness.
Automotive Insurance Claim Dashboard Example
Design your automotive insurance claim dashboard using a layout that categorizes key performance metrics like claims performance, digital transformation, and motor claims specifics. The Mokkup Vehicle Insurance Dashboard Template comes with pre-built sections for claims performance, digital vs. non-digital claims, and regional analysis. With interactive visuals, it highlights claims trends, payout patterns, and processing times. Once the data is added, you can export the wireframe to Power BI or Tableau for in-depth analysis.
How to Analyze Data in Automotive Insurance Dashboards
The Automotive Insurance Claim Report Dashboard is designed to provide a comprehensive analysis of key claims data across three main screens. As part of an auto claims analytics dashboard, each screen focuses on specific aspects of the claims process, making it easier for stakeholders to monitor and optimize performance.
The three main screens include:
- Overview of Claims and Payout: Provides an overall view of claims performance and financial data, helping monitor payouts and assess profitability.
- Motor Vehicle Claims Focus: Focuses on automotive claims, including metrics such as the volume of claims, average payout, and vehicle type distribution.
- Claims Efficiency and Channel Analysis: Tracks the efficiency of claims processing across different channels, highlighting metrics like claims processing time and digital vs. non-digital claims.
By analyzing these screens, users can gain a comprehensive view of claims performance and operational efficiency.
How to Create an Automotive Insurance Dashboard
Building your automotive insurance dashboard is easy with Mokkup’s pre-designed template. Follow these steps to get started:
1. Create or Log in to Your Mokkup Account
Sign up on Mokkup.ai with your email, or log in if you already have an account.
2. Choose and Customize Your Automotive Insurance Claim Report
Go to the Templates section, select the Sample Auto Insurance Dashboard template, and use the drag-and-drop editor to update KPIs, add patient data, or apply filters by location, department, or timeline.
3. Export to Your BI Tool
Once your data is added, export the dashboard to Power BI or Tableau for detailed analysis. You can also download it as a PDF or image, embed it in reports, or collaborate with your team by sharing the file.
Note: This is a Pro template. To use and customize this dashboard, a Pro subscription is required on Mokkup. Upgrade anytime to unlock full access.
Benefits of Automotive Insurance Dashboards
An automotive insurance dashboard offers several key advantages. It brings together claims, financial, and operational data in one place, making it easier for insurance teams to streamline processes and improve service delivery. With Mokkup’s customizable dashboard templates, you can:
- Simplify Claims Oversight: Clearly visualize payout trends, claim ratios, and digital adoption metrics across various regions and channels.
- Enhance Transparency: Share insights on claims processing time, high-severity cases, and regional performance in a format that’s easy for stakeholders to understand.
- Customizable Layouts: Tailor visuals, filters, and KPIs to match your insurance company’s reporting and operational goals.
Overall, an insurance claim performance dashboard helps you make smarter decisions, reduce operational bottlenecks, and present insights with clarity and confidence, making it the best automotive insurance dashboard for modern insurance teams.
KPIs to Track in Automotive Insurance Dashboards
An automotive insurance dashboard offers a comprehensive view of key business metrics—from financial outflows to claims resolution speed. Insurance teams can use these insights to evaluate performance, detect inefficiencies, and improve customer satisfaction. Key KPIs include:
- Total Claims Payout – Captures the total value of claims settled, helping assess financial impact and budget allocation.
- Claim Ratio – Measures the volume of claims in relation to active policies, providing a quick snapshot of risk exposure.
- Loss Ratio – Compares claims paid to premiums earned, indicating profitability and underwriting effectiveness.
- Digital vs Non-Digital Claims – Highlights adoption of digital channels, helping teams prioritize tech-driven improvements.
- Average Claim Processing Time – Tracks how quickly claims are resolved, helping improve operational efficiency and customer experience.
Frequently Asked Questions
1. How do I update the dashboard with my company’s data?
Once you select the Automotive Insurance template in Mokkup, you can easily replace placeholder metrics with your datasets using the drag-and-drop editor.
2. Can I present this dashboard in stakeholder meetings?
You can definitely export the dashboard to PDF or image format for presentations, or share it directly from Mokkup with team members and stakeholders.