
What Is a Crop Yield Forecasting & Production Analytics Dashboard?
A crop yield forecasting & production analytics dashboard is a data-driven tool that helps farmers, agribusinesses, and agricultural researchers monitor, predict, and optimize crop production. It integrates historical yield data, weather patterns, soil conditions, and farming practices into a single interface to provide actionable insights. By leveraging precision agriculture analytics, this dashboard enables users to track forecasted vs. actual crop yields, analyze production trends, and identify factors affecting farm profitability. Unlike traditional farming methods, this dashboard uses AI-powered crop yield forecasting tools to generate accurate predictions, helping farmers make informed decisions on planting, irrigation, fertilization, and harvesting. It also supports seasonal yield forecasting, allowing agribusinesses to plan storage, logistics, and market strategies efficiently.
How to Create a Crop Yield Forecasting & Production Analytics Dashboard
You don't need to build your report from scratch, just start with a ready-to-use dashboard template from Mokkup. Add in your data and export it however you like. Here's how to do it:
1. Create or Log in to Your Mokkup Account
Start by signing up on Mokkup.ai using your email. If you already have an account, just log in, and you'll be good to go.
2. Choose and Customize Your Dashboard Template
Find the Crop Yield Forecasting & Production Analytics Dashboard template in the Templates section. Use the drag-and-drop editor to adjust KPIs, edit filters, or add elements based on your data.
3. Export to Your BI Tool
Once your dashboard wireframe is ready, use the BI Tool Export feature to send it directly to Power BI or Tableau for further analysis and enhancements. You can also download the dashboard as a PDF, PNG, or JPEG, embed it on a platform, or invite your team to collaborate.
Note: This is a Pro template. You'll need a Pro subscription on Mokkup to use and customize this dashboard wireframe. Upgrade anytime to unlock full access.
Crop Yield Forecasting & Production Analytics Dashboard Example
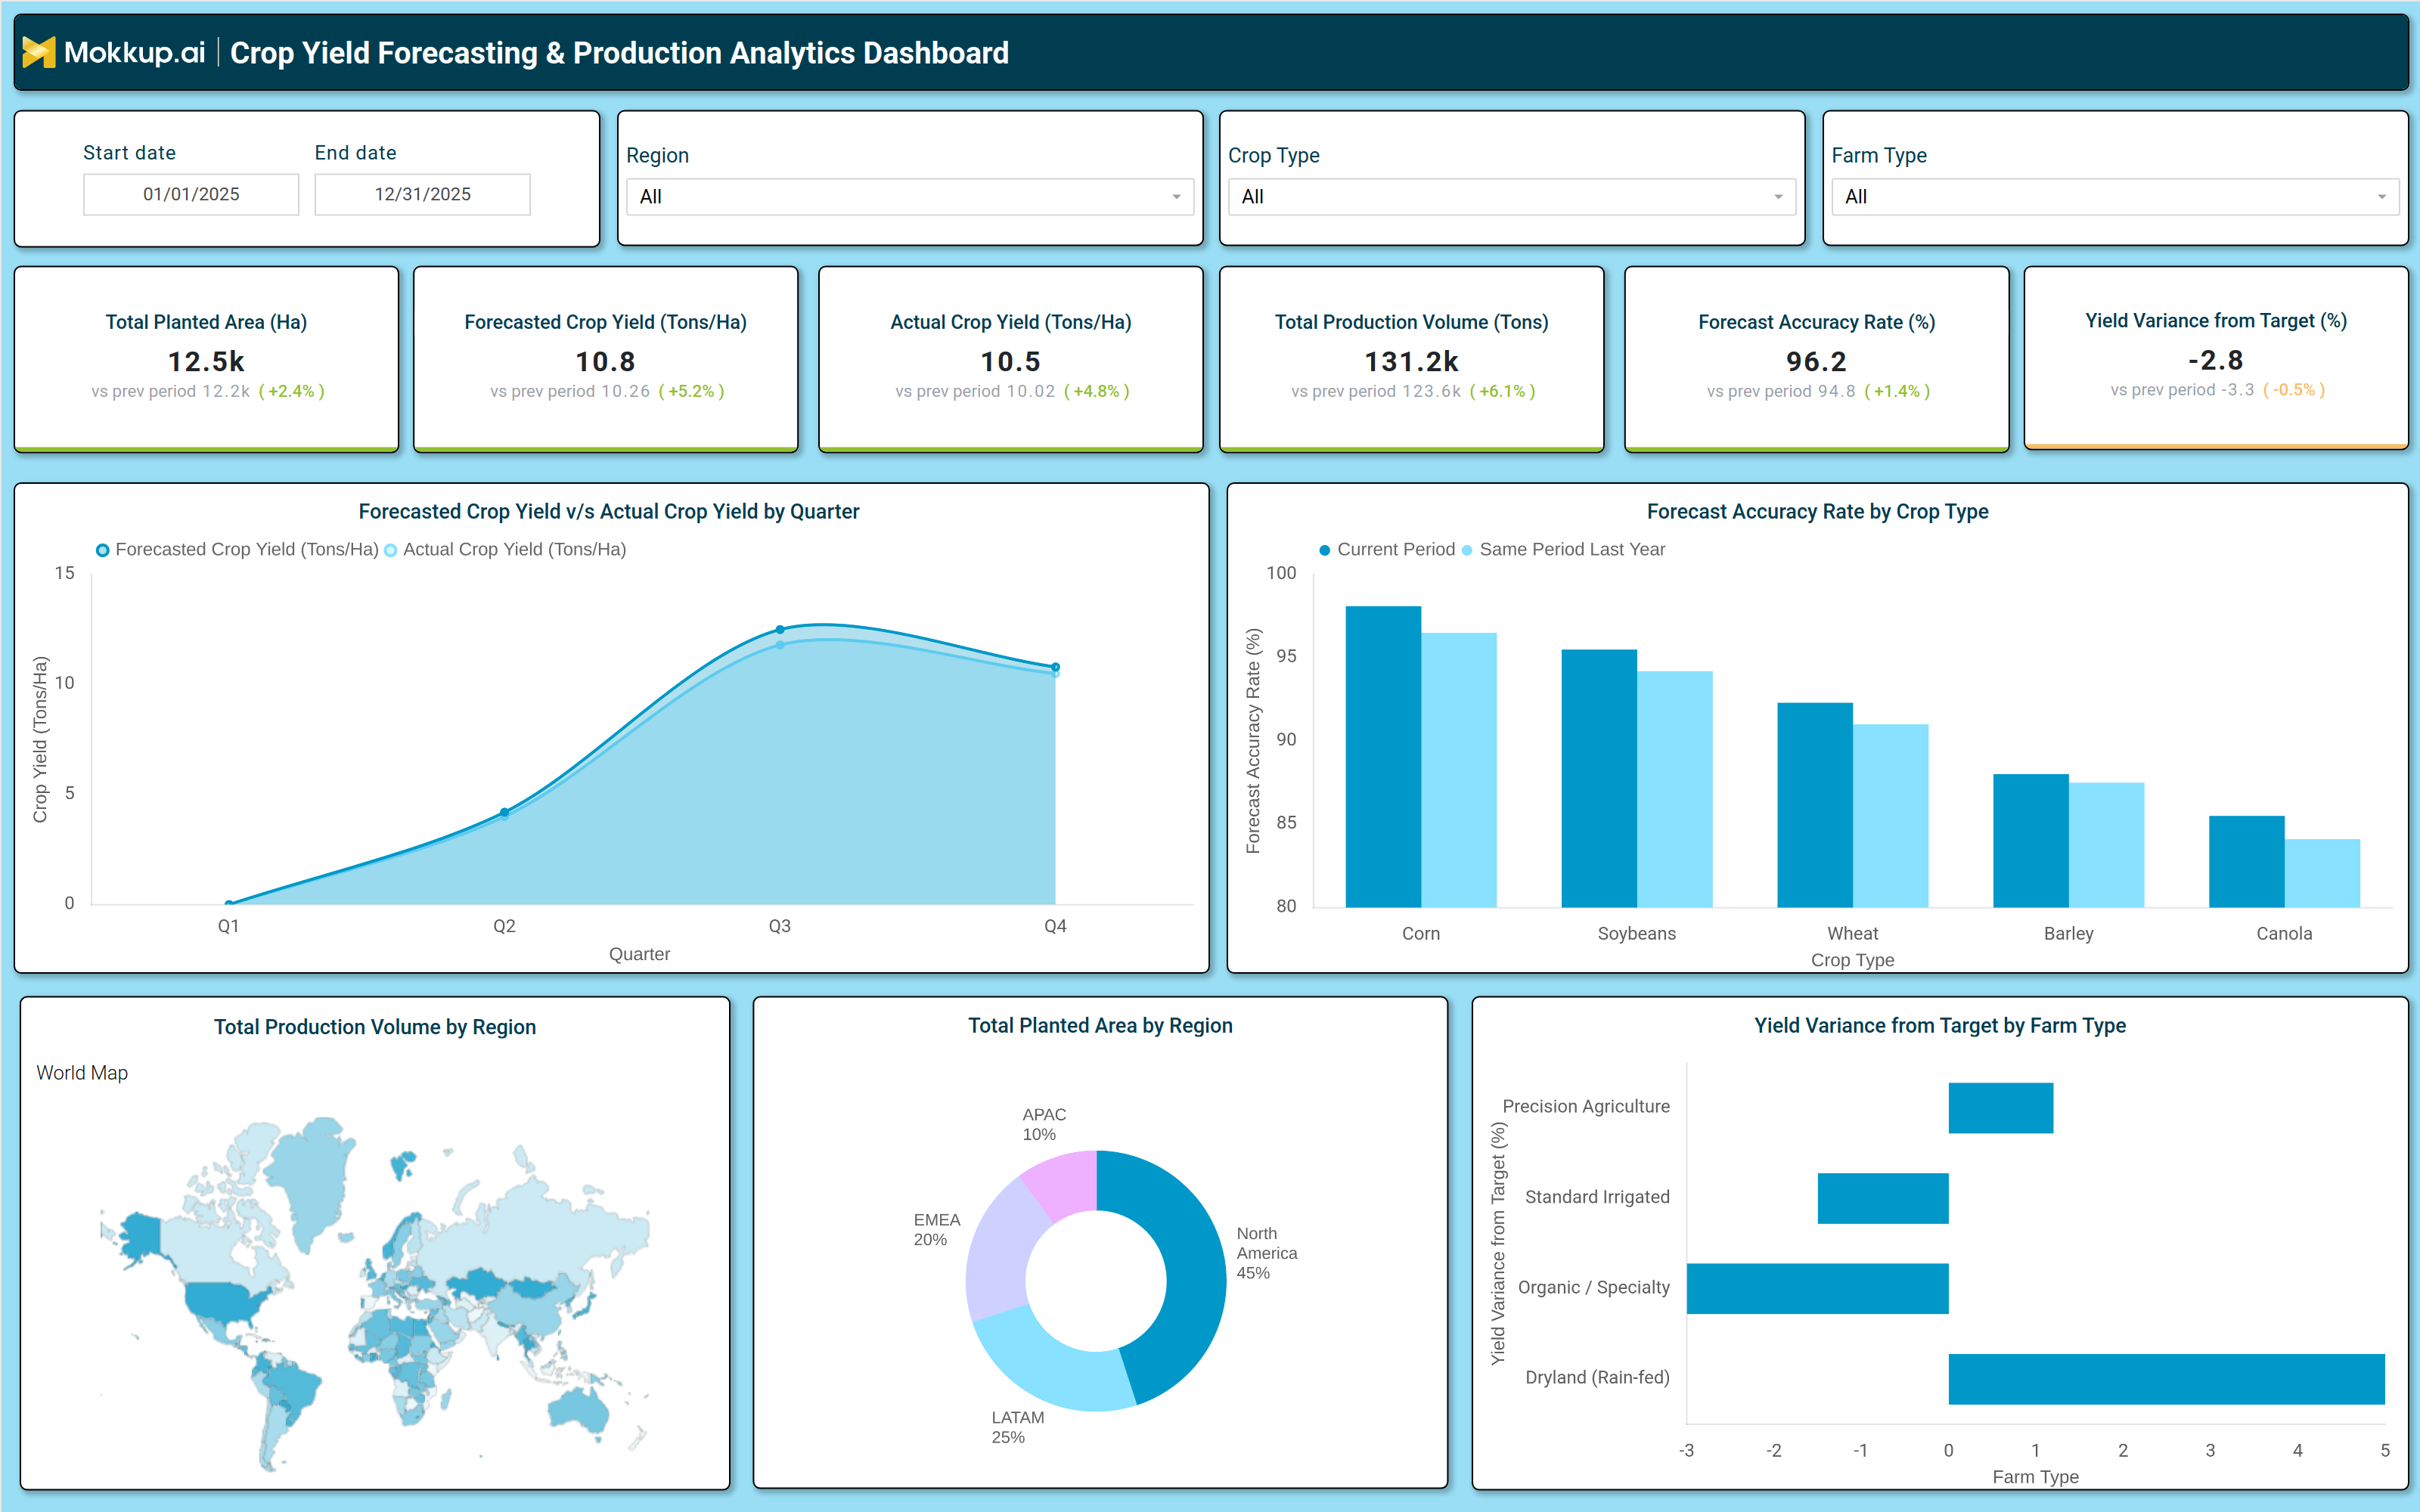
A typical crop yield forecasting dashboard includes interactive filters for date ranges, crop types (e.g., corn, soybeans, wheat, barley, canola), regions (North America, APAC, EMEA, LATAM), and farm types (precision agriculture, standard irrigated, organic/specialty, dryland). Key performance tiles display total planted area (hectares), forecasted crop yield (tons/ha), actual crop yield (tons/ha), total production volume (tons), forecast accuracy rate (%), and yield variance from target (%). Trend charts compare forecasted vs. actual crop yields by quarter (Q1–Q4), helping farmers detect seasonal discrepancies. A bar chart breaks down forecast accuracy rate by crop type, revealing which crops have the most reliable predictions. A geographic heatmap visualizes total production volume by region (APAC, EMEA, LATAM, North America), while a second map or pie chart shows the distribution of total planted area across regions. A bar chart analyzes yield variance from target by farm type, showing how precision agriculture outperforms standard irrigated, organic, and dryland methods. Together, these components form an agricultural yield-optimization dashboard that enables data-driven decisions for planting, irrigation, and harvest.
How to Analyze Data in a Crop Yield Forecasting & Production Analytics Dashboard
Here is how you can analyze data from this precision farming analytics dashboard:
- Compare Forecasted vs. Actual Yields: Assess prediction accuracy by comparing projected crop yields against actual production outcomes.
- Analyze Yield Trends by Quarter: Identify seasonal patterns and production variations across different quarters to support better planning.
- Evaluate Regional Production Differences: Compare yield performance across regions to optimize resource allocation and improve operational efficiency.
- Track Forecast Accuracy by Crop Type: Monitor prediction performance for different crops to refine forecasting models and improve reliability.
- Monitor Yield Variance from Targets: Measure deviations from yield targets to identify areas requiring adjustments in farming practices.
- Assess Total Production Volume Trends: Analyze overall production trends to support storage planning, inventory management, and sales forecasting.
- Review Planted Area Changes: Track changes in cultivated land area to understand land utilization efficiency and expansion patterns.
- Use Farm-Type Comparisons for Benchmarking: Compare performance across different farming methods and farm types to identify best practices and optimization opportunities.
Benefits of a Crop Yield Forecasting & Production Analytics Dashboard
The following are the benefits of using this dashboard:
- Improves Yield Prediction Accuracy: Uses AI-driven analytics to generate more accurate crop yield forecasts and improve agricultural planning.
- Enhances Farm Profitability: Optimizes the use of resources such as water, fertilizers, and labor to increase operational efficiency and profitability.
- Supports Data-Driven Decision-Making: Provides actionable insights for better planning of planting, harvesting, and crop management activities.
- Reduces Waste and Overproduction: Aligns production planning with market demand to minimize crop waste and improve supply efficiency.
- Enables Better Risk Management: Tracks weather conditions, soil health, and environmental factors to help mitigate agricultural risks.
- Streamlines Supply Chain Planning: Improves inventory, storage, and distribution planning with accurate production and yield forecasts.
- Supports Precision Agriculture Adoption: Helps farmers implement precision agriculture techniques to improve productivity, sustainability, and resource efficiency.
KPIs to Track in a Crop Yield Forecasting & Production Analytics Dashboard
The following key KPIs can be tracked by using this dashboard:
- Total Planted Area (Hectares) – Measures land utilization efficiency.
- Forecasted Crop Yield (Tons/Ha) – Predicts expected harvest output.
- Actual Crop Yield (Tons/Ha) – Tracks real harvest results.
- Total Production Volume (Tons) – Indicates overall farm output.
- Forecast Accuracy Rate (%) – Evaluates prediction precision.
- Yield Variance from Target (%) – Identifies gaps between expected and actual yields.
Frequently Asked Questions
1. Who should use a crop yield forecasting dashboard?
Farmers, agricultural consultants, agribusinesses, and researchers benefit from using this tool for better decision-making.
2. What data sources feed into the production analytics dashboard for agriculture?
Common data sources include satellite imagery, weather stations, soil sensors, farm management software, and historical yield records.
3. How does a forecast accuracy monitoring dashboard help learning?
AI analyzes historical data, weather patterns, and soil conditions to generate accurate yield predictions, reducing guesswork in farming.