What is a Power Project Progress Dashboard?
A Power Project Progress Dashboard is a specialized project management and monitoring tool that provides real-time visibility into power and utility infrastructure projects. It helps project teams track performance across multiple sites, packages, and construction phases, enabling better planning, budget control, and timely execution.
This utility project tracking dashboard is handy for engineering and project management teams overseeing power transmission, substation, or grid infrastructure projects. It consolidates key information such as construction progress, phase-wise completion, workforce activity, and budget utilization in one unified interface.
By integrating data from various contractors and sites, the power infrastructure project status dashboard allows decision-makers to identify bottlenecks early, optimize resources, and ensure alignment with timelines and regulatory commitments.
How to Create a Power Project Progress Dashboard
You don’t need to build your report from scratch—just start with a ready-to-use dashboard template from Mokkup. Add in your data and export it however you like. Here’s how to do it:
1. Create or Log in to Your Mokkup Account
Start by signing up on Mokkup.ai using your email. If you already have an account, just log in, and you’ll be good to go.
2. Choose and Customize Your Dashboard Template
Find the Power Project Progress Dashboard template in the Templates section. Use the drag-and-drop editor to adjust KPIs, edit filters, or add elements based on your data.
3. Export to Your BI Tool
Once your dashboard wireframe is ready, use the BI Tool Export feature to send it directly to Power BI or Tableau for further analysis and enhancements. You can also download the dashboard as a PDF, PNG, or JPEG, embed it on a platform, or invite your team to collaborate.
Note: This is a Pro template. You’ll need a Pro subscription on Mokkup to use and customize this dashboard wireframe. Upgrade anytime to unlock full access.
Power Project Progress Dashboard Example
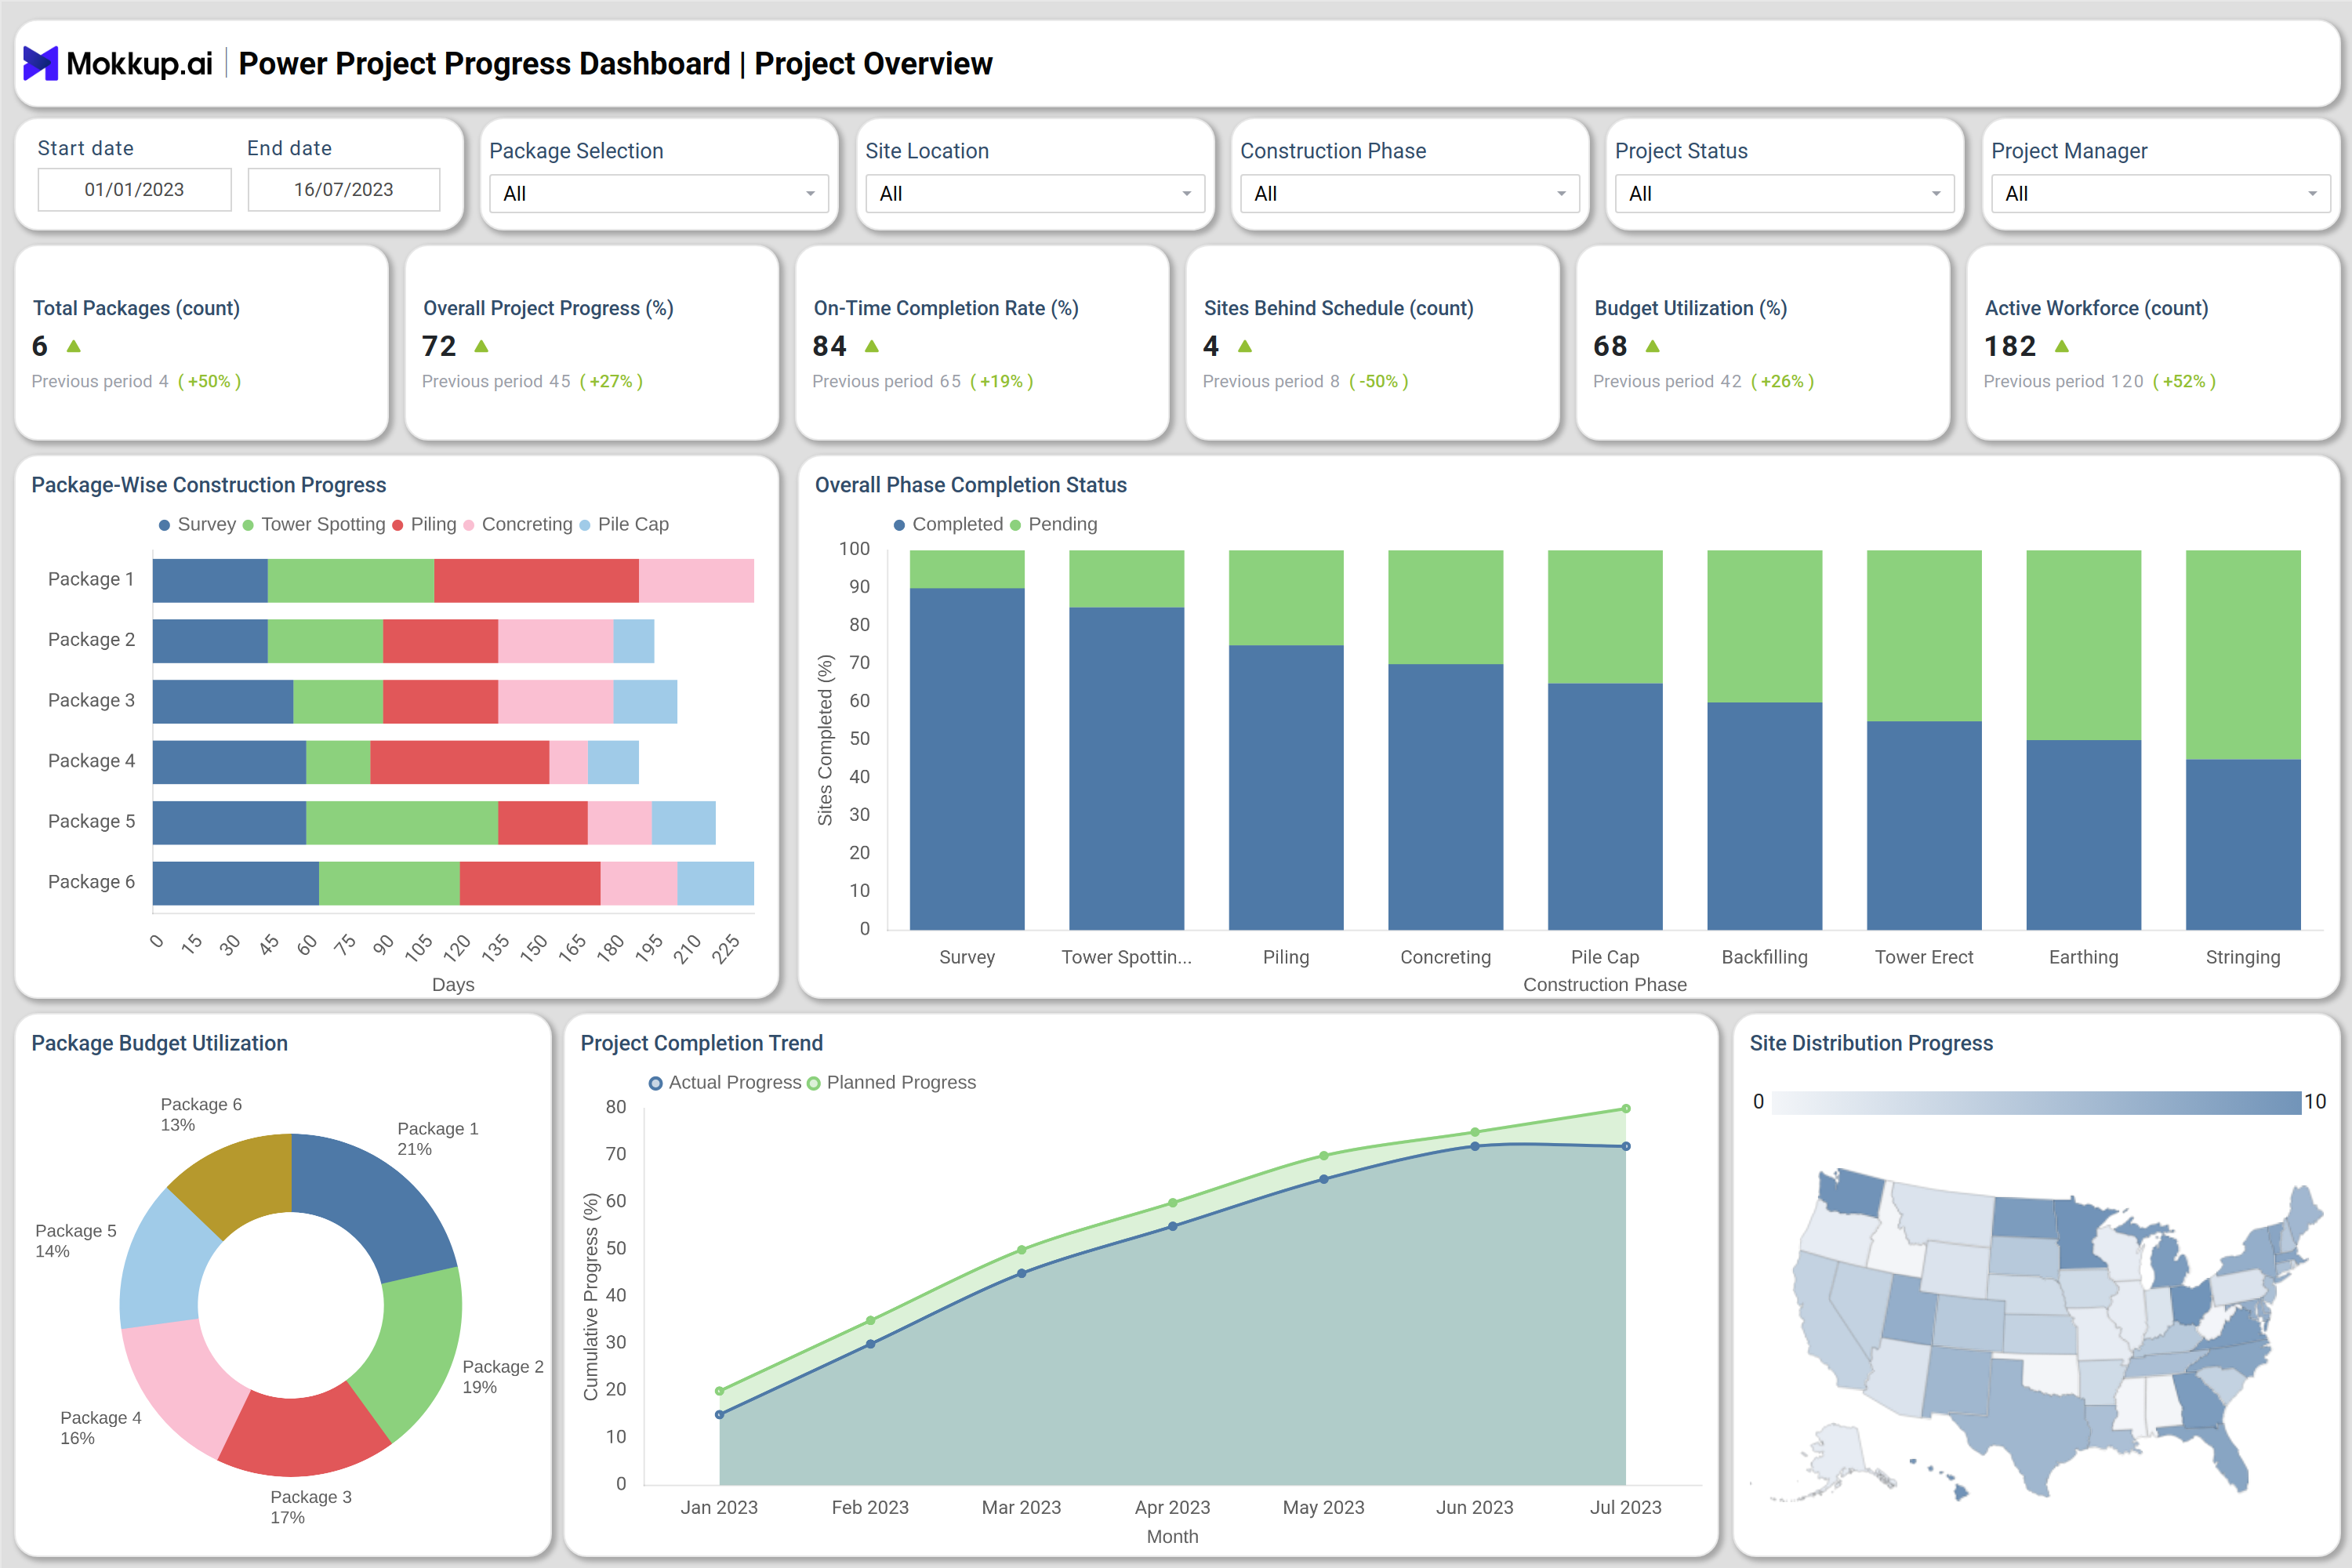
You can create your own Power Project Progress Dashboard to manage large-scale infrastructure developments more effectively. The dashboard is structured into two main views — Project Overview & Package Performance and Site-Level Phase Tracking — offering both executive-level summaries and operational insights.
The Project Overview & Package Performance screen gives a high-level snapshot of overall progress across all six project packages. Key indicators such as overall completion percentage, budget utilization, and on-time completion rate help assess construction efficiency and resource allocation. Visuals, such as stacked bar charts, phase completion comparisons, and package-wise budget utilization, help identify areas where delays or overspending may occur.
The Site-Level and Phase-Wise Tracking screen focuses on drill-down analysis for each package and its five sites. It provides metrics such as site completion percentage, workforce deployment, average delay, and resource utilization. Visual elements, such as Gantt charts, workforce trend lines, and material usage charts, help managers track on-the-ground activities.
Together, these visuals make the energy project progress analytics tool a complete monitoring system that supports both strategic reporting and day-to-day project supervision.
How to Analyze Data in Power Project Progress Dashboard
Here’s how you can use the dashboard for practical analysis and decision-making:
- Review overall project performance: Monitor completion percentages, budget utilization, and workforce deployment across all packages.
- Identify underperforming sites: Use visual comparisons to detect delayed or low-progress sites and address causes proactively.
- Track budget efficiency: Analyze spending trends using package-wise budget utilization visuals to ensure optimal resource allocation.
- Monitor construction phases: Review the status of critical activities, such as tower erection, concreting, and foundation work, to ensure deadlines are met.
- Compare planned vs actual timelines: Assess deviations using cumulative progress trends and Gantt charts for each construction phase.
- Evaluate regional and contractor performance: Track site distribution and package-level completion to measure performance across teams and regions.
- Optimize workforce planning: Analyze labor and support staff deployment patterns to balance workloads effectively.
Benefits of Power Project Progress Dashboard
Implementing a power project performance monitoring dashboard delivers multiple benefits for project teams and stakeholders:
- Centralized project visibility: Consolidates all site-level and package-level data into one visual platform for easier project tracking.
- Improved on-time delivery: Real-time monitoring helps identify schedule delays early and improve completion rates.
- Budget control: Enables accurate tracking of resource consumption, material usage, and financial spending against the project plan.
- Enhanced workforce management: Helps optimize crew allocation by analyzing active labor trends and performance across sites.
- Transparency in reporting: Simplifies communication between project teams, contractors, and stakeholders with real-time data visualization.
- Reduced delays and risks: Early detection of underperforming phases ensures timely intervention and risk mitigation.
- Data-driven decision making: Combines analytics, KPIs, and trend data to improve overall project control and execution quality.
KPIs to Track in Power Project Progress Dashboard
The following KPIs define the operational and strategic value of a utility project tracking dashboard:
- Overall Project Progress (%) – Tracks the total completion rate of all ongoing packages to know project progress as a whole.
- On-Time Completion Rate (%) – Measures adherence to project timelines.
- Budget Utilization (%) – Indicates how much of the allocated budget has been spent versus planned.
- Active Workforce Count – Monitors manpower deployed across all sites.
- Average Site Completion (%) – Reflects construction progress across sites within a selected package.
- Average Project Delay (Days) – Calculates the average lag in task or phase completion.
- Material Consumption (tons/units) – Tracks usage of key materials like concrete and steel.
- Critical Phase Analysis (%) – Identifies stages causing maximum delay or effort (e.g., tower erection, foundation).
- Workforce Deployment by Month – Shows labor and support staff trends over time.
- Completed Sites Count – Provides quick visibility into the number of completed versus in-progress sites.
Frequently Asked Questions
1. What is the main purpose of a Power Project Progress Dashboard?
It is used to track construction progress, monitor performance, and ensure project milestones are completed on time within budget.
2. Who uses this dashboard?
Project managers, engineers, contractors, and utility company executives rely on it for performance tracking and reporting.
3. Can the dashboard be customized?
Yes. It can be tailored for various project types, including transmission lines, substations, and renewable energy sites.
4. How does it help with compliance?
The dashboard monitors deadlines, safety compliance, and resource standards, ensuring adherence to project and regulatory benchmarks.