What is a Coal Power Generation R&D Dashboard?
A Coal Power Generation R&D Dashboard is a specialized analytics platform designed to monitor, evaluate, and optimize research and operational inventory within the coal power sector. It consolidates data from various innovation streams—such as carbon capture, emissions reduction, and advanced materials—to help R&D managers and executives track investment efficiency, project progress, and technological commercialization. This energy innovation analytics tool enables stakeholders to analyze budgets, project pipelines, and collaboration efforts, driving data-driven decisions to enhance the efficiency and environmental performance of coal power technologies.
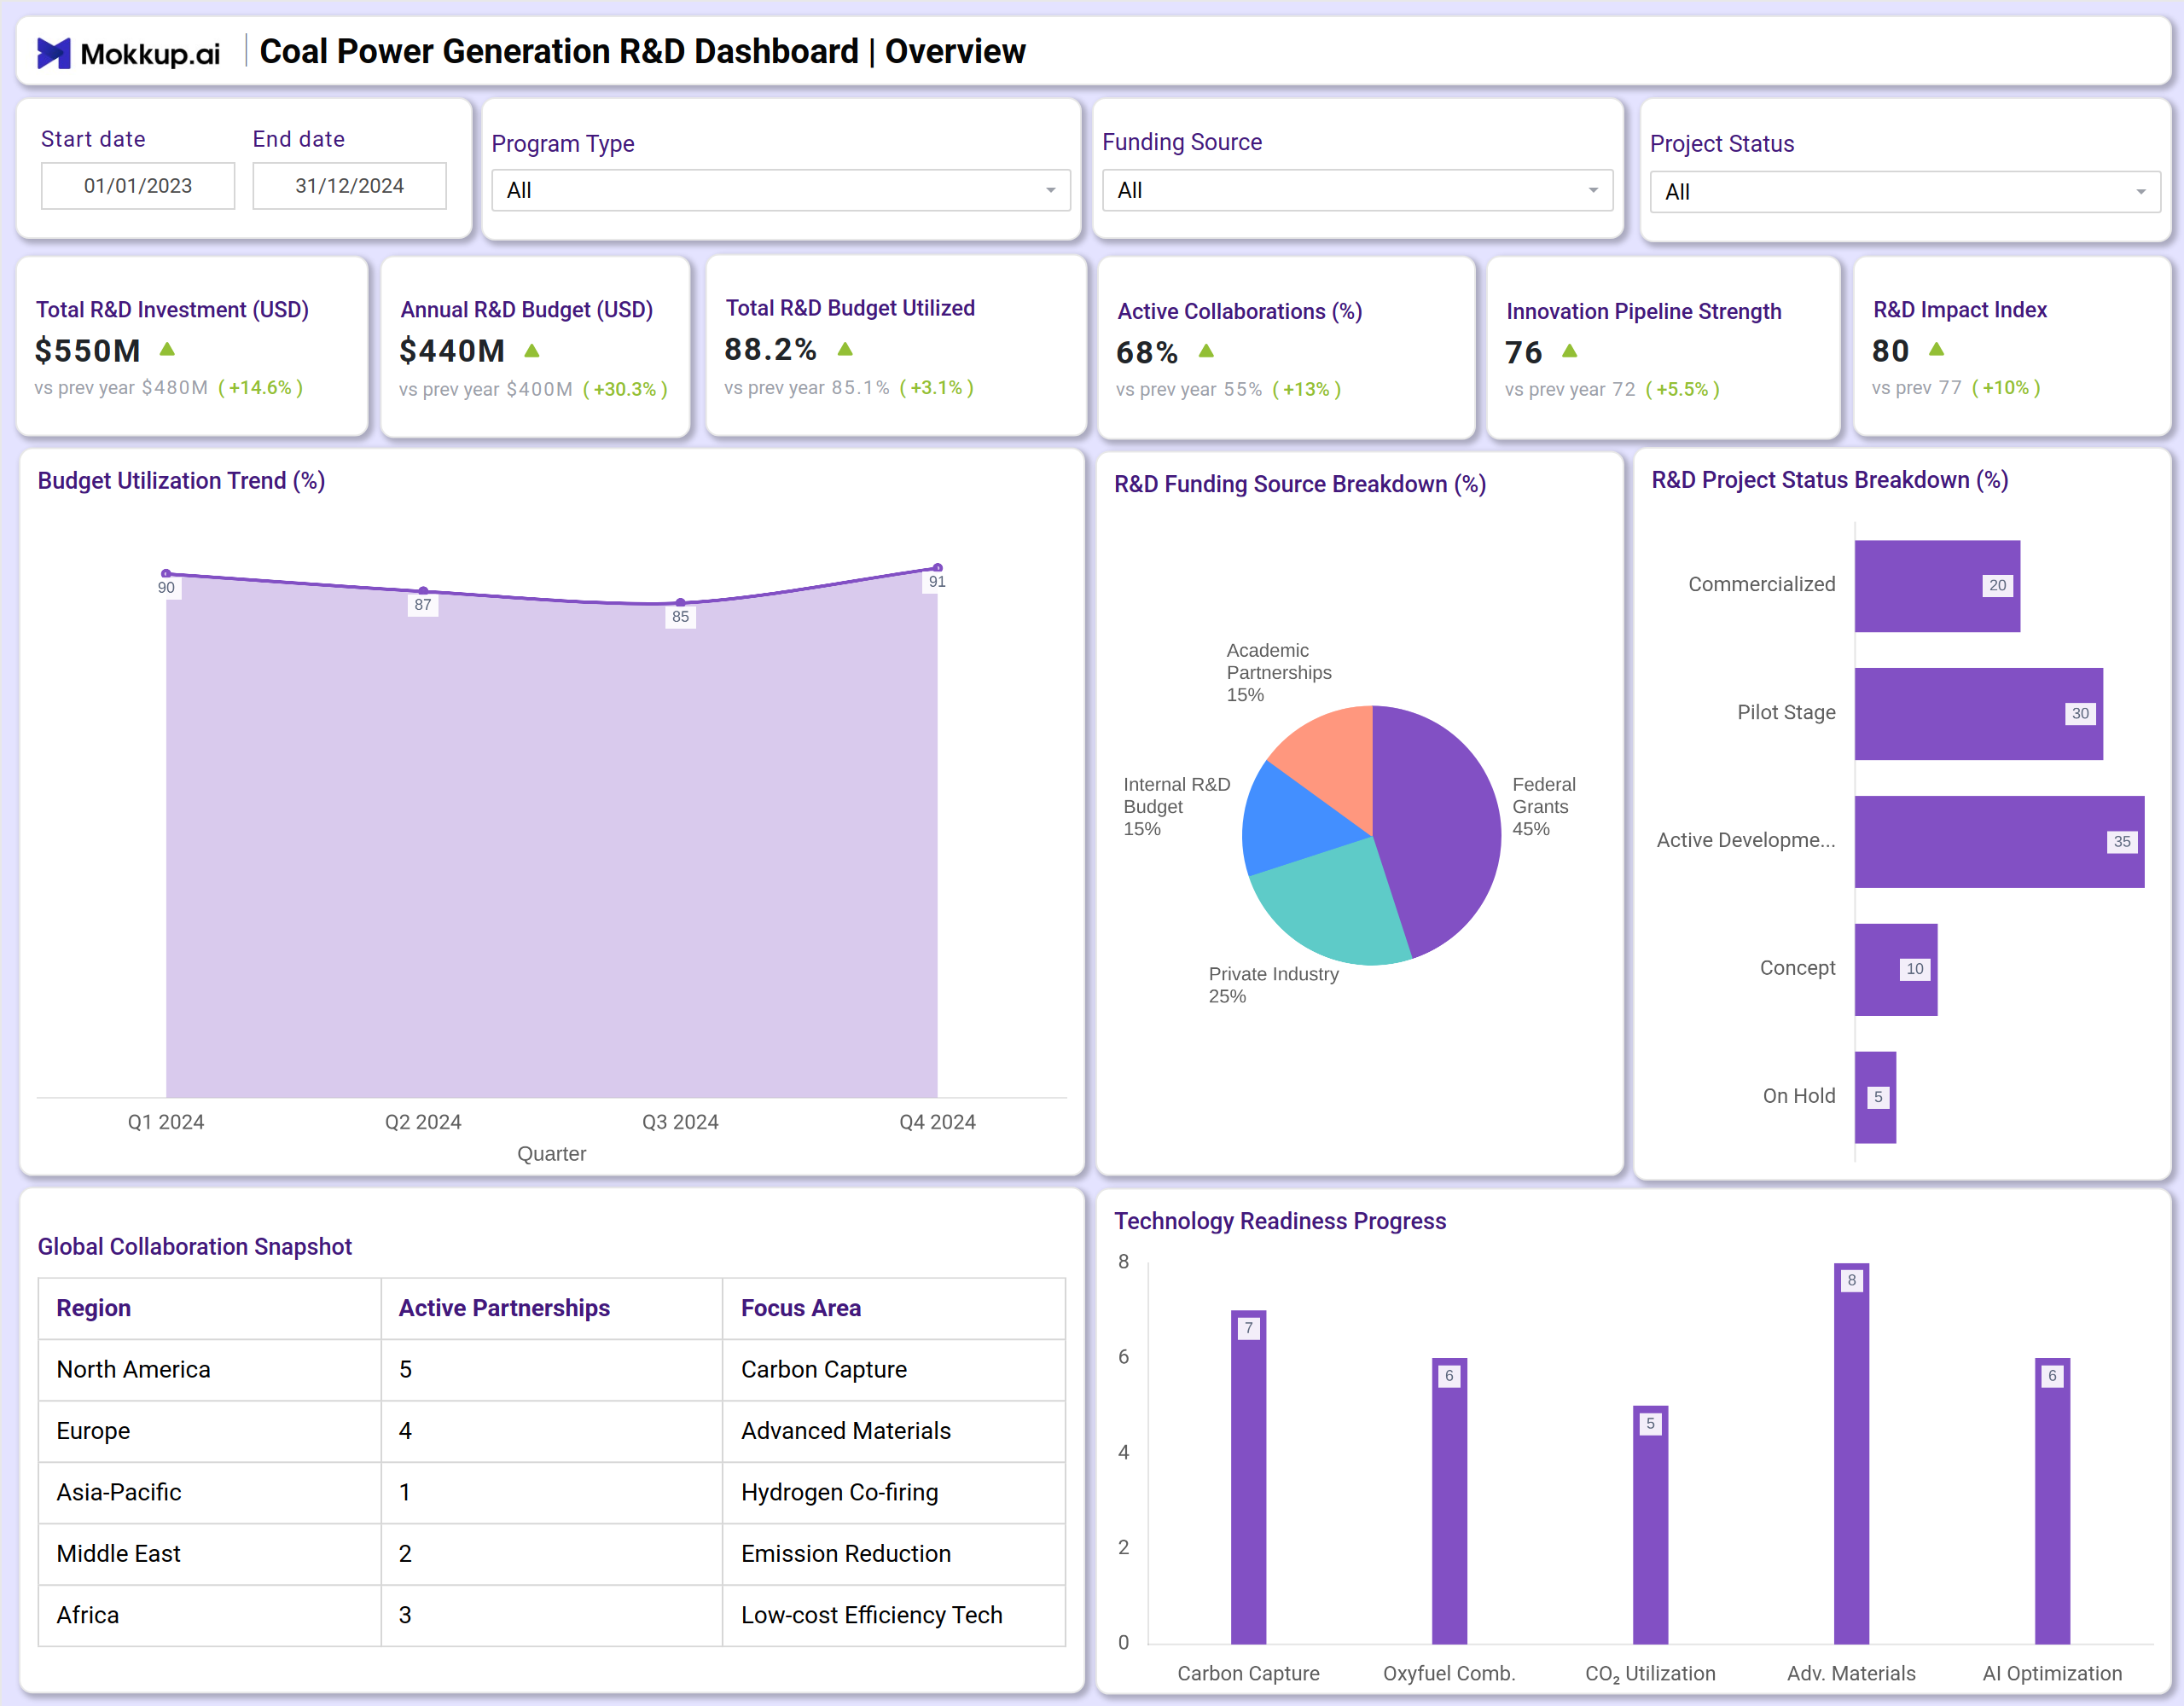
The dashboard provides detailed insights into budget utilization, project completion rates, efficiency gains, and technology readiness levels, supporting strategic planning and funding allocation in energy R&D.
How to Create a Coal Power Generation R&D Dashboard
You don’t need to build your report from scratch—just start with a ready-to-use dashboard template from Mokkup. Add in your data and export it however you like. Here’s how to do it:
1. Create or Log in to Your Mokkup Account
Start by signing up on Mokkup.ai using your email. If you already have an account, just log in, and you’ll be good to go.
2. Choose and Customize Your Dashboard Template
Find the Coal Power Generation R&D Dashboard template in the Templates section. Use the drag-and-drop editor to adjust KPIs, edit filters, or add elements based on your data.
3. Export to Your BI Tool
Once your dashboard wireframe is ready, use the BI Tool Export feature to send it directly to Power BI or Tableau for further analysis and enhancements. You can also download the dashboard as a PDF, PNG, or JPEG, embed it on a platform, or invite your team to collaborate.
Note: This is a Pro template. You’ll need a Pro subscription on Mokkup to use and customize this dashboard wireframe. Upgrade anytime to unlock full access.
Coal Power Generation R&D Dashboard Example
You can create a coal power innovation tracking dashboard that integrates multiple R&D functions and funding sources.
The R&D Overview Dashboard visualizes key financial and strategic metrics, including total R&D investment, budget utilization, active collaborations, and the R&D impact index. It enables executives to evaluate the overall health and return on investment of the innovation portfolio.
The Innovation Progress Dashboard focuses on project-level performance, including project completion rate, efficiency gains, technology commercialization rate, and emissions avoided. This view supports R&D managers in tracking development stages, budget allocation across technology categories, and the cost-effectiveness of carbon capture technologies.
Together, these dashboards act as a unified energy R&D performance tracking system, helping organizations accelerate the development of cleaner, more efficient coal power technologies and demonstrate tangible progress towards sustainability goals.
How to Analyze Data in a Coal Power Generation R&D Dashboard
Here’s how plant operators and managers can leverage the dashboard:
- Monitor R&D Financial Health: Track total investment, budget utilization, and funding source breakdown to ensure optimal resource allocation.
- Evaluate Project Portfolio Progress: Review project completion rates, active project counts, and development stages to manage the innovation pipeline.
- Track Technological and Efficiency Outcomes: Measure efficiency gains, emissions avoided, and commercialization rates to quantify R&D impact.
- Assess Collaboration Effectiveness: Analyze the ratio of cross-functional projects and active global partnerships to foster innovation synergy.
- Benchmark Carbon Capture Initiatives: Compare the cost per ton of CO₂ across different capture technologies to guide future research focus.
- Monitor Technology Readiness: Visualize the progression of projects from concept to commercialization to identify bottlenecks.
- Visualize Trends with Dashboards: Use coal power R&D data visualization to uncover improvement areas through charts, trends, and KPIs.
Benefits of a Coal Power Generation R&D Dashboard
- Streamlined R&D Management: Centralizes all coal power innovation projects and financial data for better oversight and coordination.
- Improved Investment Efficiency: Highlights budget utilization and allocation effectiveness, maximizing the return on R&D expenditure.
- Accelerated Innovation Cycle: Tracks project stages and commercialization rates to help reduce time-to-market for new technologies.
- Informed Strategic Planning: Provides insights into technology trends and collaboration networks for data-driven R&D strategy.
- Enhanced Environmental Accountability: Quantifies emissions reductions and efficiency gains to demonstrate commitment to sustainable innovation.
- Data-Driven Partnership Decisions: Empowers managers with analytics on global collaborations and cross-functional project success.
- Supports Funding Justification: Offers clear, visual evidence of progress and impact to secure ongoing internal and external funding.
KPIs to Track in a Coal Power Generation R&D Dashboard
- Total R&D Investment (USD) – The total amount of capital invested in R&D initiatives.
- R&D Budget Utilized (%) – The percentage of the allocated annual R&D budget that has been spent.
- Project Completion Rate (%) – The percentage of R&D projects completed against the total.
- Efficiency Gain (%) – The percentage improvement in power generation efficiency achieved through R&D.
- Technology Commercialization Rate (%) – The percentage of R&D projects that have successfully reached commercial deployment.
- Emissions Avoided (tons CO₂) – The total reduction in CO₂ emissions attributable to R&D outcomes.
- Active R&D Projects (count) – The number of projects currently in the development pipeline.
- Cross-Functional Project Ratio (%) – The percentage of projects involving multiple departments or disciplines.
Frequently Asked Questions
1. What is the main purpose of a Coal Power Generation R&D Dashboard?
It provides a centralized system to monitor R&D investment, project progress, innovation outcomes, and their impact on efficiency and emissions in coal power generation.
2. How does an energy innovation analytics tool support R&D teams?
It offers visibility into project timelines, budget status, technology readiness, and collaboration effectiveness, improving coordination and accelerating innovation.
3. Who can use the energy R&D performance tracking system?
R&D Directors, Innovation Managers, Chief Technology Officers, and Sustainability Executives can use it for strategic, operational, and reporting purposes.