
What is a CNG Station Systems & Digital Monitoring Dashboard?
A CNG Station Systems & Digital Monitoring Dashboard template is a comprehensive visualization platform designed to monitor, analyze, and optimize the operational performance of Compressed Natural Gas (CNG) fueling stations through digital monitoring of critical systems. It consolidates essential operational metrics including SCADA uptime, station connectivity, system alerts, average response time, station downtime, and total station count into a unified, real-time interface.
By integrating CNG station SCADA monitoring, digital infrastructure performance tracking, alert management systems, and downtime root cause analysis, this dashboard enables station operators, maintenance teams, control room engineers, and distribution leadership to ensure reliable station operations, minimize downtime, optimize maintenance responses, and enhance overall network performance. It serves as a central command center for proactive monitoring and management of CNG fueling infrastructure.
How to Create a CNG Station Systems & Digital Monitoring Dashboard
You don’t need to build your report from scratch—just start with a ready-to-use CNG Station Systems & Digital Monitoring dashboard template from Mokkup. Add in your data and export it however you like. Here’s how to do it:
1. Create or Log in to Your Mokkup Account
Start by signing up on Mokkup.ai using your email. If you already have an account, just log in, and you’ll be good to go.
2. Choose and Customize Your Dashboard Template
Find the CNG Station Systems & Digital Monitoring template in the Templates section. Use the drag-and-drop editor to adjust KPIs, edit filters, or add elements based on your data.
3. Export to Your BI Tool
Once your dashboard wireframe is ready, use the BI Tool Export feature to send it directly to Power BI or Tableau for further analysis and enhancements. You can also download the dashboard as a PDF, PNG, or JPEG, embed it on a platform, or invite your team to collaborate.
Note: This is a Pro template. You’ll need a Pro subscription on Mokkup to use and customize this dashboard wireframe. Upgrade anytime to unlock full access.
CNG Station Systems & Digital Monitoring Dashboard Example
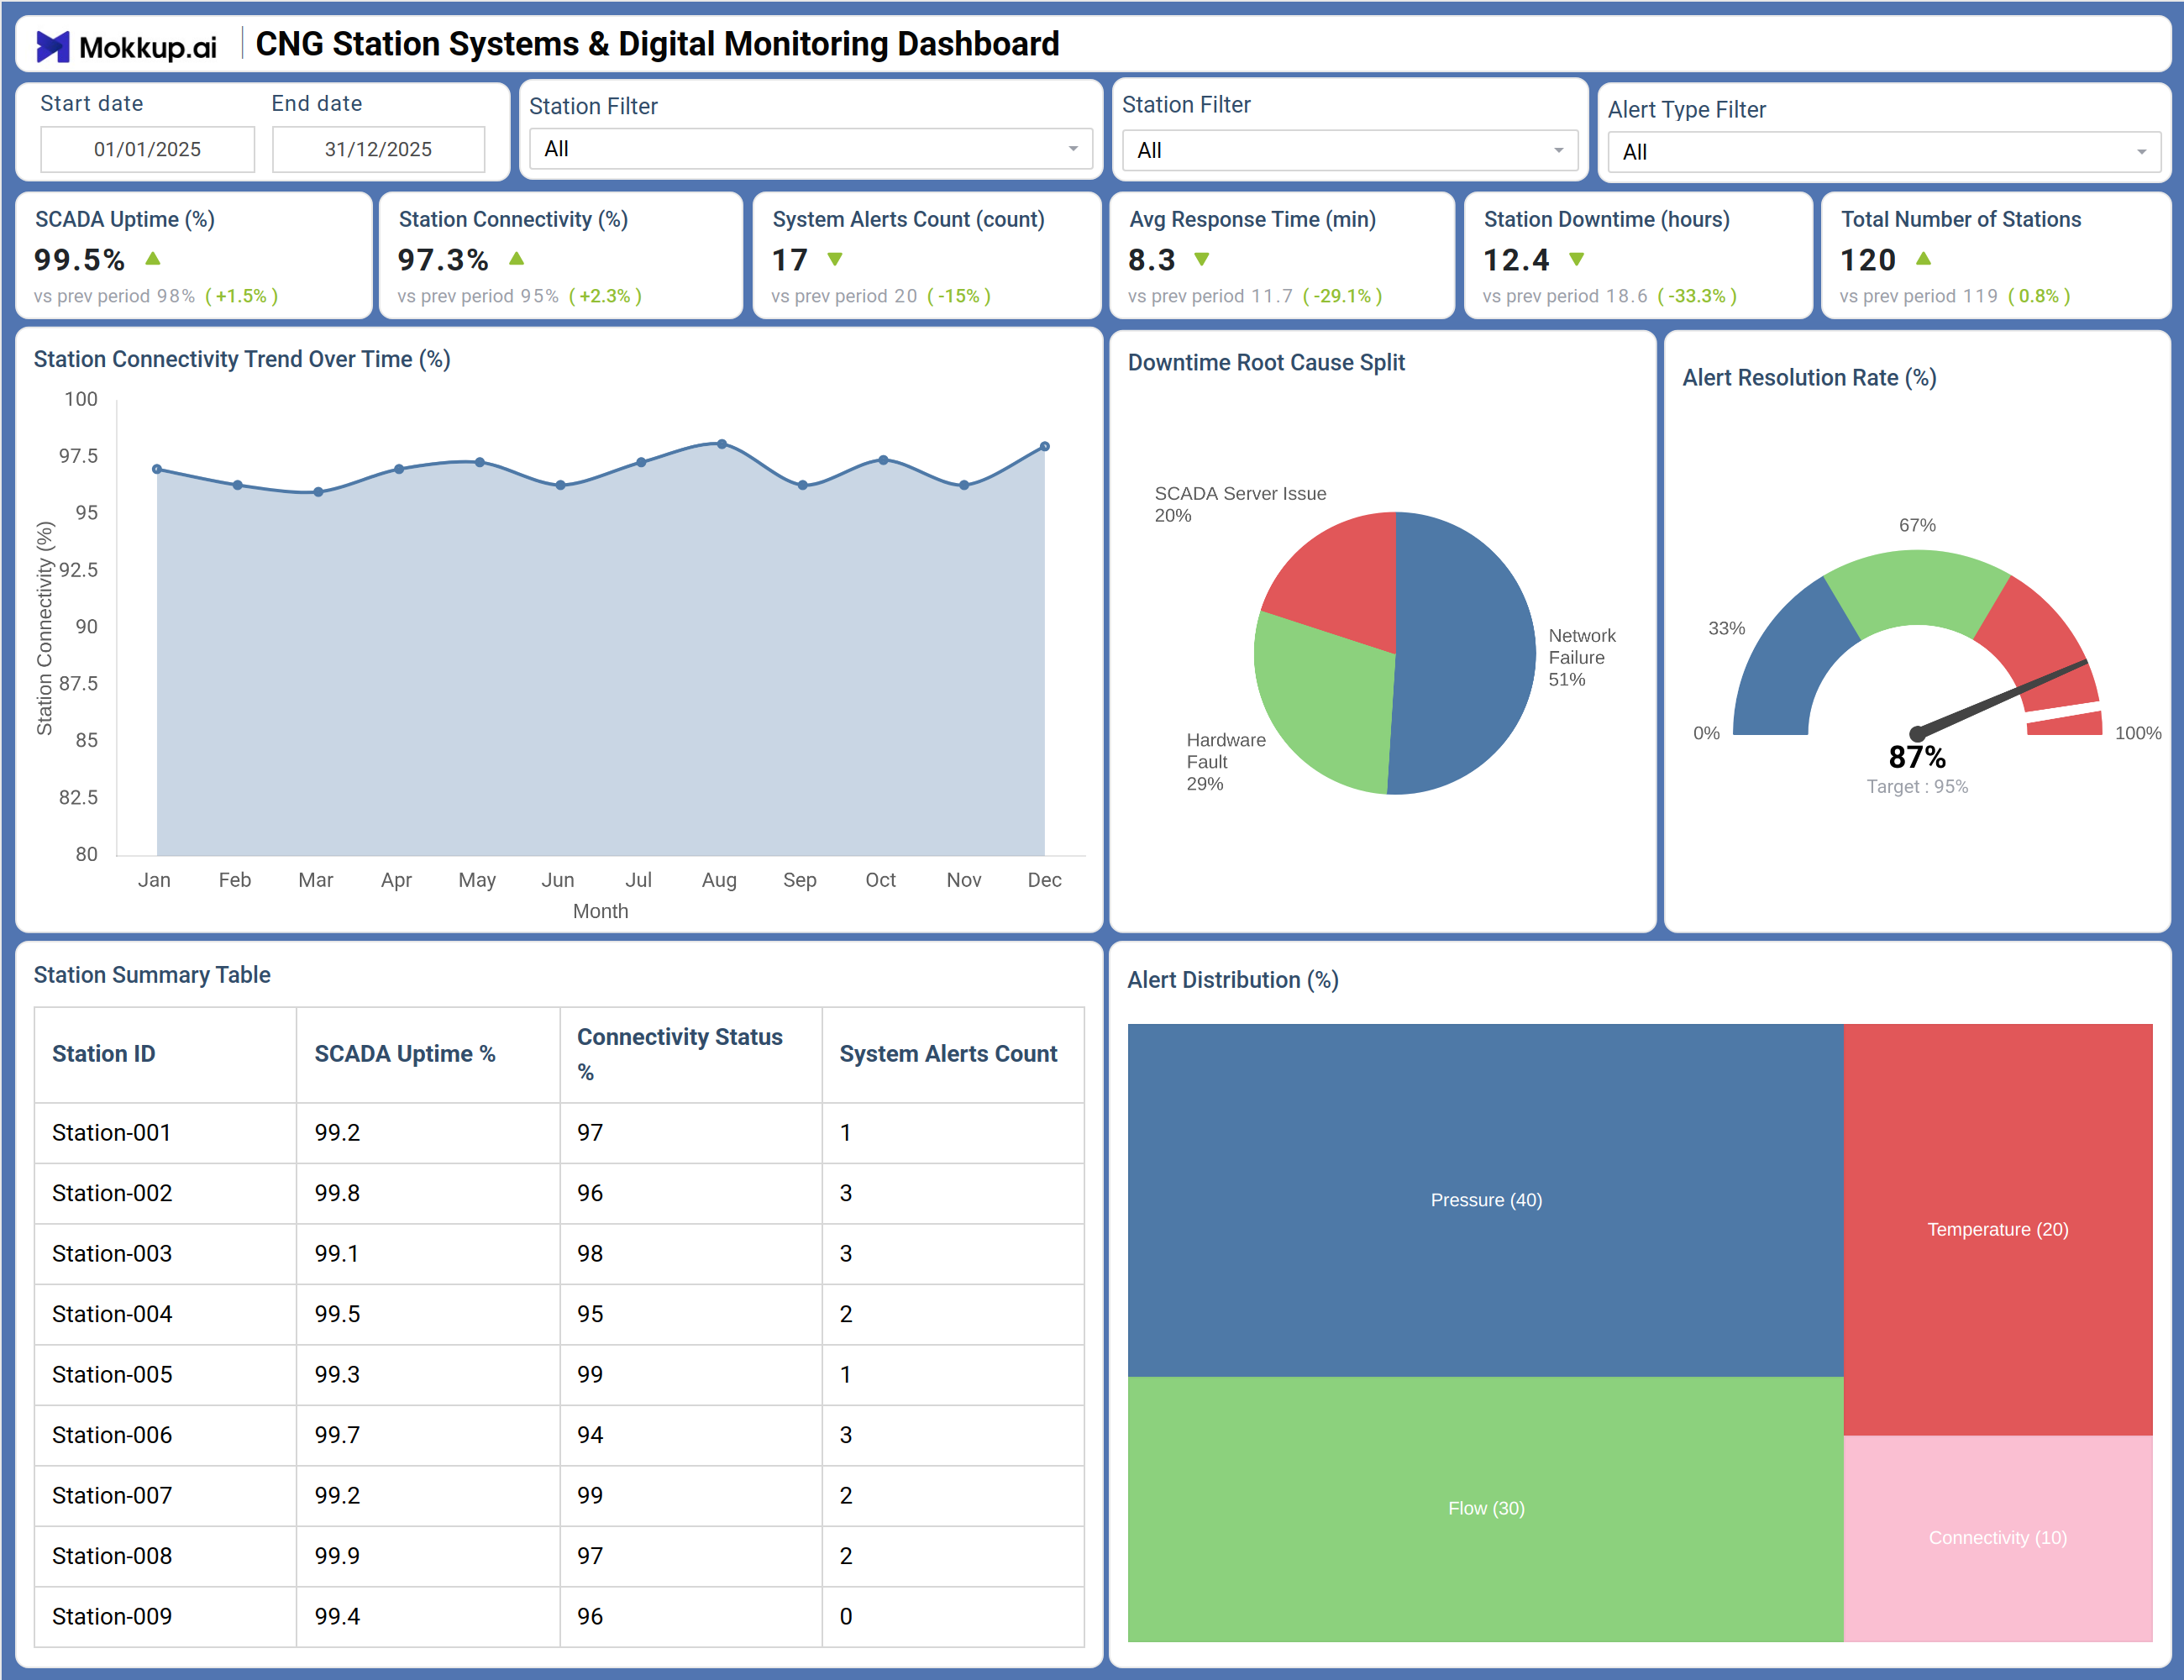
This dashboard delivers a comprehensive view of CNG station systems performance and digital monitoring effectiveness across the network. The Overview screen prominently displays six critical operational KPIs with trend indicators: SCADA Uptime at 99.5% (up 1.5% from prior period), Station Connectivity at 97.3% (2.3% improvement), System Alerts reduced to 17 (15% decrease), Average Response Time improved to 8.3 minutes (29.1% faster), Station Downtime reduced to 12.4 hours (33.3% improvement), and Total Number of Stations at 120 (0.8% network growth).
The Station Connectivity Trend Over Time (%) chart tracks monthly connectivity performance, revealing patterns and identifying periods of degradation requiring attention. Downtime Root Cause Split provides detailed analysis of downtime causes including SCADA Server Issues, with breakdowns for Hardware Fault (29%), Network Failure (51%), and Software Fault (67%)—enabling targeted infrastructure investments. Alert Distribution (%) shows the breakdown of system alerts by type: Pressure (40%), Temperature (20%), Flow (30%), and Connectivity (10%), helping prioritize monitoring and response resources. Alert Resolution Rate dual gauge displays current resolution rate at 87% against a 95% target, highlighting opportunities for improvement.
The Station Summary Table lists individual stations with key metrics including Station ID, SCADA Uptime %, Connectivity Status, and System Alerts Count—enabling rapid identification of underperforming stations. Stations such as Station-001 (99.2% uptime, 97% connectivity), Station-008 (99.9% uptime, 97% connectivity), and Station-006 (99.7% uptime, 94% connectivity) provide granular visibility for targeted interventions. Together, these components enable CNG station SCADA monitoring, digital infrastructure performance optimization, and data-driven maintenance decision-making.
How to Analyze Data in a CNG Station Systems & Digital Monitoring Dashboard
Here is how you can analyze data from this dashboard:
- SCADA Reliability Monitoring: Monitor SCADA Uptime (%) to ensure control and monitoring systems remain reliable across all stations.
- Connectivity Performance Tracking: Track Station Connectivity (%) over time to detect communication infrastructure issues.
- Alert Volume Assessment: Review System Alerts (count) to understand network health and prioritize response actions.
- Response Efficiency Analysis: Analyze Average Response Time (minutes) to evaluate maintenance and support team efficiency.
- Downtime Impact Review: Examine Station Downtime (hours) to quantify operational losses and prioritize reliability improvements.
- Network Scale Evaluation: Evaluate Total Number of Stations to understand network size and expansion trends.
- Connectivity Trend Analysis: Use Station Connectivity Trend to correlate connectivity dips with weather, infrastructure changes, or carrier issues.
- Downtime Root Cause Identification: Drill into Downtime Root Cause Split to allocate resources to the most significant failure drivers.
- Alert Type Monitoring: Review Alert Distribution by Type to ensure monitoring coverage matches alert volume and severity.
- Alert Resolution Performance: Assess Alert Resolution Rate against targets to identify gaps in response and closure processes.
- Station Level Performance Review: Analyze the Station Summary Table to identify stations with low SCADA uptime, weak connectivity, or high alert counts.
Benefits of a CNG Station Systems & Digital Monitoring Dashboard
The following are the benefits of using this dashboard:
- Centralized Monitoring Visibility: Provides a real-time view of CNG station systems performance across the network.
- Proactive Issue Detection: Identifies potential problems early through alert monitoring and trend analysis.
- Reduced Station Downtime: Helps detect root causes of outages and prioritize reliability improvements.
- Improved Maintenance Efficiency: Enhances response speed through tracking of alert resolution and response times.
- Higher Network Reliability: Ensures stable operations by monitoring SCADA uptime and station connectivity.
- Data Driven Capital Planning: Supports infrastructure investment decisions using downtime root cause insights.
- Stronger Operational Decisions: Enables better management actions using detailed station performance metrics.
- Cross Station Benchmarking: Allows comparison across stations to identify best practices and performance gaps.
KPIs to Track in a CNG Station Systems & Digital Monitoring Dashboard
The following key KPIs can be tracked by using this dashboard:
- SCADA Uptime (%): Percentage of time SCADA systems maintain communication and control at each station.
- Station Connectivity (%): Overall network connectivity status for each CNG station.
- System Alerts (count): Number of active system alerts requiring attention.
- Average Response Time (minutes): Mean time from alert generation to initial response.
- Station Downtime (hours): Total hours stations were non-operational due to system issues.
- Total Number of Stations: Count of CNG stations in the network.
- Alert Distribution by Type: Breakdown of alerts by category (Pressure, Temperature, Flow, Connectivity).
- Alert Resolution Rate (%): Percentage of alerts resolved within target timeframe.
- Downtime Root Cause Analysis: Breakdown of downtime causes (Hardware Fault, Network Failure, Software Fault).
- Station-Level Performance: Individual station metrics for SCADA uptime, connectivity, and alert counts.
Frequently Asked Questions
Q1. What is the purpose of this CNG Station Systems & Digital Monitoring Dashboard?
This dashboard provides a centralized view of CNG station systems performance, digital monitoring effectiveness, and alert management across the entire station network. It helps operators track SCADA uptime, monitor connectivity, manage system alerts, and minimize station downtime.
Q2. What types of system alerts can be monitored?
The dashboard tracks four primary alert categories: Pressure alerts (40% of total), Temperature alerts (20%), Flow alerts (30%), and Connectivity alerts (10%). This breakdown enables targeted response based on alert type and severity.
Q3. How does the dashboard help reduce station downtime?
By providing detailed Downtime Root Cause Split analysis showing contributions from Hardware Fault (29%), Network Failure (51%), and Software Fault (67%), the dashboard enables targeted investments in the most significant downtime drivers. Station-level downtime tracking also identifies specific locations requiring attention.
Q4. What is SCADA uptime and why is it important?
SCADA (Supervisory Control and Data Acquisition) uptime measures the percentage of time that control and monitoring systems are operational at each station. High SCADA uptime (target 99.5%+) is critical for remote monitoring, automated control, and early warning of potential issues.
Q5. Who typically uses this dashboard?
Station operators, control room engineers, maintenance supervisors, network operations managers, and distribution leadership use this dashboard to oversee CNG station performance and drive continuous improvement in reliability.