
What is a CNG Emissions Reduction & Air Quality Impact Dashboard?
A CNG Emissions Reduction & Air Quality Impact Dashboard is a comprehensive visualization platform designed to monitor, quantify, and report on the environmental benefits of Compressed Natural Gas (CNG) adoption across transportation and industrial applications. It consolidates critical environmental metrics, including CO₂ reduction, NOx reduction, emissions intensity, greenhouse gas savings, air quality index improvement, and renewable energy usage into a unified, real-time interface.
By integrating CNG emissions reduction tracking, air quality impact assessment, fleet decarbonization monitoring, and CNG vs diesel emissions comparison, this dashboard enables environmental managers, sustainability officers, fleet operators, and government agencies to quantify the positive impact of CNG adoption, demonstrate progress toward climate goals, optimize fuel switching strategies, and communicate environmental benefits to stakeholders and communities. It serves as a central command center for measuring and showcasing the environmental value of natural gas as a cleaner alternative to conventional fuels.
How to Create a CNG Emissions Reduction & Air Quality Impact Dashboard
You don’t need to build your report from scratch, just start with a ready to use dashboard template from Mokkup. Add in your data and export it however you like. Here’s how to do it:
1. Create or Log in to Your Mokkup Account
Start by signing up on Mokkup.ai using your email. If you already have an account, just log in, and you’ll be good to go.
2. Choose and Customize Your Dashboard Template
Find the CNG Emissions Reduction & Air Quality Impact dashboard template in the Templates section. Use the drag-and-drop editor to adjust KPIs, edit filters, or add elements based on your data.
3. Export to Your BI Tool
Once your dashboard wireframe is ready, use the BI Tool Export feature to send it directly to Power BI or Tableau for further analysis and enhancements. You can also download the dashboard as a PDF, PNG, or JPEG, embed it on a platform, or invite your team to collaborate.
Note: This is a Pro template. You’ll need a Pro subscription on Mokkup to use and customize this dashboard wireframe. Upgrade anytime to unlock full access.
CNG Emissions Reduction & Air Quality Impact Dashboard Example
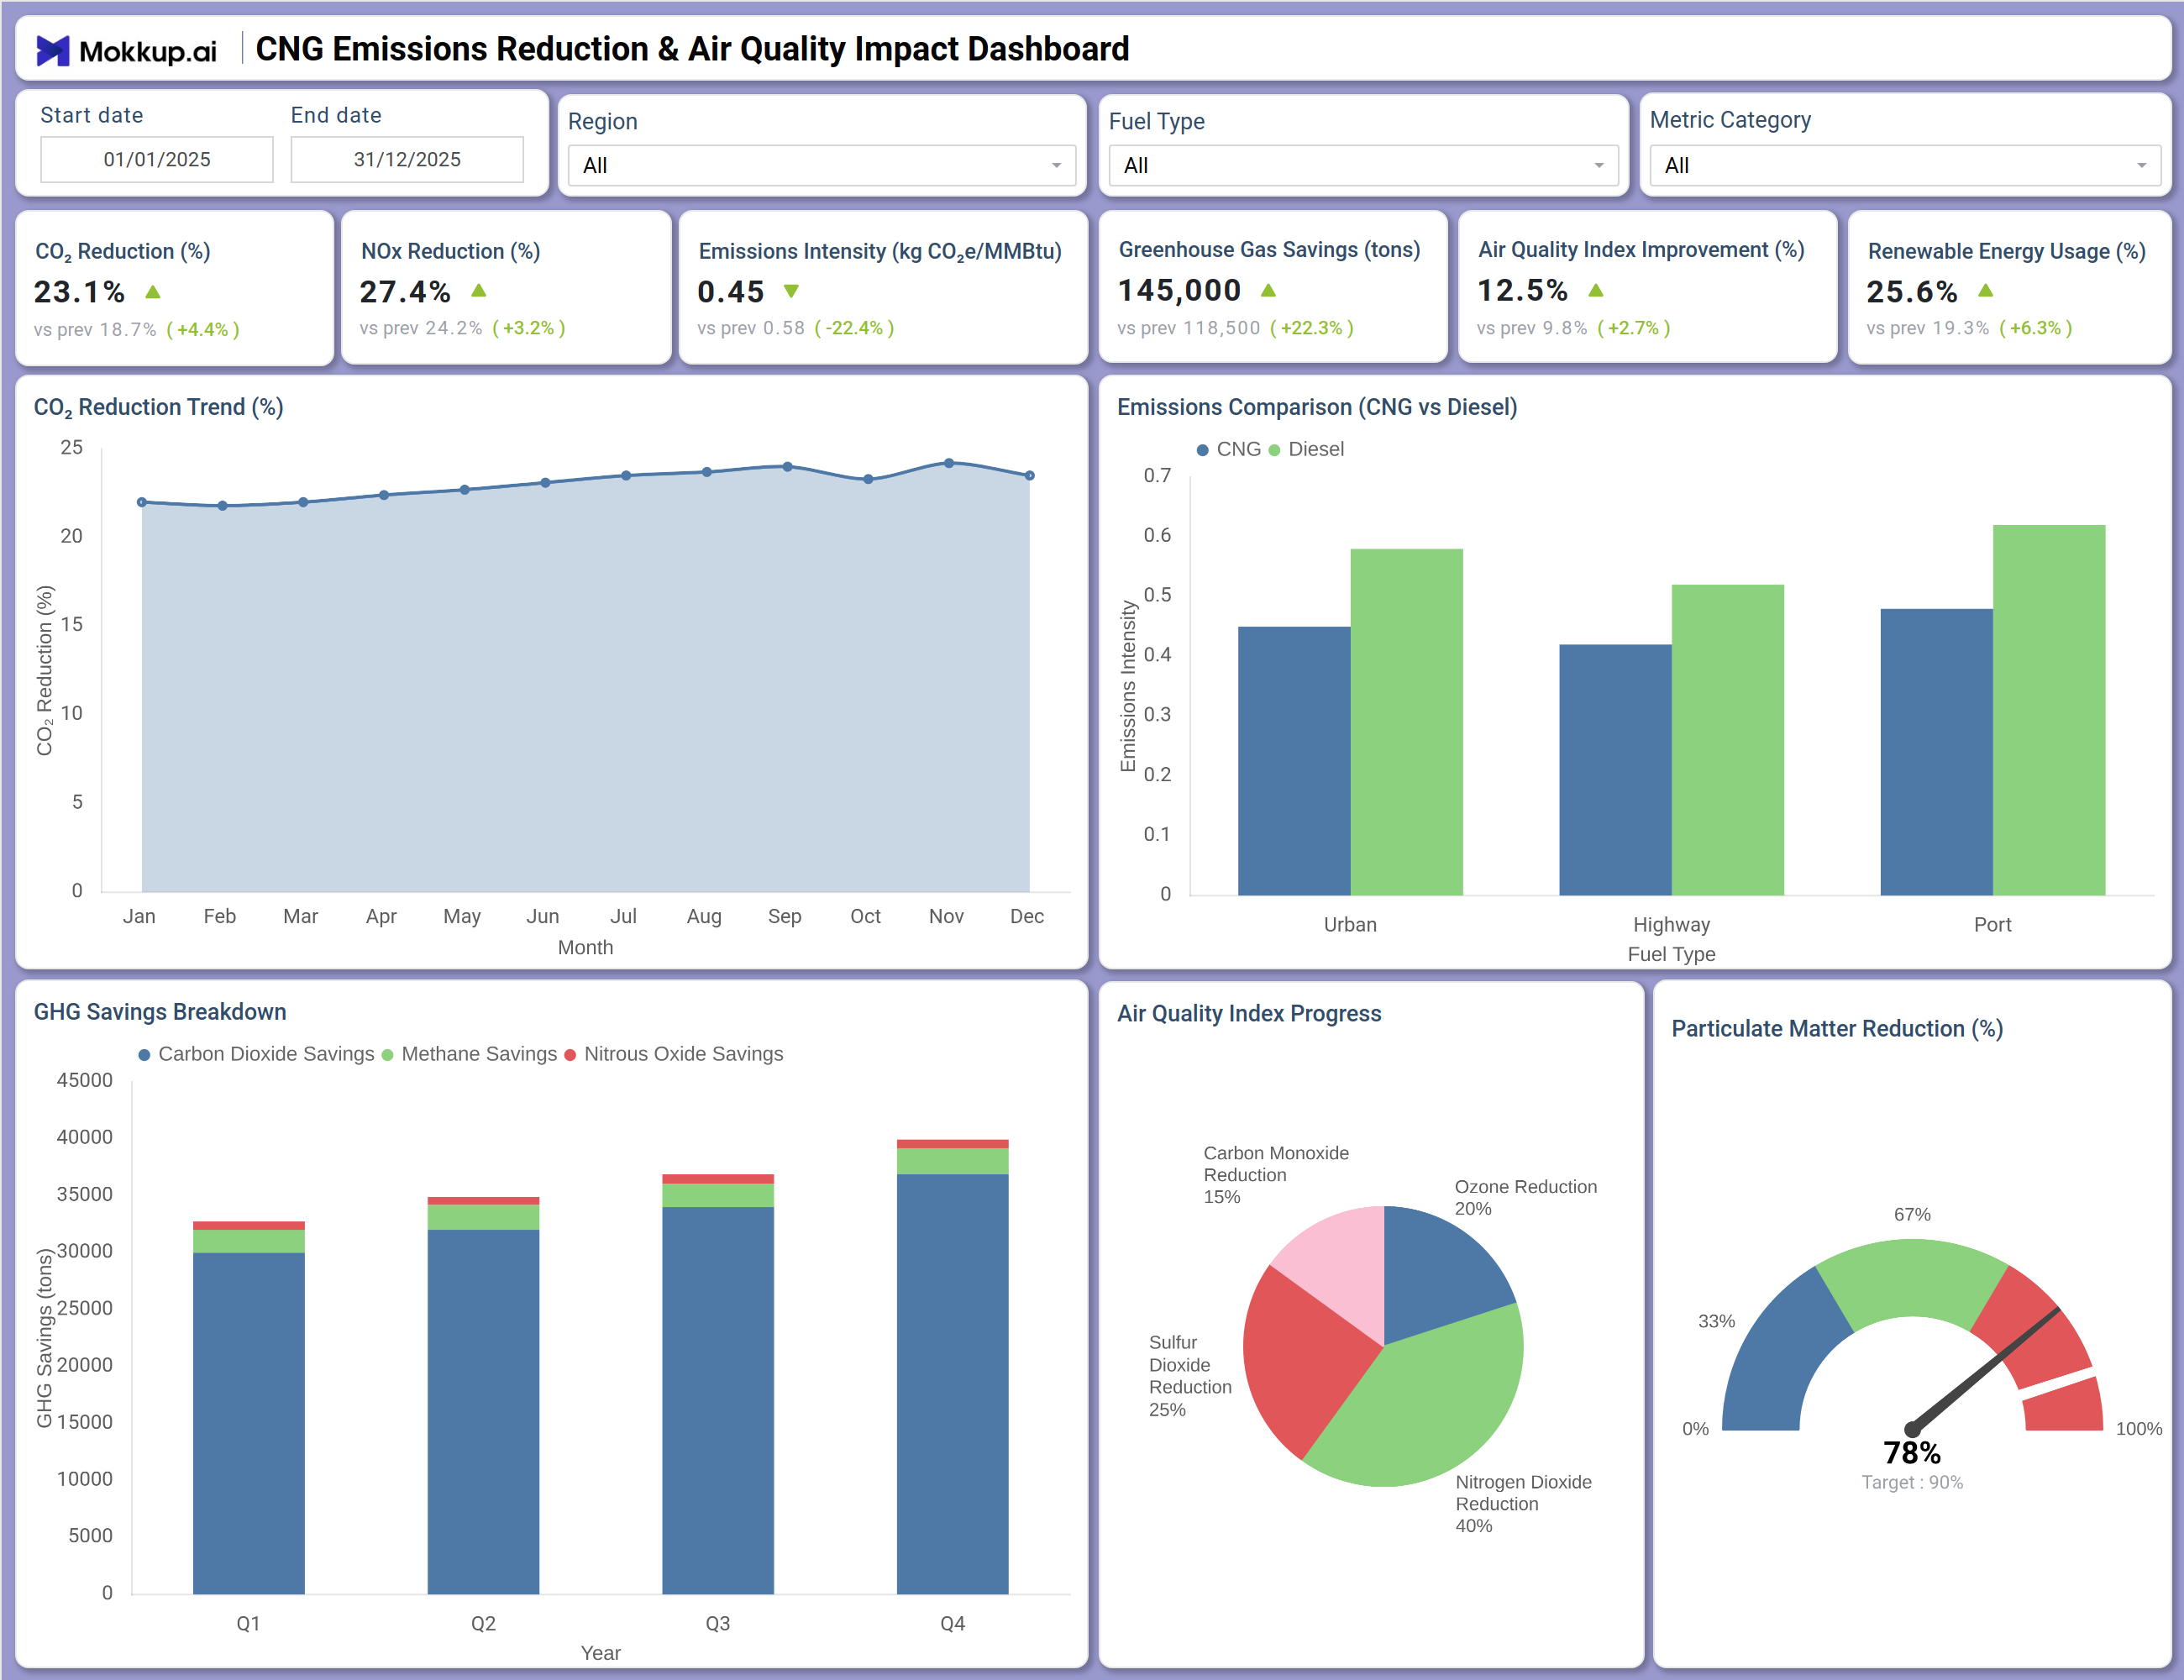
This dashboard delivers a comprehensive view of environmental performance and air quality improvements resulting from CNG adoption. The Overview screen prominently displays six critical environmental KPIs with trend indicators: CO₂ Reduction at 23.1% (up 4.4% from prior period), NOx Reduction at 27.4% (3.2% improvement), Emissions Intensity reduced to 0.45 kg CO₂e/MMBtu (22.4% decrease), Greenhouse Gas Savings at 145,000 tons (22.3% increase), Air Quality Index Improvement at 12.5% (2.7% gain), and Renewable Energy Usage at 25.6% (6.3% increase).
The CO₂ Reduction Trend (%) chart tracks monthly CO₂ reduction performance, revealing patterns and validating the impact of CNG adoption over time. Emissions Comparison (CNG vs Diesel) provides a critical benchmark, showing emissions intensity across Urban, Highway, and Port applications with CNG (blue) consistently outperforming diesel (green)—quantifying the environmental advantage of natural gas.
The GHG Savings Breakdown bar chart displays annual savings across Carbon Dioxide, Methane, and Nitrous Oxide categories, enabling comprehensive greenhouse gas accounting. Air Quality Index Progress tracks percentage improvements against 100% targets for key pollutants including Sulfur Dioxide Reduction, Nitrogen Dioxide Reduction, Ozone Reduction, Carbon Monoxide Reduction, and Particulate Matter Reduction—demonstrating the local air quality benefits of CNG adoption. Together, these components enable CNG emissions reduction tracking, air quality impact assessment, fleet decarbonization monitoring, and data-driven environmental compliance reporting.
How to Analyze Data in a CNG Emissions Reduction & Air Quality Impact Dashboard
Here is how you can analyze data from this dashboard:
- Monitor CO₂ Reduction (%) over time to quantify climate benefits and track progress toward emissions reduction targets.
- Track NOx Reduction (%) to measure improvements in criteria air pollutants that impact local air quality and public health.
- Review Emissions Intensity (kg CO₂e/MMBtu) to benchmark operational efficiency and identify opportunities for further reduction.
- Analyze Greenhouse Gas Savings (tons) to quantify total climate benefit and support carbon credit or offset claims.
- Examine Air Quality Index Improvement (%) to demonstrate local environmental benefits to communities and regulators.
- Evaluate Renewable Energy Usage (%) to track progress in decarbonizing the fuel supply through renewable natural gas (RNG) integration.
- Use Emissions Comparison (CNG vs Diesel) to quantify the environmental advantage of CNG and support fuel switching business cases.
- Drill into the GHG Savings Breakdown to understand the composition of greenhouse gas reductions across different pollutant categories.
- Assess Air Quality Index Progress against targets to identify which pollutants have seen the greatest improvement and where additional focus is needed.
Benefits of a CNG Emissions Reduction & Air Quality Impact Dashboard
The following are the benefits of using this dashboard:
- Provides centralized, real-time visibility into environmental performance and air quality impacts of CNG adoption.
- Enables quantification of climate benefits through comprehensive greenhouse gas savings tracking.
- Demonstrates local air quality improvements to communities, regulators, and stakeholders.
- Supports carbon credit verification and emissions trading programs with auditable data.
- Facilitates fuel switching business cases through CNG vs diesel emissions comparison.
- Enhances sustainability reporting with quantified environmental metrics.
- Identifies opportunities for further emissions reduction through intensity tracking.
- Supports regulatory compliance with emissions reporting requirements.
KPIs to Track in a CNG Emissions Reduction & Air Quality Impact Dashboard
The following key KPIs can be tracked by using this dashboard:
- CO₂ Reduction (%) : Percentage reduction in carbon dioxide emissions compared to baseline.
- NOx Reduction (%) : Percentage reduction in nitrogen oxide emissions compared to baseline.
- Emissions Intensity (kg CO₂e/MMBtu) : Greenhouse gas emissions per unit of energy consumed.
- Greenhouse Gas Savings (tons) : Total tons of CO₂ equivalent emissions avoided.
- Air Quality Index Improvement (%) : Percentage improvement in overall air quality metrics.
- Renewable Energy Usage (%) : Percentage of CNG derived from renewable sources (RNG).
- CNG vs Diesel Emissions Comparison: Side-by-side comparison of emissions intensity by application type.
- GHG Savings Breakdown: Annual savings by greenhouse gas type (CO₂, Methane, Nitrous Oxide).
- Air Quality Pollutant Reductions: Percentage improvements for SO₂, NO₂, Ozone, CO, and Particulate Matter.
- Emissions Reduction by Application: CO₂ and NOx reduction rates for Urban, Highway, and Port applications.
Frequently Asked Questions
1. What is the purpose of this CNG Emissions Reduction & Air Quality Impact Dashboard?
This dashboard quantifies and tracks the environmental benefits of CNG adoption, including greenhouse gas reductions, emissions intensity improvements, and local air quality enhancements. It helps environmental managers, fleet operators, and sustainability officers measure progress toward climate goals and demonstrate the value of fuel switching.
2. How does the dashboard compare CNG emissions to diesel?
The Emissions Comparison chart shows side-by-side emissions intensity for CNG versus diesel across Urban, Highway, and Port applications, quantifying the environmental advantage of natural gas for different use cases and supporting fuel switching decisions.
3. What greenhouse gases are tracked in the GHG Savings Breakdown?
The dashboard tracks savings across three key greenhouse gases: Carbon Dioxide (CO₂), Methane (CH₄), and Nitrous Oxide (N₂O), enabling comprehensive climate impact accounting and supporting carbon credit verification.