
What is a CNG Distribution Utility Business Executive Overview Dashboard
The CNG Distribution Utility Business Executive Overview Dashboard is a centralized analytics platform designed for natural gas utilities and compressed natural gas (CNG) distributors. It consolidates operational metrics, financial performance, fleet management data, and emissions tracking into a single view. This dashboard helps executives monitor CNG station profitability, fleet refueling trends, compression efficiency, and carbon displacement to optimize distribution strategies. By integrating supply chain, revenue, and operational KPIs, it enables data-driven decisions for scaling CNG infrastructure, improving fleet partnerships, and reducing emissions. The dashboard also provides regional performance comparisons, helping leaders identify high-performing stations and areas needing improvement.
How to Create a CNG Distribution Utility Business Executive Overview Dashboard
You don't need to build your report from scratch, just start with a ready-to-use dashboard template from Mokkup. Add in your data and export it however you like. Here's how to do it:
1. Create or Log in to Your Mokkup Account
Start by signing up on Mokkup.ai using your email. If you already have an account, just log in, and you'll be good to go.
2. Choose and Customize Your Dashboard Template
Find the CNG Distribution Utility Business Executive Overview Dashboard template in the Templates section. Use the drag-and-drop editor to adjust KPIs, edit filters, or add elements based on your data.
3. Export to Your BI Tool
Once your dashboard wireframe is ready, use the BI Tool Export feature to send it directly to Power BI or Tableau for further analysis and enhancements. You can also download the dashboard as a PDF, PNG, or JPEG, embed it on a platform, or invite your team to collaborate.
Note: This is a Pro template. You'll need a Pro subscription on Mokkup to use and customize this dashboard wireframe. Upgrade anytime to unlock full access.
CNG Distribution Utility Business Executive Overview Dashboard Example
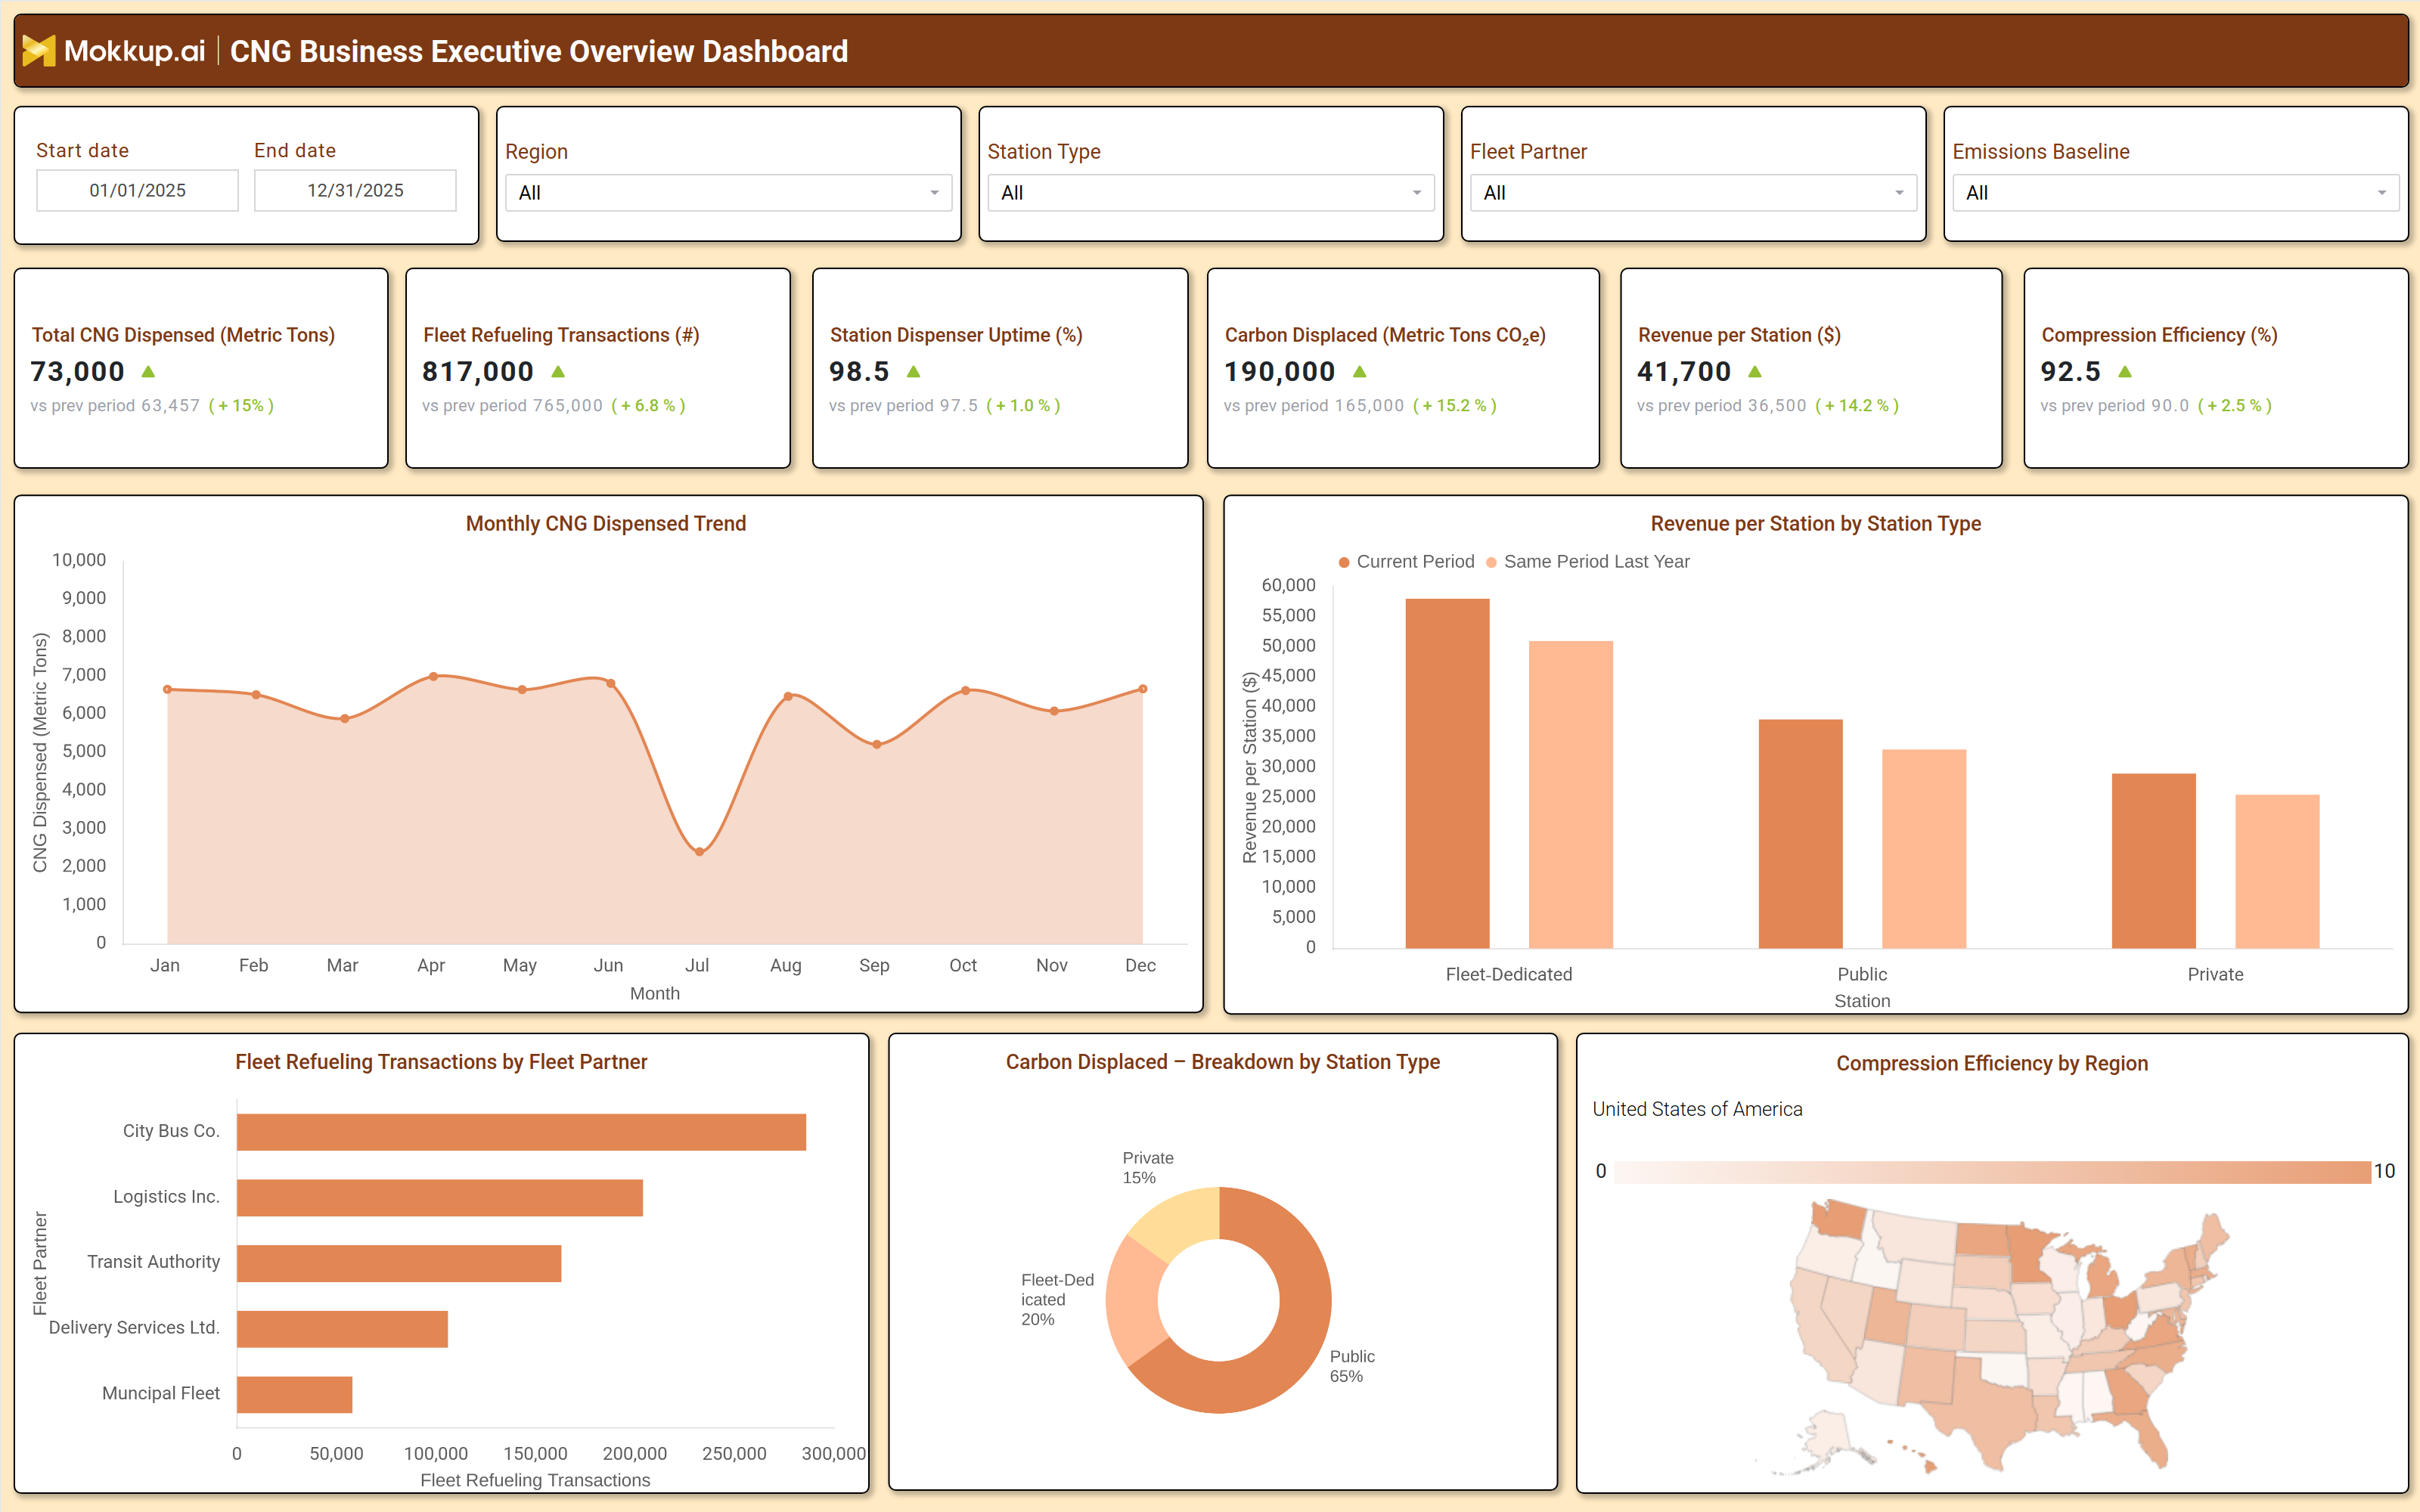
A typical CNG Distribution Utility Business Executive Overview Dashboard includes interactive filters for date range, region, station type, fleet partner, and emissions baseline. Key performance tiles display total CNG dispensed (metric tons), fleet refueling transactions, station dispenser uptime, carbon displaced, revenue per station, and compression efficiency. Trend charts show monthly CNG dispensed trends, while bar graphs compare revenue per station by type (fleet dedicated, public, private). A fleet refueling breakdown by partner highlights top-performing fleets, and a carbon displacement pie chart visualizes emissions reductions by station type. A compression efficiency heatmap by region identifies operational strengths and weaknesses. Together, these components provide a comprehensive view of CNG distribution performance, enabling executives to track profitability, fleet engagement, and sustainability efforts.
How to Analyze Data in a CNG Distribution Utility Business Executive Overview Dashboard
Here is how you can analyze data from this natural gas utility business intelligence dashboard:
- Evaluates Total CNG Dispensed: Reviews the total volume of CNG distributed to understand overall demand, track growth trends, and support capacity planning.
- Tracks Fleet Refueling Transactions: Identifies high-demand fleet partners by analyzing refueling frequency and volume, helping optimize station capacity and service allocation.
- Monitors Station Dispenser Uptime: Ensures operational reliability by tracking uptime metrics, minimizing downtime, and improving customer satisfaction.
- Measures Carbon Displacement: Analyzes emissions reduction achieved through CNG usage to quantify environmental impact and support sustainability reporting.
- Compares Revenue per Station: Evaluates profitability across fleet-dedicated, public, and private stations to identify high-performing locations and areas needing improvement.
- Assesses Compression Efficiency by Region: Examines regional performance of compression systems to enhance operational efficiency and reduce energy consumption.
- Analyzes Fleet Partner Transactions: Studies transaction patterns of fleet partners to strengthen relationships, identify opportunities, and negotiate better commercial terms.
- Benchmark Performance Against Historical Data: Compares current metrics with past performance to detect growth trends, seasonal patterns, or early signs of decline.
Benefits of a CNG Distribution Utility Business Executive Overview Dashboard
The following are the benefits of using this CNG carbon displacement tracking dashboard:
- Enhances Visibility into CNG Distribution Performance: Provides a clear view of CNG distribution across regions and station types, helping stakeholders monitor performance and identify regional trends.
- Optimizes Fleet Partnerships: Identifies high-value customers and analyzes refueling patterns, enabling better collaboration, targeted engagement, and improved partner retention.
- Improves Station Profitability: Leverages revenue insights and operational efficiency metrics to identify profit drivers and optimize station-level performance.
- Supports Sustainability Reporting: Tracks carbon displacement and emissions reductions, making it easier to measure environmental impact and meet reporting requirements.
- Reduces Operational Inefficiencies: Monitors compression efficiency and station uptime to detect inefficiencies, reduce energy waste, and improve overall operations.
- Enables Data-Driven Decision Making: Delivers actionable insights to support the expansion of CNG infrastructure and scaling of fleet programs with confidence.
- Streamlines Executive Reporting: Automates KPI tracking and trend analysis, enabling faster, more accurate reporting for leadership and decision-makers.
KPIs to Track in a CNG Distribution Utility Business Executive Overview Dashboard
The following key KPIs can be tracked by using this fleet refueling analytics dashboard:
- Total CNG Dispensed (Metric Tons): Measures overall distribution volume and growth.
- Fleet Refueling Transactions (#): Tracks demand from fleet partners and station utilization.
- Station Dispenser Uptime (%): Indicates operational reliability and maintenance needs.
- Carbon Displaced (Metric Tons CO₂e): Quantifies emissions reductions from CNG adoption.
- Revenue per Station ($): Evaluates profitability across different station types.
- Compression Efficiency (%): Assesses energy efficiency in CNG production and distribution.
- Fleet Partner Transactions (#): Identifies top performing fleet customers for partnership optimization.
Frequently Asked Questions
1. What is a CNG business performance dashboard used for?
It tracks CNG dispensed volume, fleet refueling transactions, station uptime, carbon displacement, and revenue per station to help executives monitor operational and financial performance.
2. What data sources feed a compressed natural gas distribution dashboard?
CNG station transaction logs, fleet refueling records, compression efficiency reports, and emissions tracking systems.
3. Who should use a CNG business intelligence dashboard?
CNG distributors, fleet managers, utility executives, and sustainability leaders are monitoring operational and financial performance.