A command center dashboard is a centralized tool that provides data visualization and monitoring capabilities for an organization or team. It typically displays key metrics, such as performance indicators, operational metrics, and other relevant data, in a user-friendly and easily digestible format. The dashboard can be customized to meet the specific needs of the organization or team and may include different types of charts, graphs, tables, and other visual elements to help users quickly and easily understand the data being presented.
Screen 1: Overview
It is a centralized platform offering data visualization and monitoring functions for a group or entity. It commonly exhibits essential metrics, like performance indicators and operational data, in a readily comprehensible layout. This dashboard is adaptable to suit the distinct requirements of the group or entity, incorporating various visual aids like charts, graphs, and tables for enhanced data comprehension.
Key Terms to consider:
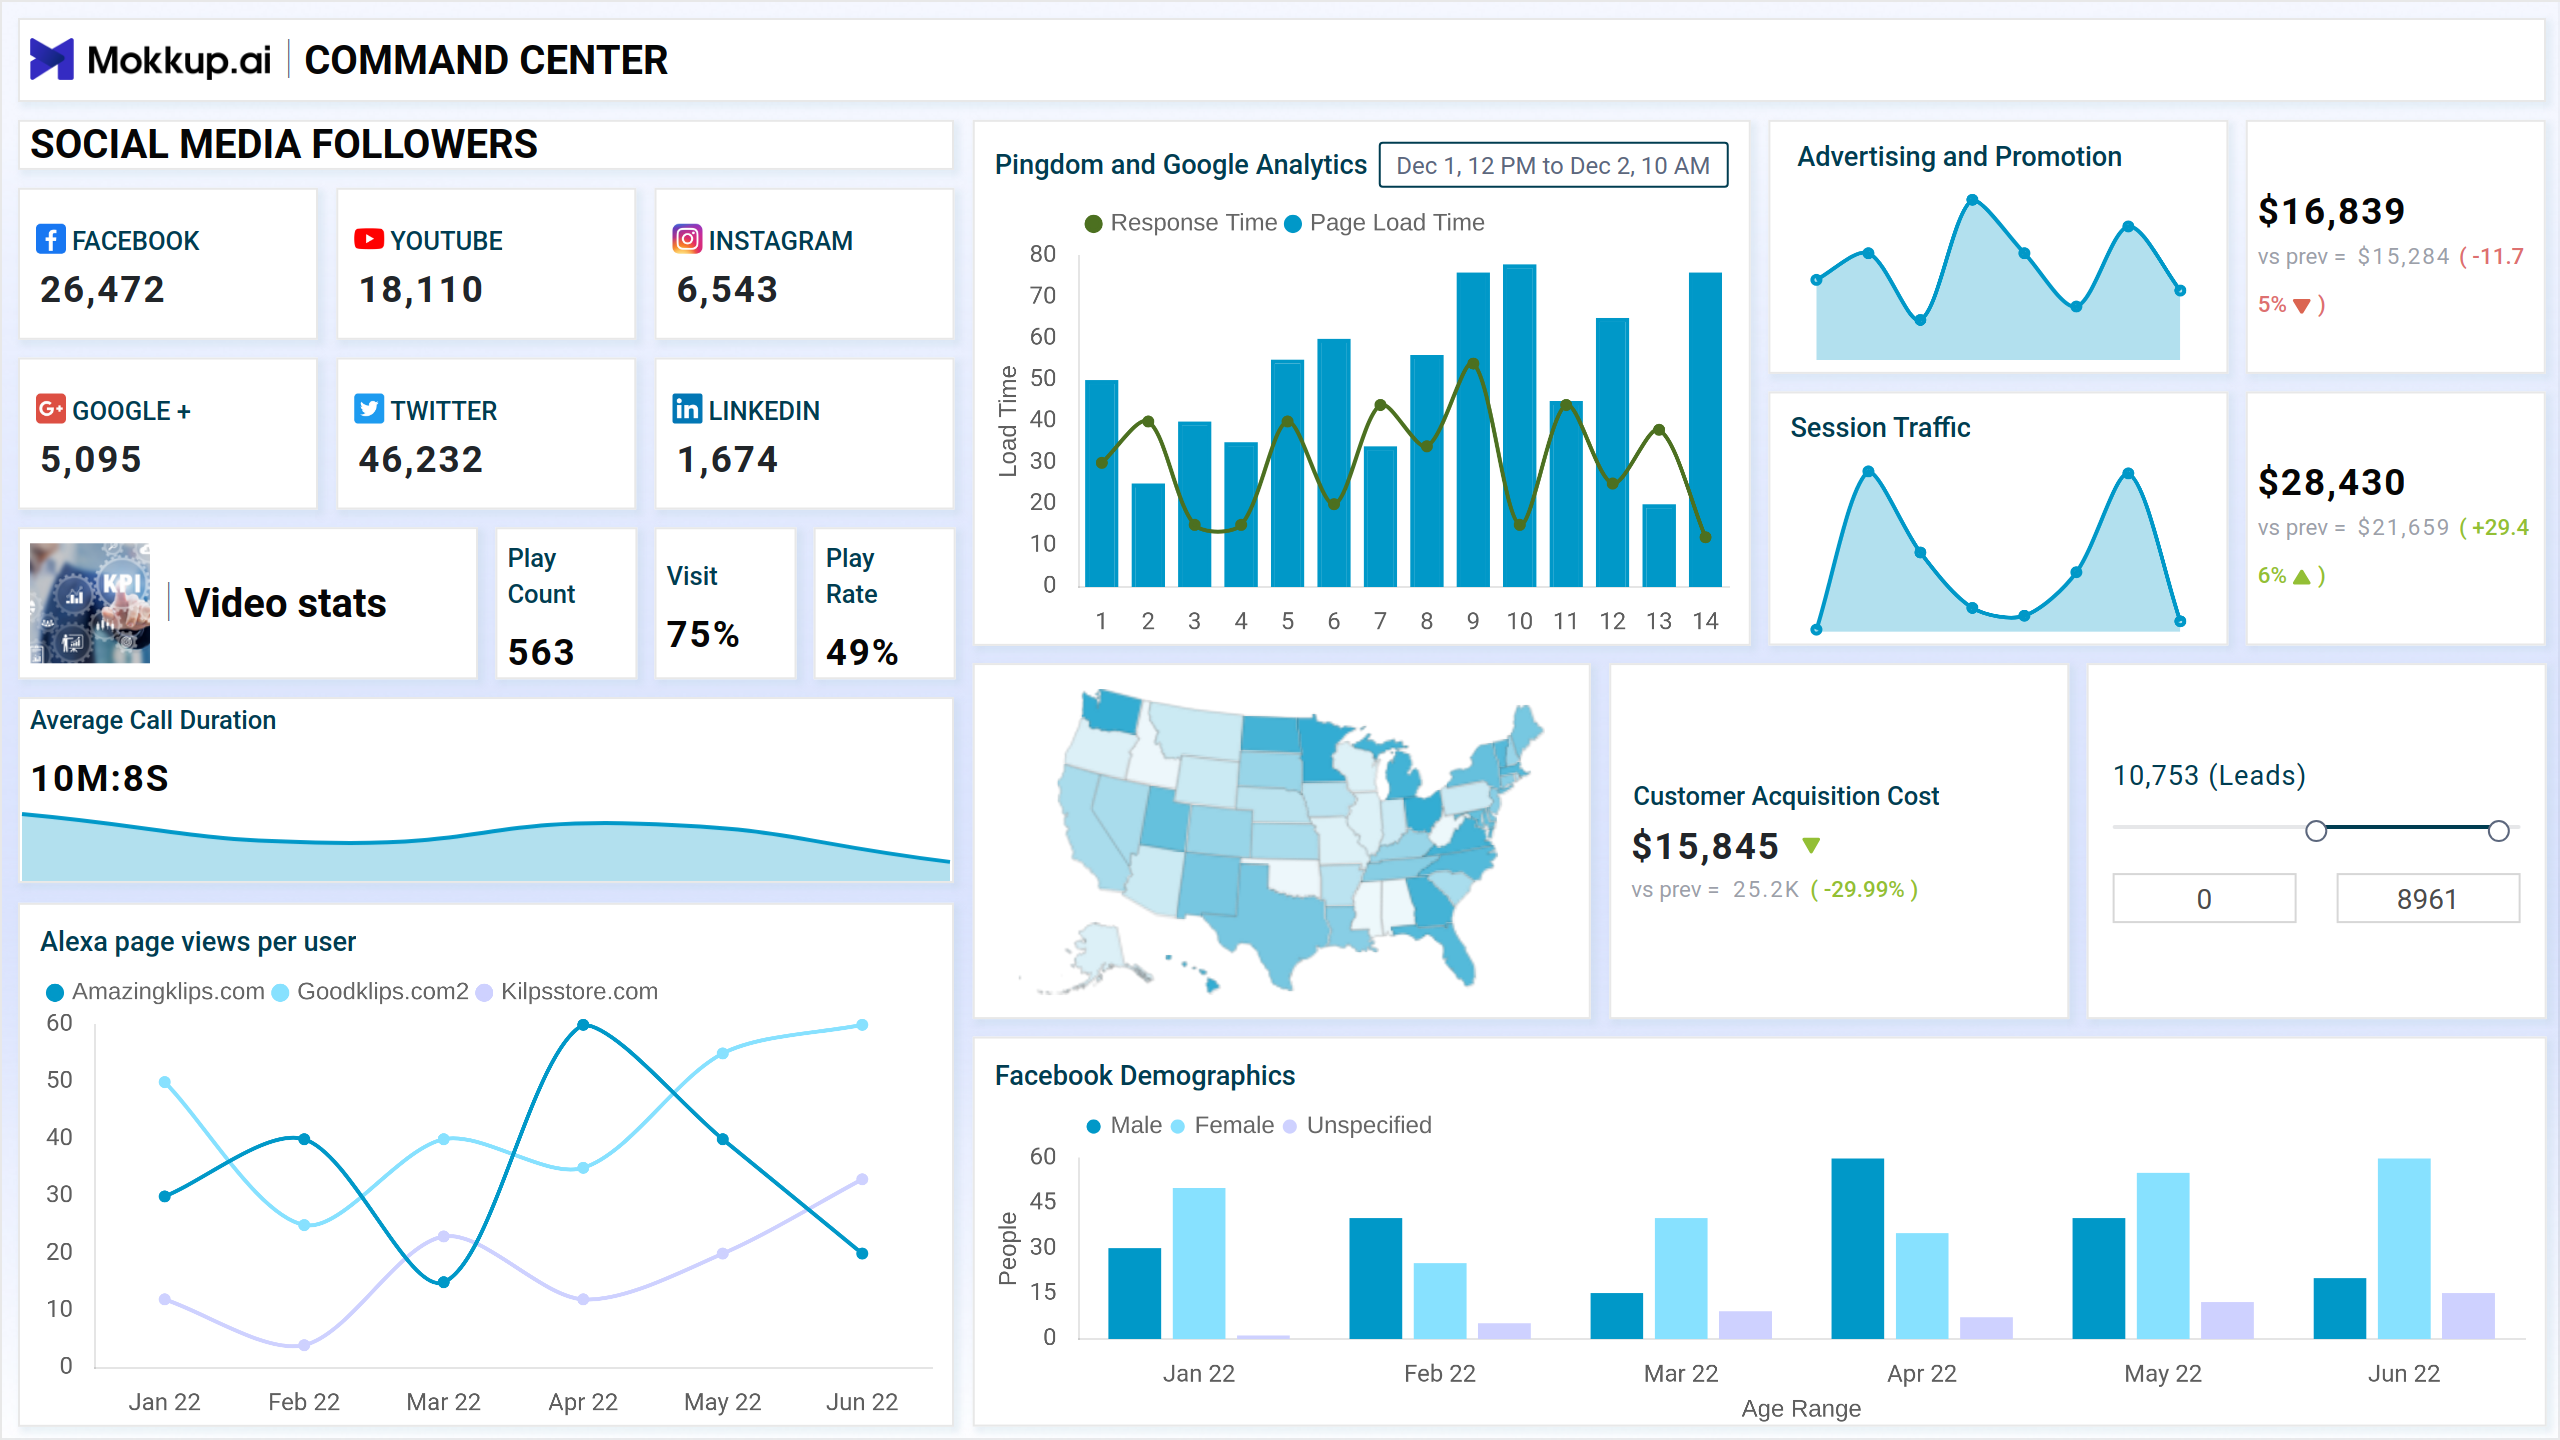
- Facebook Demographics: The Facebook Demographics segment can provide insights into the characteristics of the audience that engages with a Facebook page.
- Social Media Followers/Subscribers: The following section of the dashboard can help in providing an overview of the audience that follows or subscribes to a social media account.
- Video Stats: A video stats division gives an overview of the performance of a video or series of videos. It can show metrics related to how the audience engages with the video, such as play count, lead count, visit, play rate & average call duration.
- Customer Acquisition: Businesses use this segment to track their customer acquisition performance. It provides insights and metrics about their marketing efforts and the effectiveness of the sales funnel.
Dashboard Template Insights
This dashboard has customizable features, including charts and graphs for easy comprehension of key metrics like performance indicators and operational data. Key terms such as Facebook Demographics, Social Media Followers/Subscribers, Video Stats, and Customer Acquisition provide insights into audience characteristics and marketing effectiveness, aiding in informed decision-making. In conclusion, the command center dashboard enhances operational efficiency and decision-making with its customizable design and comprehensive data visualization capabilities.
Conclusion
In summary, the command center is designed with the end user in mind and provides easy-to-read visualizations that can quickly convey critical information. Additionally, it is customizable and scalable to accommodate changing needs and evolving data sources. A well-designed command center dashboard can enhance operational efficiency, increase situational awareness, and improve decision-making capabilities.