
What is a City Public Services Overview Dashboard?
A City Public Services Overview dashboard template is a comprehensive analytics platform that enables municipalities to monitor, evaluate, and optimize citywide operations. It centralizes data from various departments, including water, sanitation, transport, public safety, and infrastructure maintenance, to provide a unified view of performance. This municipal public service analytics tool enables city administrators to assess response efficiency, resource allocation, and citizen satisfaction. Through visual insights and KPI tracking, it simplifies complex operational data, enabling informed decision-making and transparency in urban governance.
How to Create a City Public Services Overview Dashboard
You don’t need to build your report from scratch—just start with a ready-to-use City Public Services Overview dashboard template from Mokkup. Add in your data and export it however you like. Here’s how to do it:
1. Create or Log in to Your Mokkup Account
Start by signing up on Mokkup.ai using your email. If you already have an account, just log in, and you’ll be good to go.
2. Choose and Customize Your Dashboard Template
Find the City Public Services Overview Dashboard template in the Templates section. Use the drag-and-drop editor to adjust KPIs, edit filters, or add elements based on your data.
3. Export to Your BI Tool
Once your dashboard wireframe is ready, use the BI Tool Export feature to send it directly to Power BI or Tableau for further analysis and enhancements. You can also download the dashboard as a PDF, PNG, or JPEG, embed it on a platform, or invite your team to collaborate.
Note: This is a Pro template. You’ll need a Pro subscription on Mokkup to use and customize this dashboard wireframe. Upgrade anytime to unlock full access.
City Public Services Overview Dashboard Example
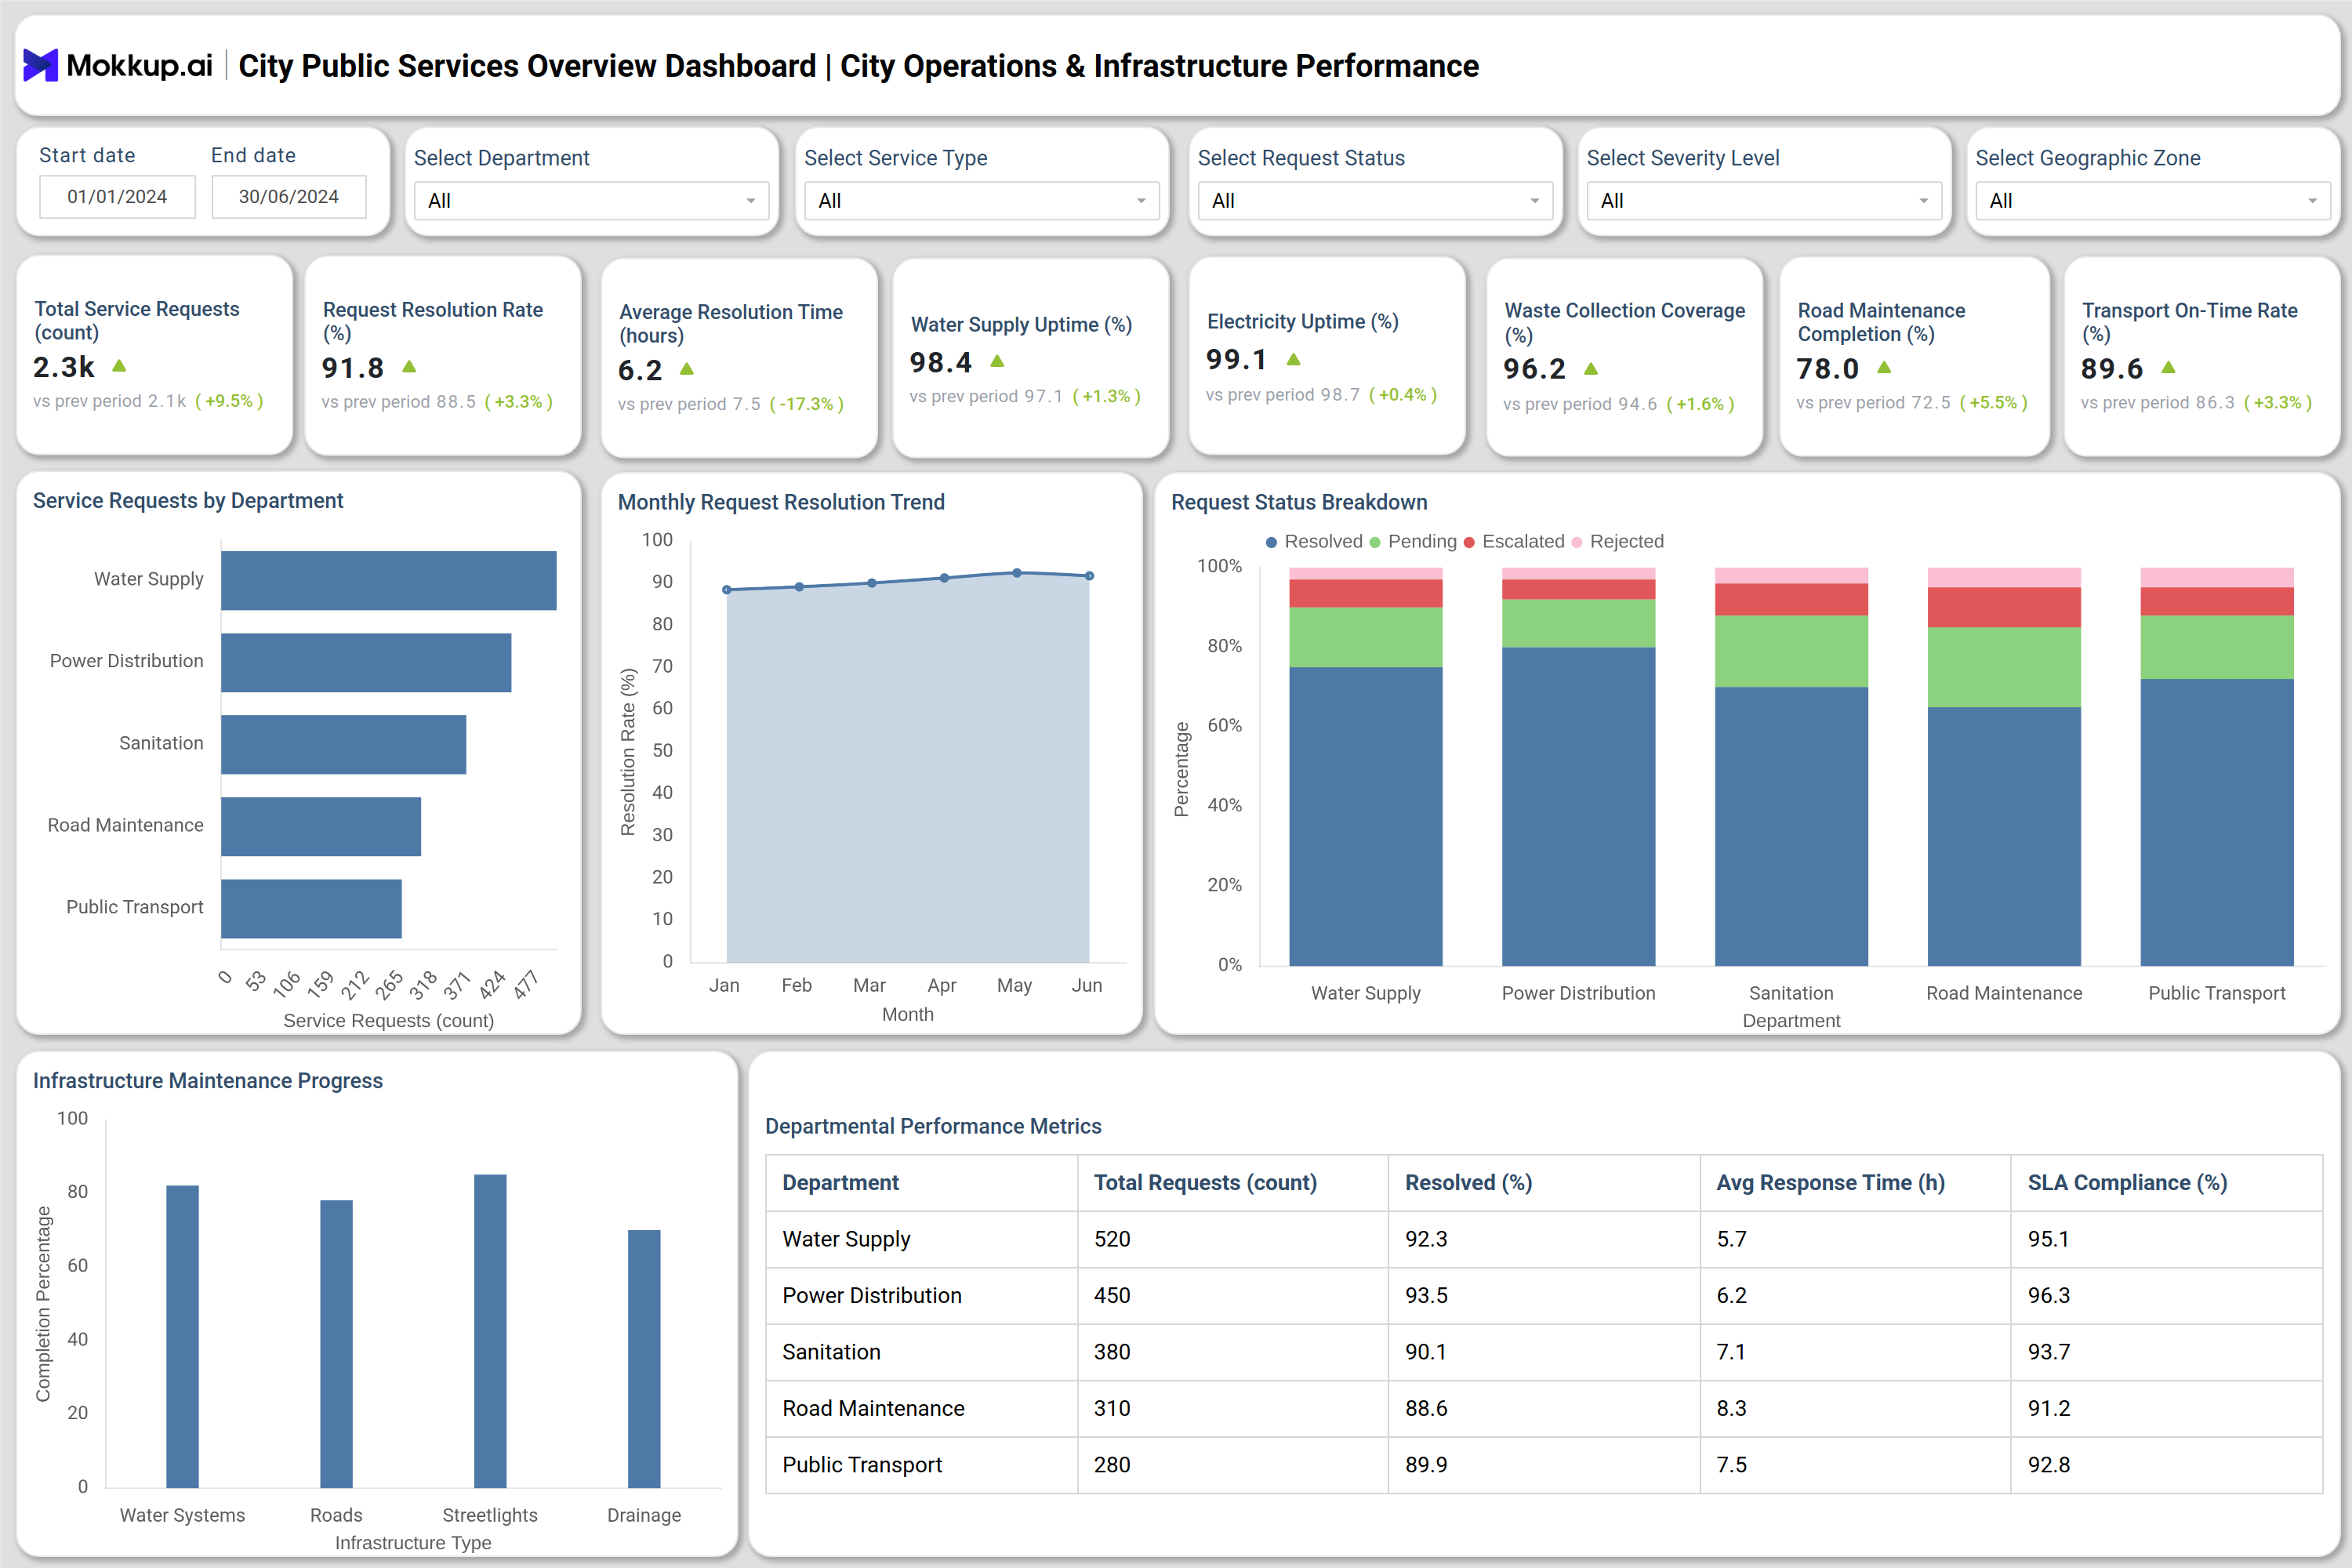
You can create a city operations and public service data dashboard that combines multiple analytical layers to evaluate how public departments perform in service delivery, safety, and citizen engagement. The first section, City Operations & Infrastructure Performance, tracks utility uptime, service request resolutions, and maintenance completion rates. This ensures that departments such as water, sanitation, and power distribution are monitored effectively for timely responses and compliance with service standards. The Citizen Experience & Public Safety dashboard measures public satisfaction, feedback sentiment, and emergency response efficiency. It enables administrators to analyze incidents, such as accidents or thefts, correlate them with service data, and evaluate overall safety management.
Together, these dashboards serve as a comprehensive city infrastructure and utilities monitoring dashboard, empowering urban planners to manage resources effectively, improve reliability, and foster greater citizen trust. It transforms raw data into actionable intelligence, positioning itself as an essential platform for tracking urban public service efficiency in modern cities.
How to Analyze Data in City Public Services Overview Dashboard
To make the most of the City Public Services Overview Dashboard, focus on assessing performance, service reliability, and citizen satisfaction to guide policy and operational improvements:
- Track Resolution Performance: Monitor trends in request resolution rates and response times to measure service reliability.
- Compare Departmental Efficiency: Use performance tables to identify top-performing and lagging departments.
- Evaluate Citizen Sentiment: Review public feedback to understand satisfaction and areas needing improvement.
- Monitor Utility Uptime: Evaluate the consistency of water, power, and waste services delivered to the community.
- Review Safety Metrics: Examine emergency response trends and incident types to strengthen safety strategies.
- Use Filters For Detailed Analysis: Drill down by department, zone, service type, or incident category for granular insights.
Benefits of City Public Services Overview Dashboard
The City Public Services Overview Dashboard helps governments track performance, enhance transparency, and ensure efficient delivery of essential public services:
- Centralized Data Management: Consolidates all city service data into one local government service performance dashboard.
- Improved Decision-Making: Provides clear visibility into key metrics, enabling better policy and operational choices.
- Enhanced Citizen Satisfaction: Monitors service quality and response rates to improve public experience.
- Operational Transparency: Strengthens accountability through real-time monitoring and reporting.
- Optimized Resource Allocation: Helps identify inefficiencies and reallocate resources where needed.
- Faster Emergency Response: Tracks and minimizes response times through real-time safety analytics.
KPIs to Track in City Public Services Overview Dashboard
Tracking these KPIs helps measure the quality, efficiency, and engagement of city services:
- Total Service Requests: Volume of requests received across departments.
- Resolution Rate (%): Percentage of requests successfully completed.
- Average Response Time: Time taken to resolve service issues.
- Utility Uptime (%): Performance of water, power, and sanitation systems.
- Citizen Satisfaction Score: Public feedback on service experience.
- Incident Rate (%): Frequency of public safety incidents across city areas.
- SLA Compliance (%): Adherence to predefined service-level agreements.
- Positive Feedback (%): Measure of public approval for service outcomes.
Frequently Asked Questions
Q1. What is the main purpose of a city public services performance dashboard?
It enables local governments to monitor service delivery, operational performance, and citizen satisfaction in a single, unified system.
Q2. How does this municipal public service analytics tool support city planning?
It provides real-time insights into utilities, safety, and maintenance, helping administrators make data-driven decisions.
Q3. Can it track both operational and citizen-facing KPIs?
Yes, it monitors performance metrics such as uptime and response rate, along with public satisfaction and feedback.
Q4. Why is the city infrastructure and utilities monitoring dashboard important?
It ensures city resources are utilized efficiently, helping reduce downtime, enhance safety, and improve transparency.
Q5. Who can use the city operations and public service data dashboard?
Urban planners, municipal managers, policy makers, and local government departments use it for performance tracking and planning.