What is a Christmas Retail Supply & Demand Planner Dashboard?
A Christmas Retail Supply & Demand Planner Dashboard template is a strategic inventory management tool designed to balance stock levels, optimize supplier performance, and maximize sales during the critical holiday season. It consolidates key metrics such as in-stock rate, overstock value, sell-through, and forecast accuracy into a single visual platform.
By integrating holiday inventory optimization, Christmas demand forecasting, and supplier performance tracking during the festive season, the dashboard enables retail planners and buyers to prevent stockouts, minimize excess inventory, and ensure product availability. The dashboard wireframe serves as a central hub for monitoring inventory days remaining, evaluating forecast reliability, and managing supplier relationships to meet the volatile demand of the Christmas season.
How to Create a Christmas Retail Supply & Demand Planner Dashboard
You don’t need to build your report from scratch—just start with a ready-to-use Christmas Retail Supply & Demand Planner dashboard template from Mokkup. Add in your data and export it however you like. Here’s how to do it:
1. Create or Log in to Your Mokkup Account
Start by signing up on Mokkup.ai using your email. If you already have an account, just log in, and you’ll be good to go.
2. Choose and Customize Your Dashboard Template
Find the Christmas Retail Supply & Demand Planner Dashboard template in the Templates section. Use the drag-and-drop editor to adjust KPIs, edit filters, or add elements based on your data.
3. Export to Your BI Tool
Once your dashboard wireframe is ready, use the BI Tool Export feature to send it directly to Power BI or Tableau for further analysis and enhancements. You can also download the dashboard as a PDF, PNG, or JPEG, embed it on a platform, or invite your team to collaborate.
Note: This is a Pro template. You’ll need a Pro subscription on Mokkup to use and customize this dashboard wireframe. Upgrade anytime to unlock full access.
Christmas Retail Supply & Demand Planner Dashboard Example
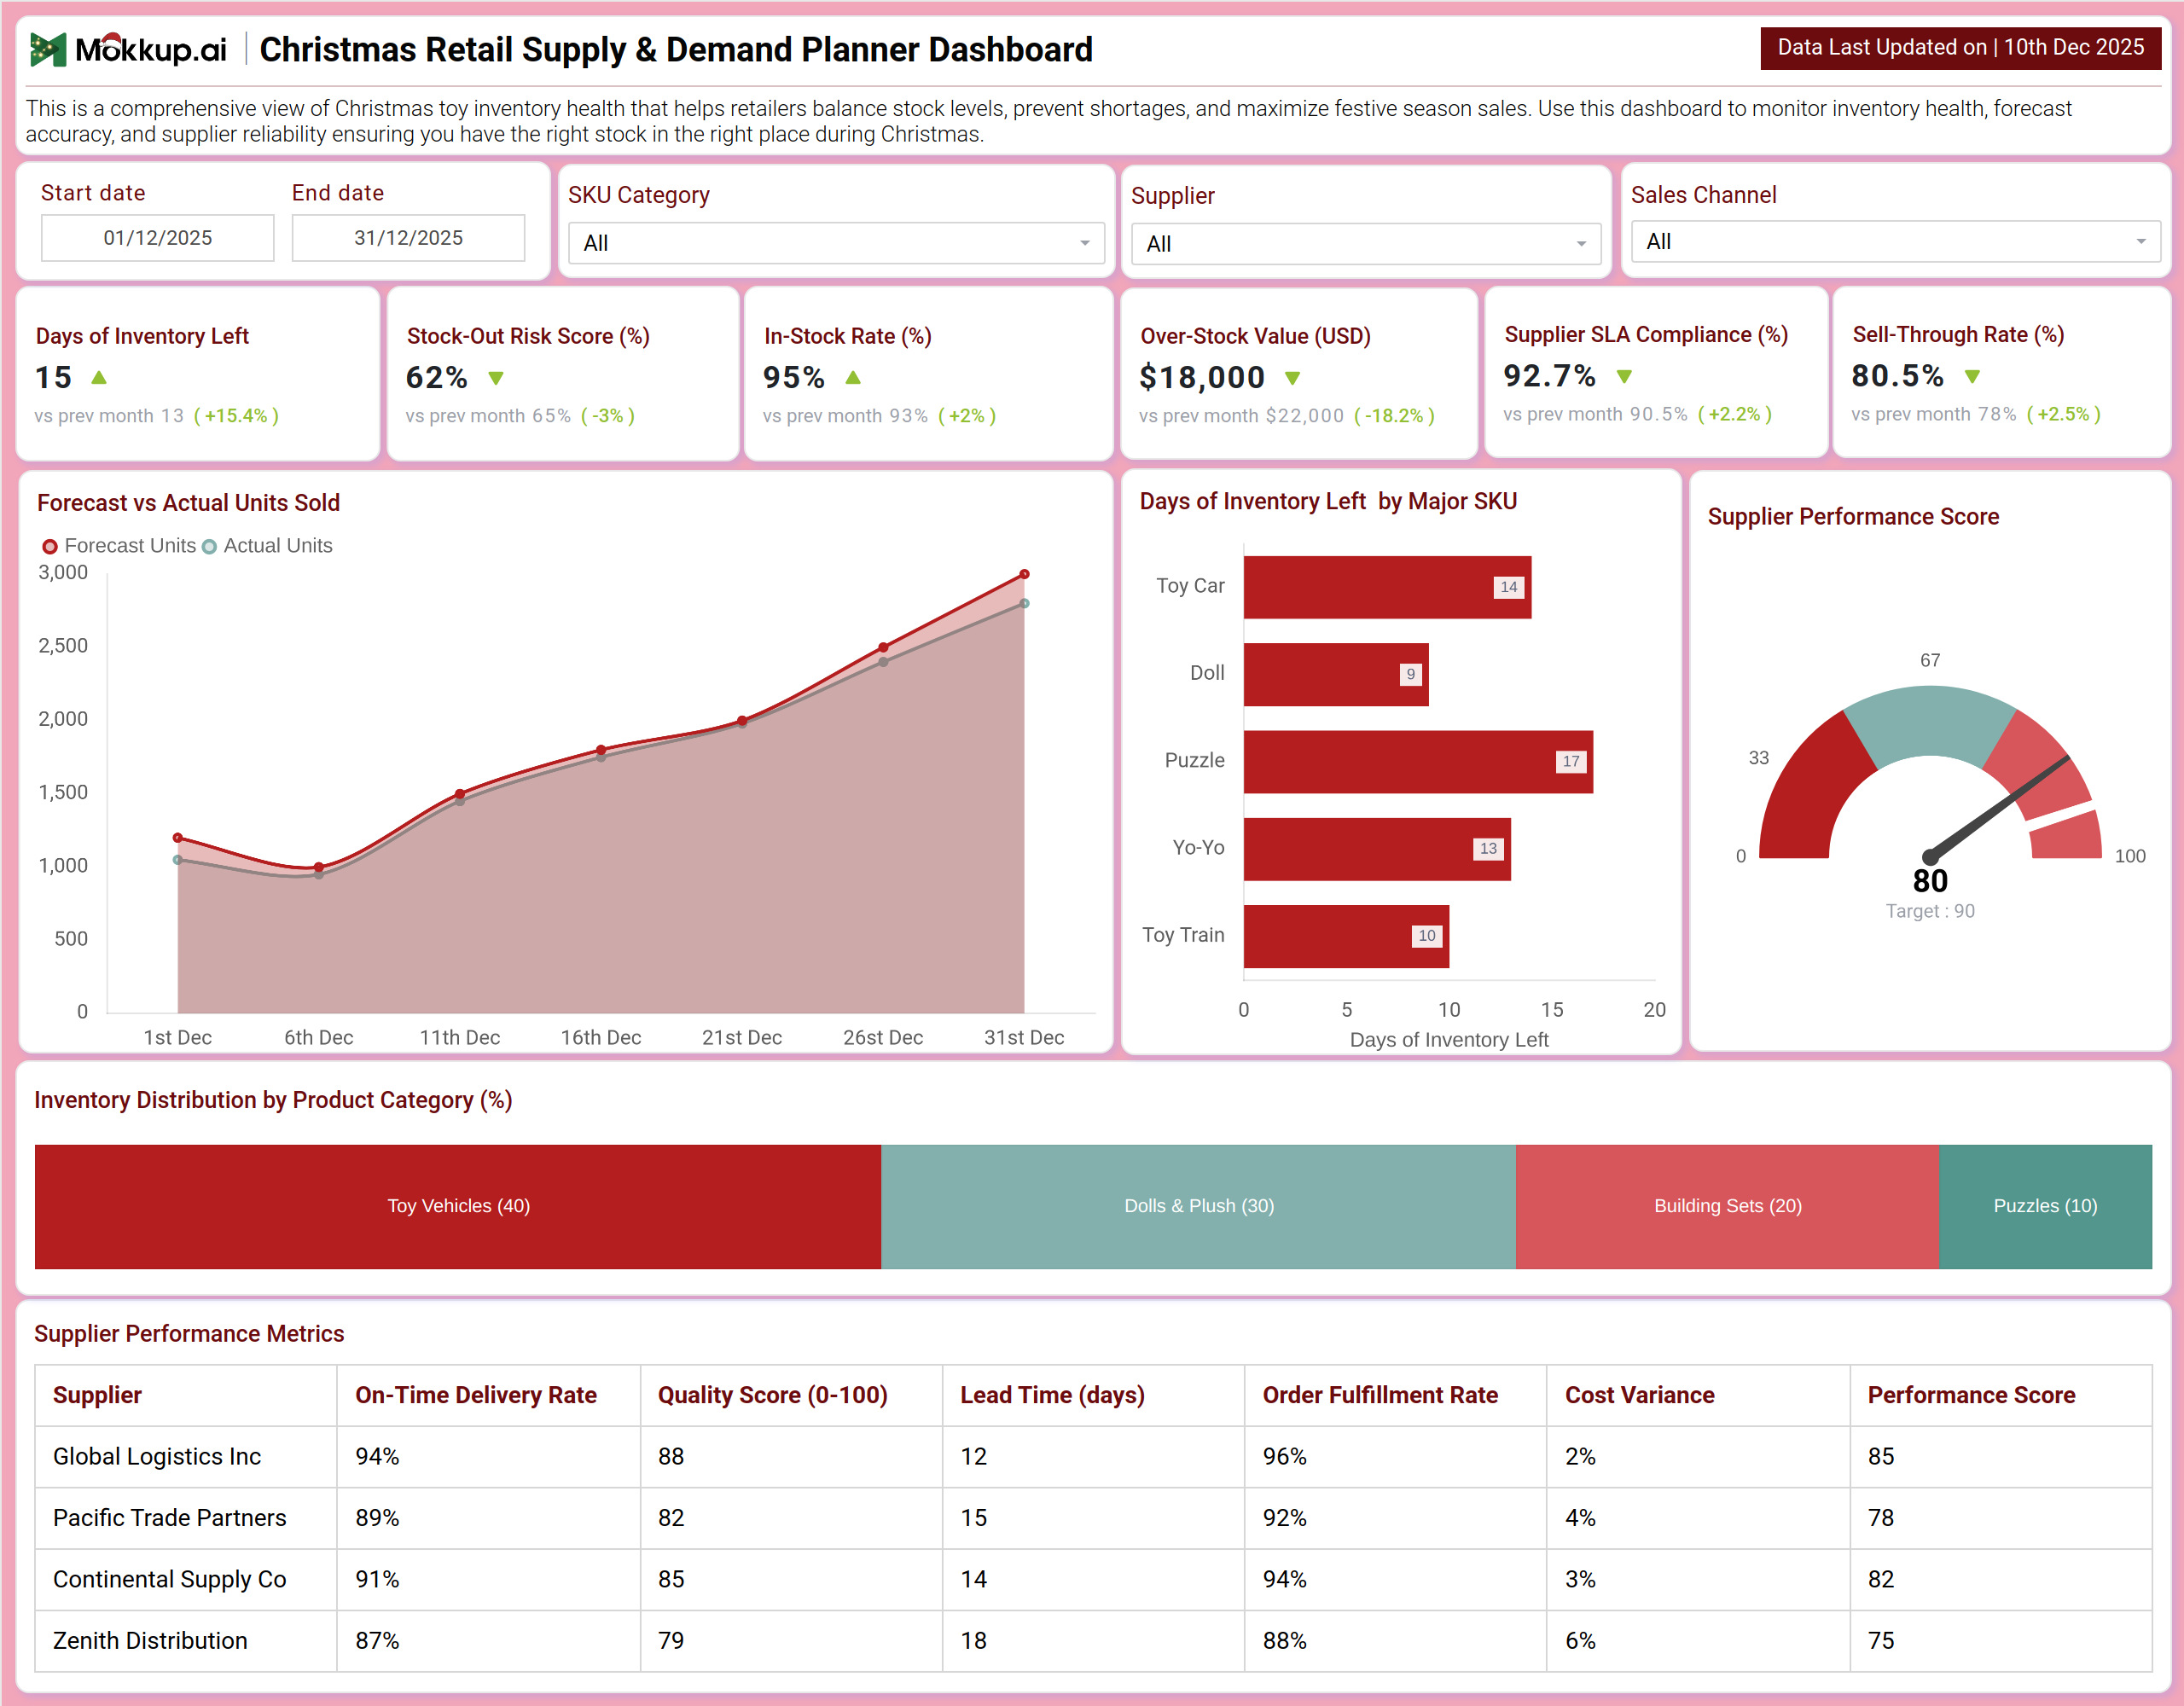
You can create a Christmas Retail Supply & Demand Planner Dashboard that brings together inventory health, demand planning, and supplier operations into a unified view. A typical dashboard includes an Inventory Health Overview section, where users can track In-Stock Rate, Stock-Out Risk Score, and Over-Stock Value. Visual charts like Forecast vs Actual Units Sold reveal the accuracy of demand predictions, while Inventory Distribution by Product Category shows stock allocation. The Supplier & Forecast Analysis section builds on this by displaying a detailed Supplier Performance Metrics table, which includes scores for delivery, quality, and lead time. Together, these modules deliver crucial festive season inventory intelligence, enabling planners to make agile replenishment decisions and hold suppliers accountable for holiday performance.
How to Analyze Data in Christmas Retail Supply & Demand Planner Dashboard
Here is how you can analyze data from this dashboard:
- Inventory Coverage Monitoring: Monitor Days of Inventory Left to understand how long current stock will last at the current sales pace and prioritize reorders.
- Product Availability Tracking: Track In-Stock Rate to measure product availability and ensure customers can consistently find in-demand items.
- Stock-Out Risk Identification: Analyze Stock-Out Risk Score to proactively identify SKUs at high risk of selling out and take preventive replenishment actions.
- Excess Inventory Assessment: Review Over-Stock Value to quantify capital tied up in surplus inventory and identify items suitable for promotions or markdowns.
- Sales Velocity Analysis: Measure Sell-Through Rate to evaluate how quickly inventory converts to sales across categories.
- Supplier Reliability Review: Observe Supplier SLA Compliance to ensure vendors meet delivery timelines and service commitments.
- Forecast Accuracy Evaluation: Study Forecast vs Actual Sales to assess demand planning accuracy and refine future forecasts.
- Category-Level Stock Alignment: Examine Inventory Distribution by Category to ensure stock levels align with seasonal demand patterns.
- Supplier Performance Comparison: Evaluate Supplier Performance Metrics to compare vendors on lead time, quality, and on-time delivery.
Benefits of Christmas Retail Supply & Demand Planner Dashboard
The following are the benefits of using this dashboard:
- Centralized Inventory Visibility: Offers a unified view of inventory health, demand signals, and supplier performance throughout the holiday season.
- Holiday Inventory Optimization: Balances product availability and carrying costs to prevent stockouts and excess inventory.
- Improved Forecast-Driven Decisions: Strengthens Christmas demand forecasting through clear forecast accuracy and trend insights.
- Enhanced Supplier Accountability: Enables festive season supplier performance tracking to ensure reliable replenishment.
- Higher Sales Realization: Minimizes lost sales by ensuring high-demand products remain available throughout the season.
- Integrated Festive Inventory Intelligence: Connects inventory health, demand planning, and supplier reliability in one platform.
- Reduced Manual Planning Effort: Automates inventory and supplier tracking, reducing spreadsheet-driven workflows.
- Financial Control During Peak Season: Helps manage overstock value and improve inventory turnover for healthier margins.
KPIs to Track in Christmas Retail Supply & Demand Planner Dashboard
These KPIs enable retailers to monitor inventory health, demand accuracy, and supplier reliability, ensuring they remain responsive during peak Christmas sales periods.
- In-Stock Rate (%): Measures the percentage of SKUs available for sale.
- Days of Inventory Left: Indicates how long current stock will last based on sales velocity.
- Stock-Out Risk Score: Identifies SKUs at risk of running out during peak demand.
- Over-Stock Value ($): Quantifies the cost of holding excess inventory.
- Sell-Through Rate (%): Tracks how efficiently inventory converts into sales.
- Forecast Accuracy (%): Measures alignment between forecasted and actual sales.
- Supplier SLA Compliance (%): Tracks supplier adherence to delivery and service commitments.
Frequently Asked Questions
Q1. Who should use a Christmas Retail Supply & Demand Planner Dashboard?
Retail planners, buyers, inventory managers, and supply chain teams are managing holiday-season demand.
Q2. How does this dashboard help prevent stockouts during the Christmas season?
It highlights stock-out risk, forecast gaps, and inventory coverage, enabling proactive replenishment.
Q3. Can this dashboard improve supplier performance during peak season?
Yes, it tracks SLA compliance and supplier metrics to hold vendors accountable during periods of high demand.