The Vacation Booking Dashboard Wireframe provides a basic layout for exploring travel destinations across different cities and countries. Users can browse through a selection of destinations, along with essential information about attractions and accommodations. It is designed for simplicity and offers a straightforward platform for planning vacations without complex navigation or interactive elements.
The dashboard wireframe comprises two screens: Recommended Cities, & Best Time to Visit; each is explained briefly below.
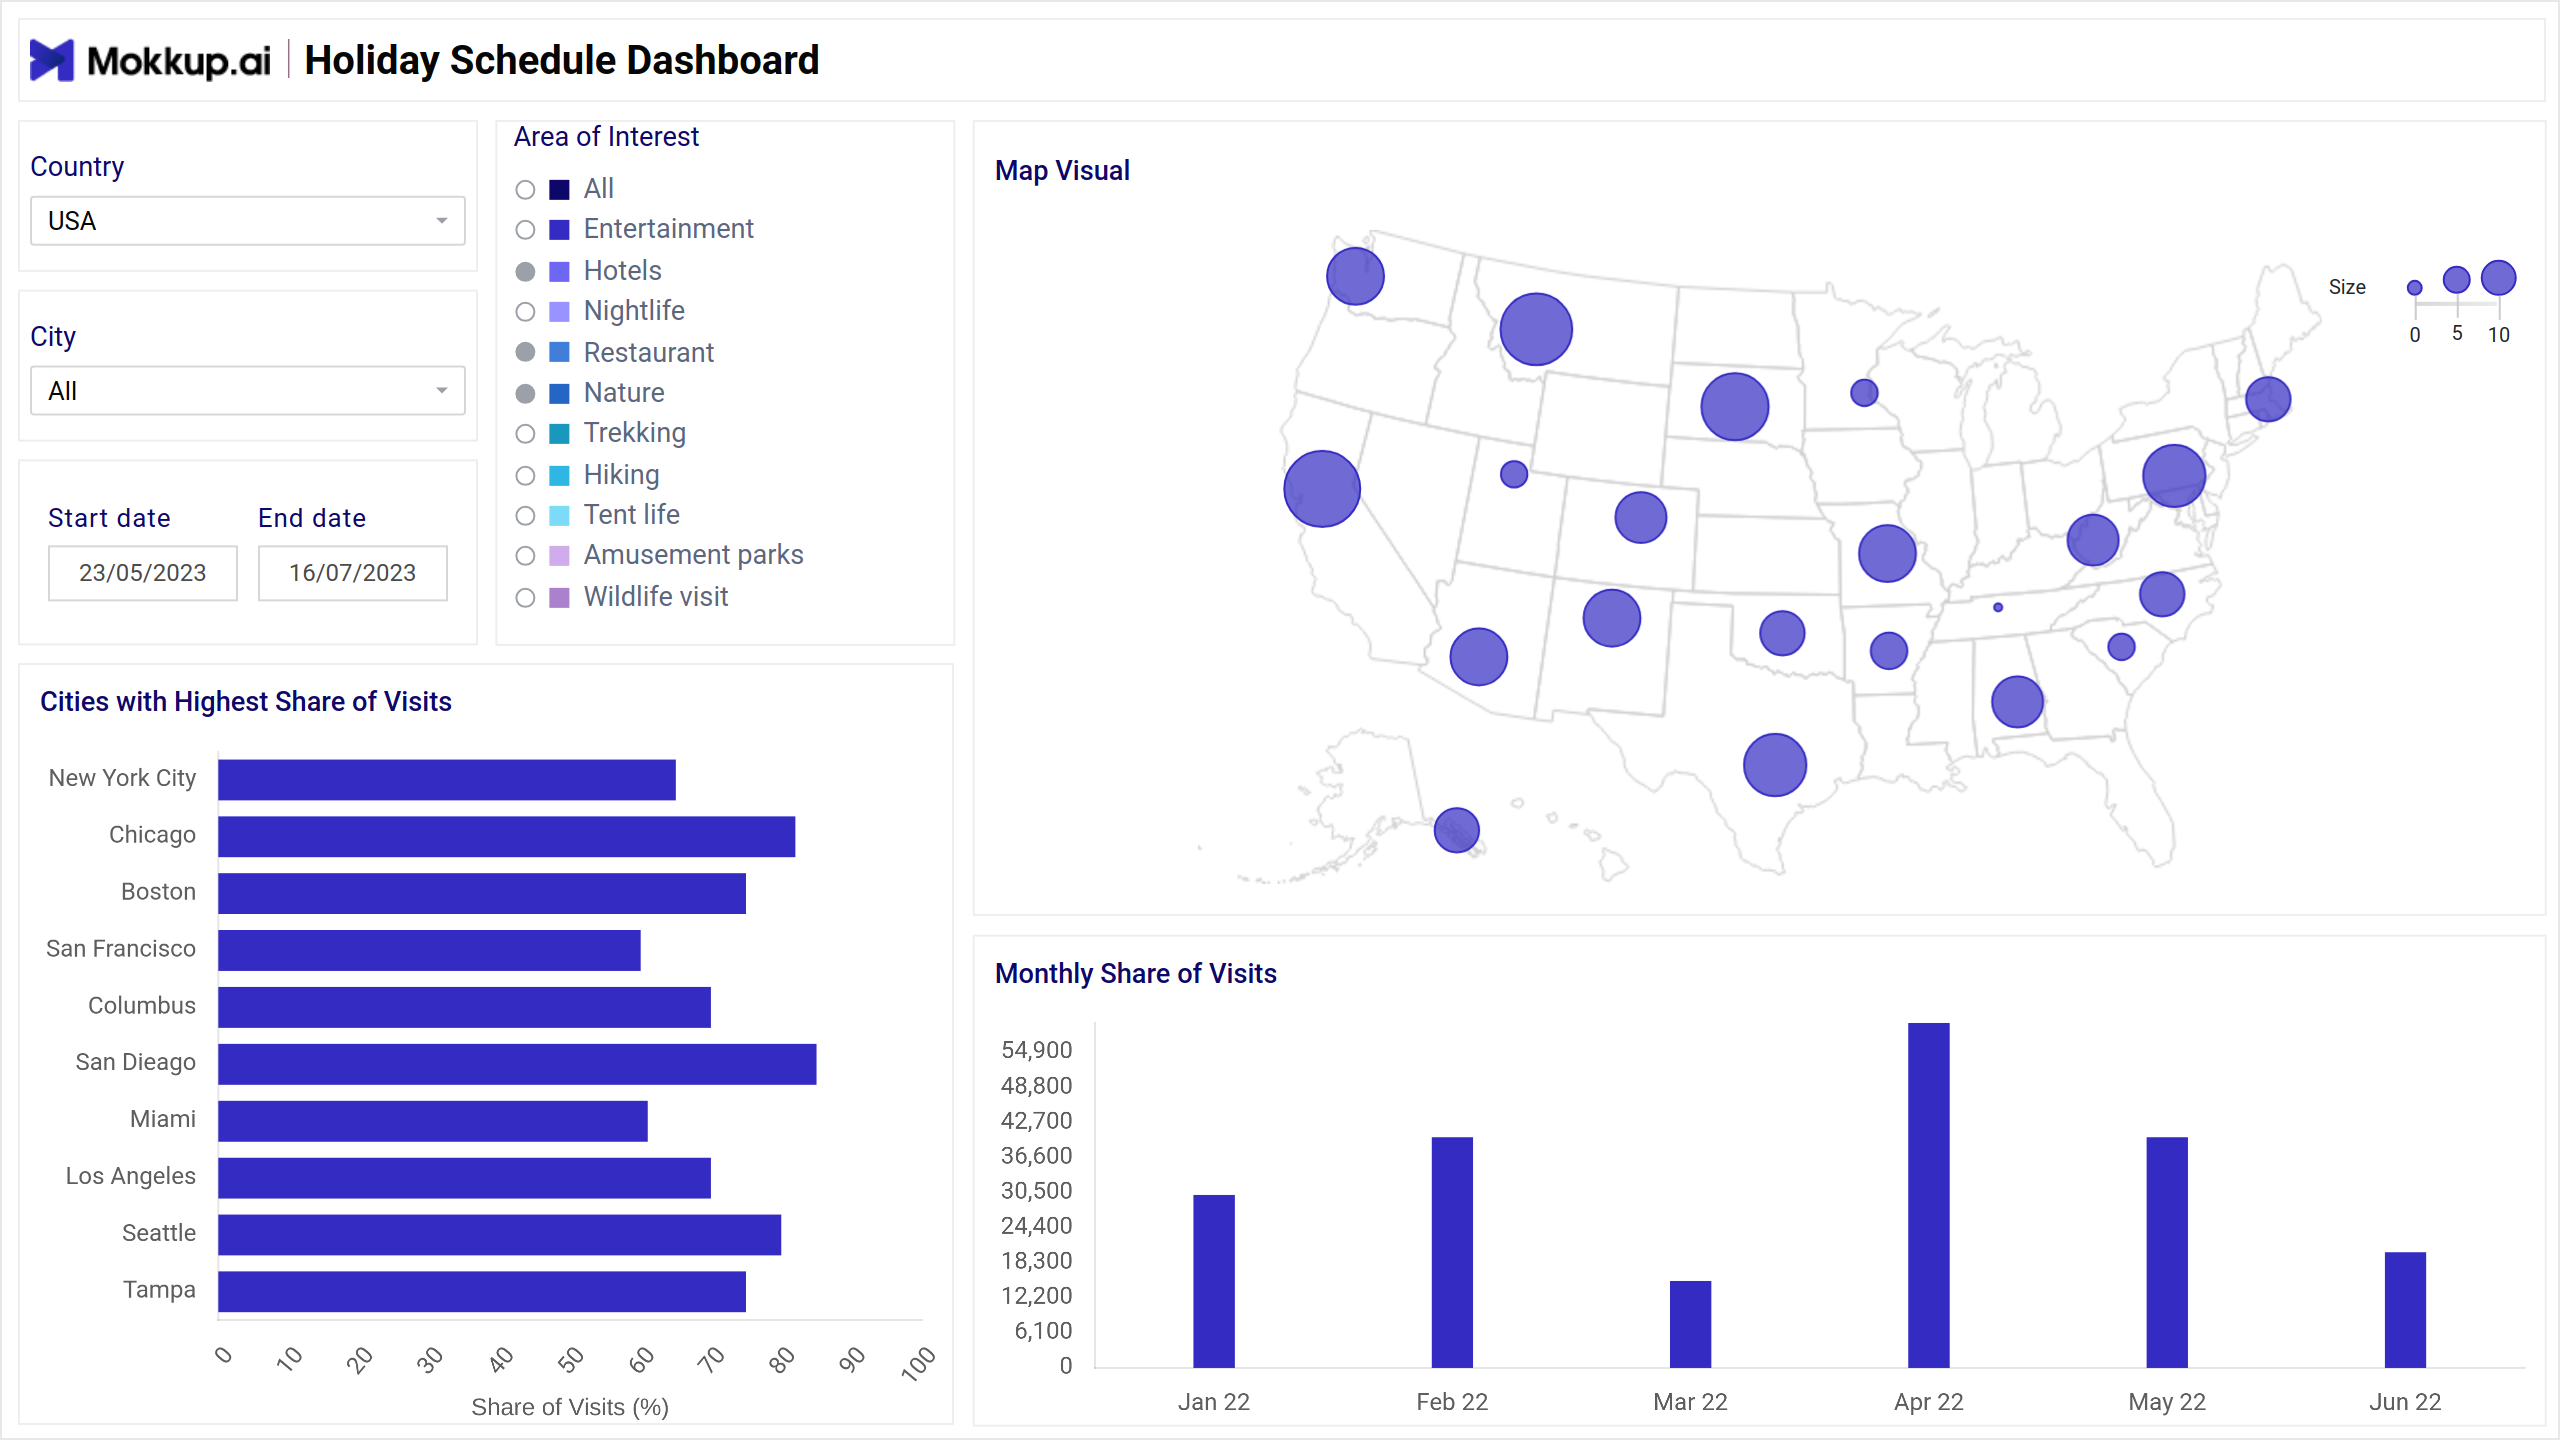
Recommended Cities
This wireframe depicts a vacation booking dashboard that showcases recommended cities for travelers. It highlights popular destinations on a map of the United States alongside a bar graph that contrasts cities with high and low visit rates. The dashboard also includes a section for specifying travel dates and areas of interest, allowing users to refine their searches.
Key Terms to Know
- Area of Interest: Highlights popular destinations or attractions based on user preferences.
- Map Visual: Presents visual representations of the most visited areas within the vacation dashboard.
- Cities with Highest Share of Visits: Identify the cities that attract the most visitors to the platform.
- Monthly Share of Visits: Displays the distribution of visits across different destinations every month.
Best Time to Visit
This wireframe caters to travelers seeking the ideal time to visit various destinations. The dashboard visually represents popularity by month, allowing users to compare visit rates across different locations. Additionally, the wireframe incorporates a calendar and filters to narrow searches by desired locations and areas of interest, including categories like cafes, nightlife, and restaurants.
Key Terms to Know
- Area of Interest: Identifies preferred destinations or attractions based on user preferences.
- Subcategories: Breaks down areas of interest into specific themes or types of attractions.
- List of Places: Provides a catalog of available destinations within the selected area of interest.
- Distribution of Positive Reviews: Visualizes positive feedback spread across various destinations.
- List of Reviews: Presents detailed feedback and comments from users about their experiences at different places.
Dashboard Template Insights
Vacation Booking Dashboard wireframe revolutionizes the way users explore travel destinations, here are some of the Dashboard Template Insights:
- The wireframe facilitates effortless exploration of travel destinations, streamlining the vacation planning process for users.
- By categorizing destinations into subcategories, it enables users to easily discover specific types of attractions or experiences.
- The dashboard provides a comprehensive list of places, offering users detailed information to make informed decisions about their travel plans.
- With the distribution of positive reviews and a list of user reviews, the wireframe empowers users with valuable insights into destination popularity and quality, aiding in decision-making.
Conclusion
In conclusion, the Vacation Booking Dashboard wireframe simplifies the travel planning process by providing easy access to diverse destinations and informative insights. Its structured layout offers users a seamless experience to explore and organize their vacations efficiently. With features like categorized subareas and user reviews, it empowers travelers with the necessary tools to make informed decisions and create memorable experiences.