What is a Solar Irradiance & Forecast Performance Dashboard?
A Solar Irradiance & Forecast Performance Dashboard is a specialized analytics platform used by electric utilities and solar asset operators to measure how sunlight availability, weather conditions, and forecast accuracy influence energy production. This type of dashboard captures real-time and historical irradiance patterns, evaluates forecast deviation, and analyzes effective sun hours to help utilities predict generation more accurately. By combining metrics such as GHI, peak irradiance, cloud cover influence, and forecast error ranges, it acts as a complete solar irradiance and forecast performance monitoring dashboard for both operational and planning teams. It enables asset managers to assess how environmental factors impact output reliability, supporting improved energy scheduling, grid planning, and operational efficiency.
How to Create a Solar Irradiance & Forecast Performance Dashboard
You don't need to design your dashboard from scratch. Simply begin with a pre-built Solar Irradiance & Forecast Performance Dashboard template from Mokkup. Customize it with your specific data and export it for use. Here’s how:
1. Create or Log in to Your Mokkup Account
Start by signing up on Mokkup.ai using your email. If you already have an account, just log in, and you’ll be good to go.
2. Choose and Customize Your Dashboard Template
Find the Solar Irradiance & Forecast Performance Dashboard template in the Templates section. Use the drag-and-drop editor to adjust KPIs, edit filters, or add elements based on your data.
3. Export to Your BI Tool
Once your dashboard wireframe is ready, use the BI Tool Export feature to send it directly to Power BI or Tableau for further analysis and enhancements. You can also download the dashboard as a PDF, PNG, or JPEG, embed it on a platform, or invite your team to collaborate.
Note: This is a Pro template. You’ll need a Pro subscription on Mokkup to use and customize this dashboard wireframe. Upgrade anytime to unlock full access.
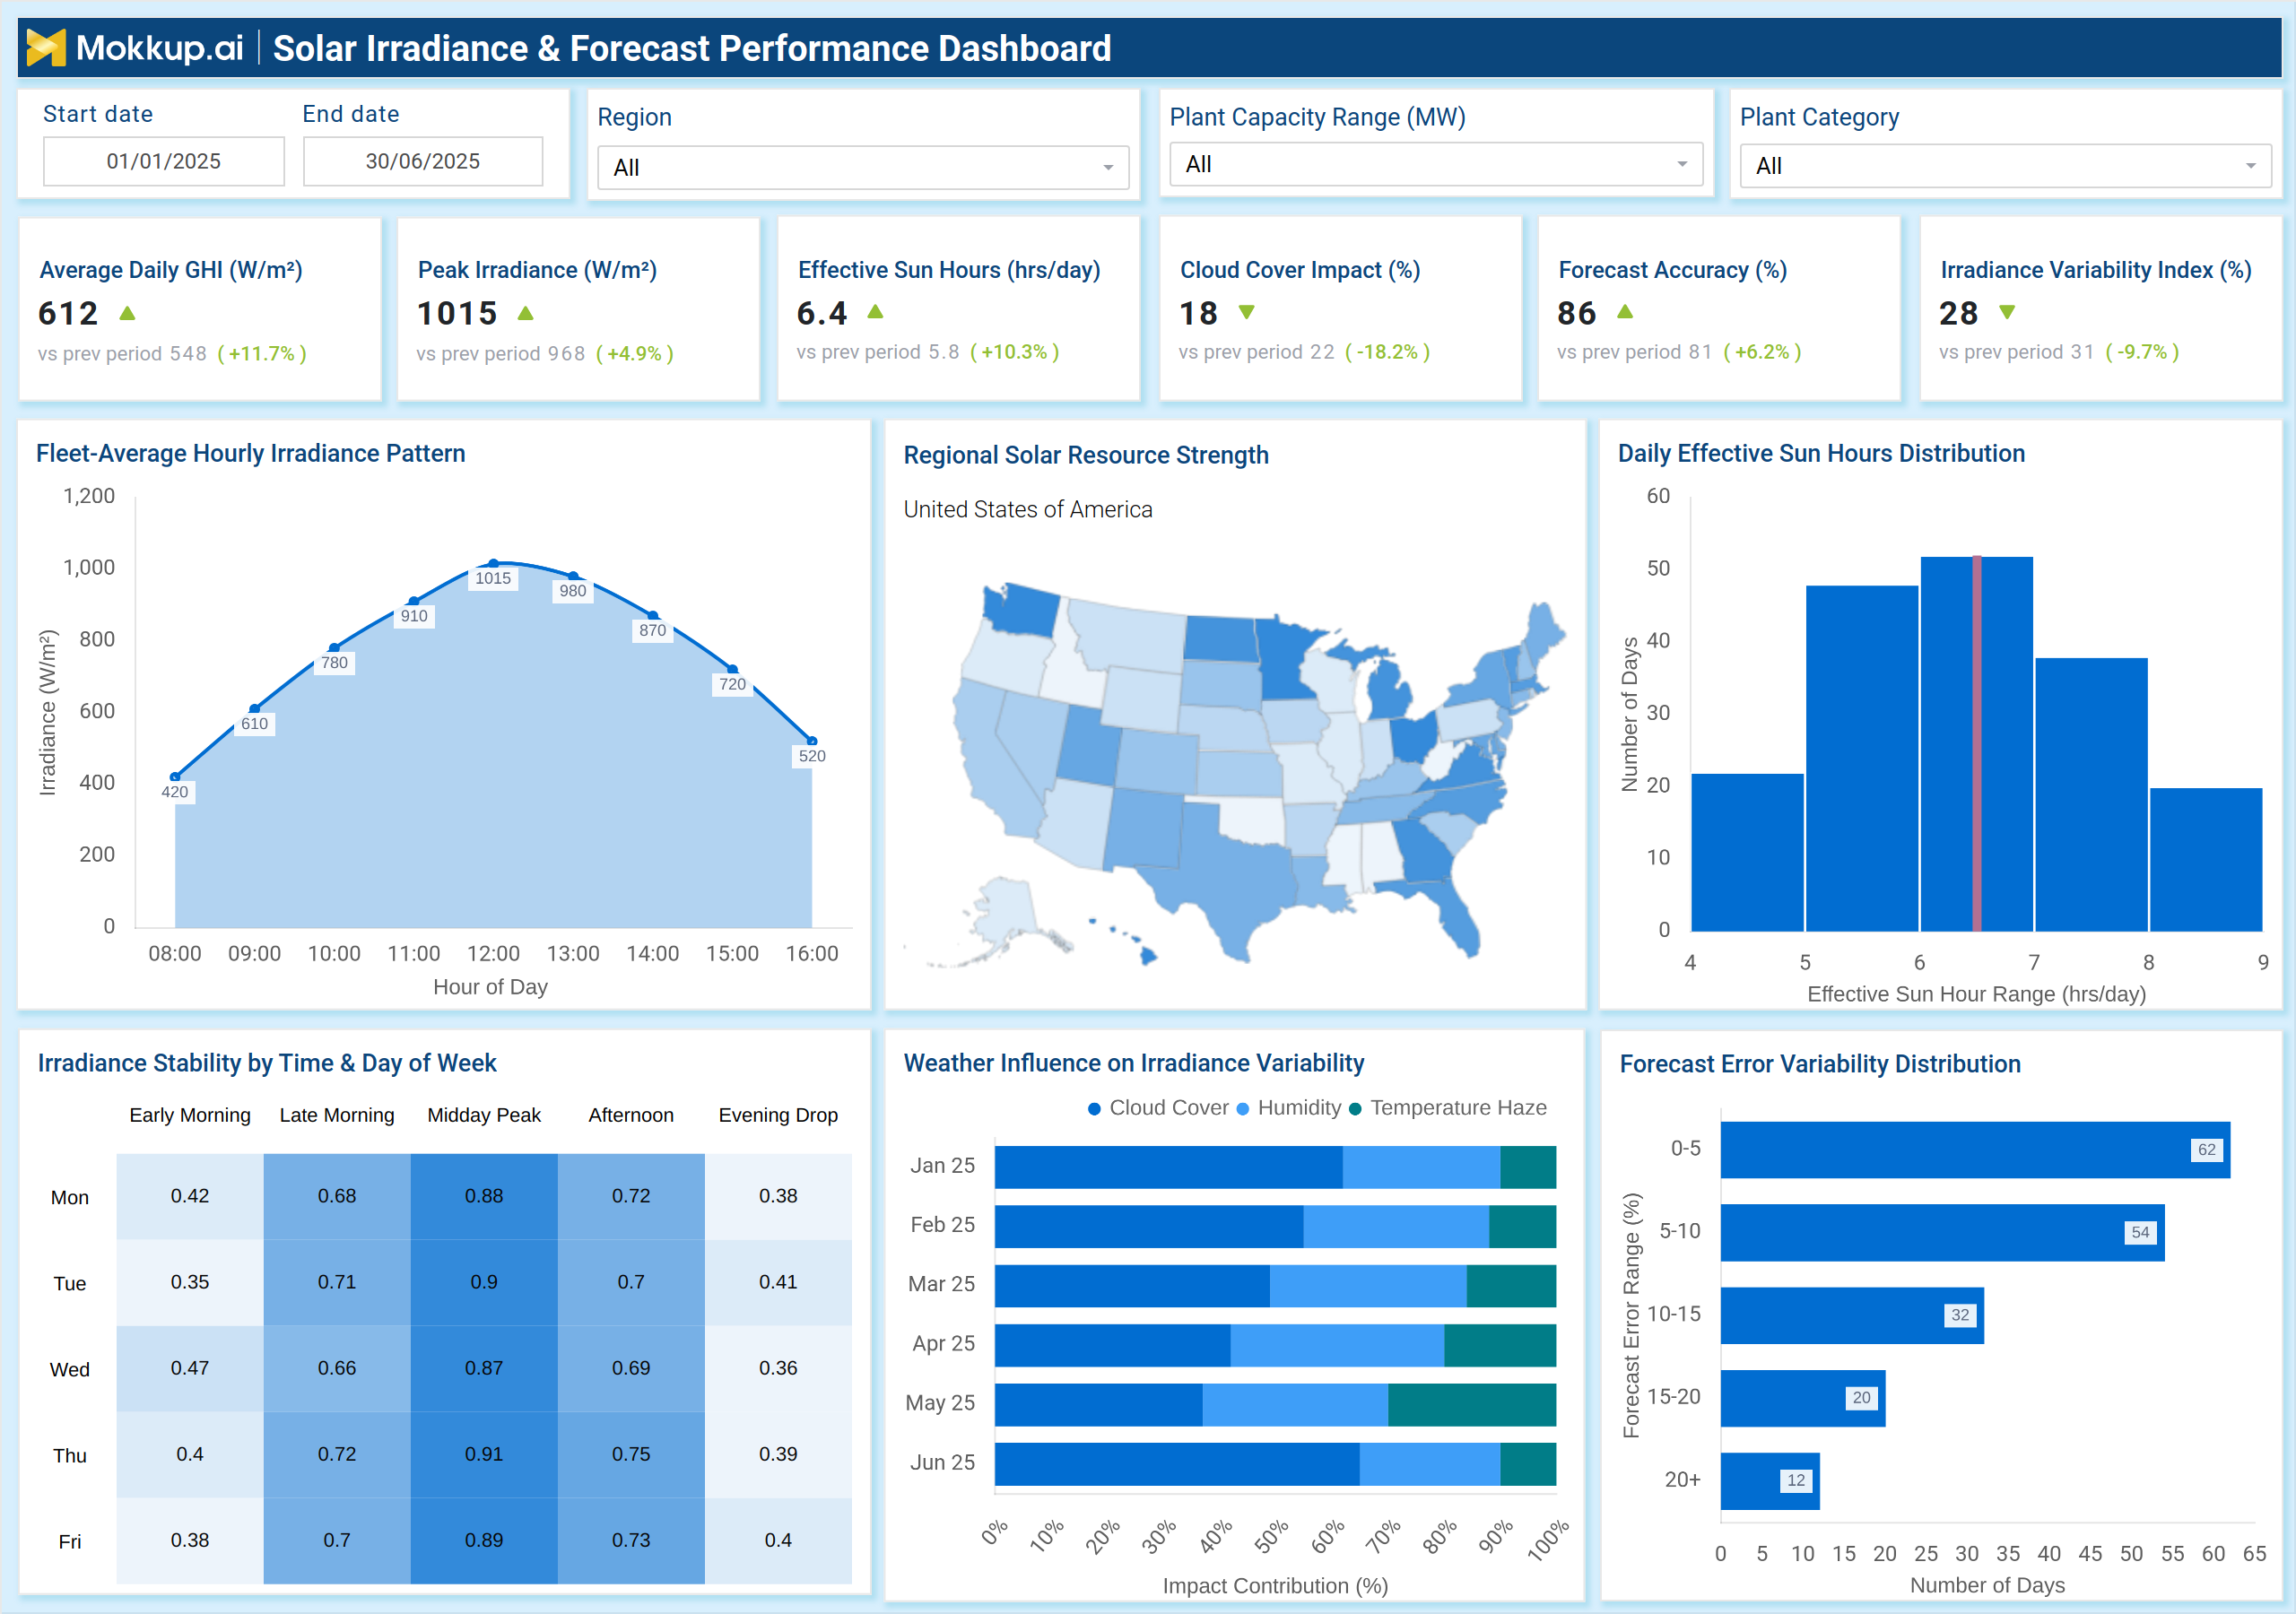
Solar Irradiance & Forecast Performance Dashboard Example
The dashboard example above gives utilities a clear view of irradiance behavior and forecasting performance across multiple regions and plant categories. Core KPIs such as Average Daily GHI, Peak Irradiance, Effective Sun Hours, Cloud Cover Impact, Forecast Accuracy, and Irradiance Variability Index help teams evaluate sunlight strength and predictability. Trend visuals, such as the Fleet-Average Hourly Irradiance Pattern, display daily irradiance curves, while the Regional Solar Resource Strength map highlights geospecific potential.
The histogram for Effective Sun Hours distribution explains seasonal and daily changes in usable sunlight. Additional visuals analyze weather influence on irradiance variability, including humidity, cloud cover, and temperature haze. The forecast error variability chart assesses the variability in actual generation compared to predicted values, thereby supporting the accuracy and performance of solar power irradiance forecasting and the dashboard functions. Together, these insights form a complete utility-scale solar irradiance analytics and yield forecast tool for energy planners and operators.
How to Analyze Data in Solar Irradiance & Forecast Performance Dashboard
Here is how you can analyze data from the solar power irradiance forecasting accuracy and performance dashboard:
- Review Average Daily GHI: Understand overall irradiation levels and compare month-over-month changes.
- Track Peak Irradiance: Identify the hours with the strongest sunlight and verify alignment with expected energy production.
- Monitor Effective Sun Hours: Evaluate the number of usable sunlight hours that support generation each day.
- Assess Cloud Cover Impact: Analyze weather disruptions and their influence on overall irradiance.
- Study Daily Irradiance Patterns: Use hourly curves to see when irradiance rises, peaks, and drops across the fleet.
- Analyze Regional Resource Strength: Compare geographic irradiance availability for planning and grid dispatch.
- Evaluate Weather Influence: Determine how humidity, temperature, haze, and cloud cover drive irradiance variability.
- Check Forecast Error Distribution: Identify significant gaps between forecasted and actual irradiance to improve prediction models.
- Track Irradiance Variability Index: Analyze stability versus volatility of irradiance across days and seasons.
Benefits of Solar Irradiance & Forecast Performance Dashboard
Here is how renewable energy irradiance evaluation and forecast deviation tracking can be useful:
- Improves forecast accuracy by comparing predicted vs actual irradiance levels.
- Supports generation scheduling with clear insights into daily and hourly irradiance trends.
- Enhances planning decisions by comparing geographic irradiance across regions.
- Reduces forecasting risks by highlighting weather-related drivers of irradiance variability.
- Optimizes grid reliability by providing better predictions of solar output fluctuations.
- Helps identify performance deviation using forecast error distribution metrics.
- Enables better asset utilization by understanding effective sun hour distribution.
- Improves renewable energy integration through detailed resource availability analytics.
- Supports long-term modeling for capacity expansion and operational planning.
KPIs to Track in Solar Irradiance & Forecast Performance Dashboard
The following key KPIs can be tracked by using the electric utility solar irradiance trend and forecast reliability dashboard:
- Average Daily GHI (W/m²): Measures overall solar resource strength.
- Peak Irradiance (W/m²): Identifies maximum sunlight intensity during the day.
- Effective Sun Hours (hrs/day): Represents usable sunlight contributing to generation.
- Cloud Cover Impact (%): Shows how cloudiness reduces irradiance availability.
- Forecast Accuracy (%): Measures prediction reliability for generation scheduling.
- Irradiance Variability Index (%): Indicates the day-to-day stability or fluctuation of irradiance.
- Hourly Irradiance Pattern: Tracks the progression of sunlight to optimize operating windows.
- Weather-Driven Impact Contribution: Quantifies the influence of humidity, haze, and clouds on irradiance.
- Forecast Error Range Distribution: Evaluates the deviation between forecasted and actual values.
- Regional Resource Strength Score: Assesses solar potential across regions or states.
Frequently Asked Questions
1. Who uses a Solar Irradiance & Forecast Performance Dashboard?
Power utilities, IPPs, grid operators, solar asset managers, forecasting teams, and renewable planning units.
2. Why is irradiance forecasting accuracy important?
It directly affects scheduling, power purchasing, curtailment planning, and grid balancing.
3. What causes irradiance variability?
Cloud transitions, humidity, temperature, haze, seasonal shifts, and unpredictable weather changes.