
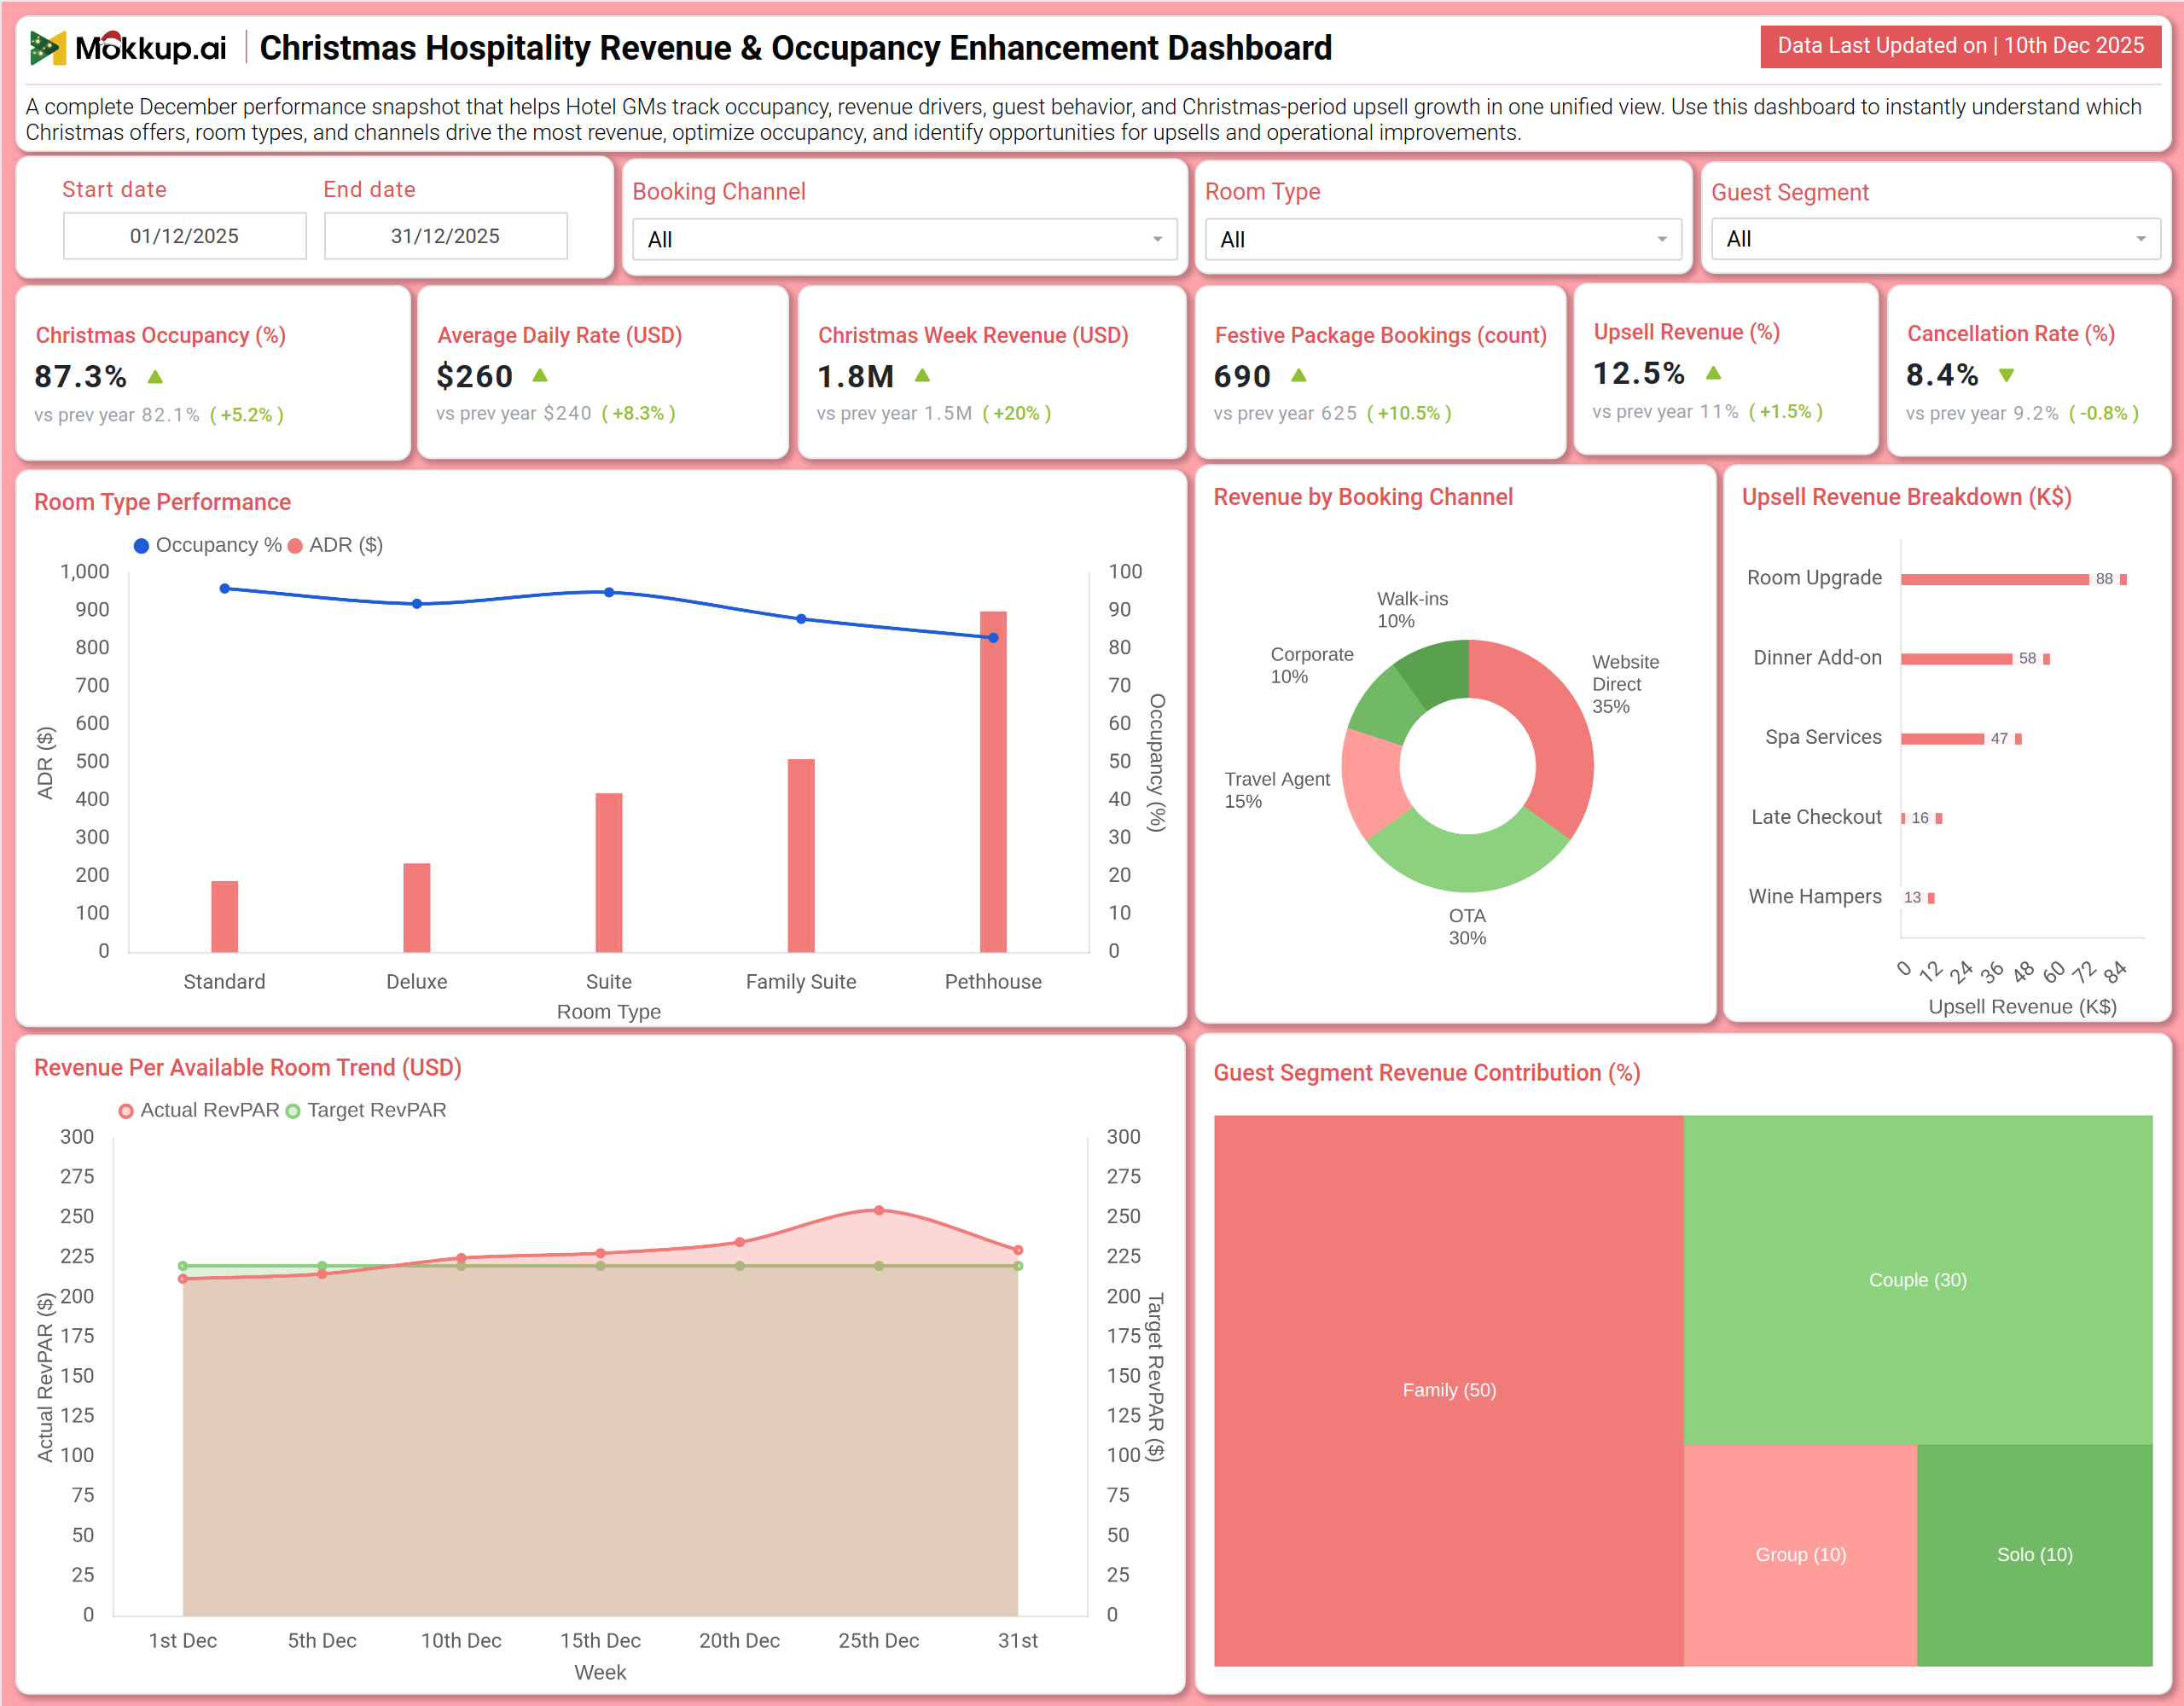
What is a Christmas Hospitality Revenue & Occupancy Enhancement Dashboard?
A Christmas Hospitality Revenue & Occupancy Enhancement Dashboard is a specialized performance management tool designed to track and maximize hotel profitability and guest engagement during the festive season. It consolidates key metrics such as occupancy, average daily rate, revenue, and upsell performance into a single visual platform. By integrating Christmas hotel occupancy analytics, festive period revenue optimization, and holiday guest package tracking, the dashboard enables hotel general managers and revenue teams to optimize pricing, identify high-value booking channels, and refine upsell strategies. The dashboard serves as a central hub for monitoring revenue per available room (RevPAR) trends, evaluating room type performance, and understanding guest segment contributions to inform seasonal decisions.
How to Create a Christmas Hospitality Revenue & Occupancy Enhancement Dashboard
You don’t need to build your report from scratch—just start with a ready-to-use dashboard template from Mokkup. Add in your data and export it however you like. Here’s how to do it:
1. Create or Log in to Your Mokkup Account
Start by signing up on Mokkup.ai using your email. If you already have an account, just log in, and you’ll be good to go.
2. Choose and Customize Your Dashboard Template
Find the Christmas Hospitality Revenue & Occupancy Enhancement Dashboard template in the Templates section. Use the drag-and-drop editor to adjust KPIs, edit filters, or add elements based on your data.
3. Export to Your BI Tool
Once your dashboard wireframe is ready, use the BI Tool Export feature to send it directly to Power BI or Tableau for further analysis and enhancements. You can also download the dashboard as a PDF, PNG, or JPEG, embed it on a platform, or invite your team to collaborate.
Note: This is a Pro template. You’ll need a Pro subscription on Mokkup to use and customize this dashboard wireframe. Upgrade anytime to unlock full access.
Christmas Hospitality Revenue & Occupancy Enhancement Dashboard Example
You can create a Christmas Hospitality Revenue & Occupancy Enhancement Dashboard that brings together occupancy performance, revenue drivers, and guest behavior into a unified view. A typical dashboard includes a Performance Overview section, where users can track Christmas Occupancy, Average Daily Rate (ADR), and Christmas Week Revenue. Visual charts like Room Type Performance and Revenue by Booking Channel reveal which offerings and sales avenues are most profitable. The Revenue & Upsell Analysis section builds on this by displaying an Upsell Revenue Breakdown by type (e.g., Room Upgrade, Spa Services) and a trend line for Revenue Per Available Room (RevPAR) against targets. Together, these modules deliver crucial hospitality performance benchmarking for the holidays, enabling teams to adjust strategies in real-time for maximum seasonal yield.
How to Analyze Data in the Christmas Hospitality Revenue & Occupancy Enhancement Dashboard
Here is how you can analyze data from this Christmas hospitality revenue dashboard:
- Monitor Christmas Occupancy – Track overall room demand and utilization levels during the festive season to understand how well your inventory is being filled.
- Track Average Daily Rate (ADR) – Measure the average revenue earned per occupied room per day to evaluate the effectiveness of your Christmas pricing strategy.
- Analyze Christmas Week Revenue – Review total revenue generated during the peak holiday week to assess overall festive financial performance.
- Review Festive Package Bookings – Evaluate the uptake and popularity of bundled holiday packages and guest experience offers.
- Measure Upsell Revenue Percentage – Understand how successful your hotel is at generating incremental revenue through upgrades and add-on services.
- Observe Cancellation Rate – Monitor booking stability and identify potential risks that could impact revenue forecasts during the festive rush.
- Study Room Type Performance – Identify which room categories (such as Suites or Family Rooms) deliver the highest room occupancy and ADR during Christmas.
- Examine Revenue by Booking Channel – Determine which channels, such as direct bookings or OTAs, contribute the most valuable festive-season revenue.
- Evaluate Upsell Revenue Breakdown – Analyze which add-ons (for example, late checkout or festive hampers) generate the highest incremental income.
- Assess RevPAR Trend – Track Revenue Per Available Room over time to measure overall revenue efficiency against daily or weekly targets.
Benefits of Christmas Hospitality Revenue & Occupancy Enhancement Dashboard
The following are the benefits of using this dashboard:
- Centralized Festive Performance Visibility – Provides a single view of critical Christmas metrics, including occupancy, ADR, packages, and upsells.
- Improved Christmas Occupancy Analytics – Supports data-driven pricing and inventory decisions during high-demand festive periods.
- Smarter Revenue Optimization – Enables more transparent decision-making to maximize holiday revenue across room types and booking channels.
- Enhanced Holiday Package Tracking – Helps measure the success of Christmas bundles, promotions, and exceptional guest experiences.
- Higher Profitability – Drives better margins through optimized pricing, effective upselling, and balanced channel mix.
- Stronger Holiday Benchmarking – Allows year-over-year performance comparisons to evaluate festive season growth.
- Reduced Manual Reporting Effort – Saves time during peak season by consolidating all key metrics into automated reports.
- Proactive Target Alignment – Continuously tracks RevPAR trends to help teams adjust strategies and stay aligned with revenue goals.
KPIs to Track in Christmas Hospitality Revenue & Occupancy Enhancement Dashboard
The following key KPIs can be tracked by using this dashboard:
- Christmas Occupancy (%): The percentage of available rooms that are occupied during the holiday period.
- Average Daily Rate (USD): The average rental income per occupied room in a given day.
- Christmas Week Revenue (USD): The total room revenue generated during the peak holiday week.
- Feature Package Bookings (count): The number of bookings that include a special festive package or bundle.
- Upsell Revenue (%): The percentage of total revenue generated from ancillary sales like upgrades, spa, or dining.
- Cancellation Rate (%): The percentage of bookings that are cancelled relative to total bookings made.
- Revenue Per Available Room (RevPAR): A key performance indicator calculated by multiplying ADR by Occupancy rate.
- Booking Channel Revenue Contribution (%): The breakdown of total revenue attributed to different sales channels.
Frequently Asked Questions
1. What is the purpose of this hospitality dashboard?
It helps hotel managers and revenue teams comprehensively monitor and optimize financial performance, guest bookings, and ancillary revenue during the competitive Christmas season.
2. Can the dashboard show which room types are most profitable?
Yes. The Room Type Performance chart visualizes both occupancy and ADR for each category, highlighting the most lucrative room types.
3. How does the dashboard help with marketing spend?
By showing Revenue by Booking Channel, it identifies which marketing and distribution channels deliver the highest return, allowing for smarter budget allocation.
4. Does it track the success of holiday packages?
Yes. The Feature Package Bookings metric and Upsell Revenue Breakdown specifically track the performance of festive offers and add-ons.
5. Who uses this dashboard?
Hotel General Managers, Revenue Managers, Directors of Sales, Front Office Managers, and Marketing Directors.