
What is a Hospitality Performance Tracker Dashboard?
A Hospitality Performance Tracker Dashboard template is used by hotels, resorts, and hospitality businesses to monitor key operational and financial metrics in one place. It tracks occupancy rates, average daily rate (ADR), revenue per available room (RevPAR), guest satisfaction scores, and booking sources. This dashboard template helps managers understand business performance, identify trends, and make data-driven decisions to improve guest experience, increase revenue, and optimize resource use.
Hospitality Performance Dashboard Example
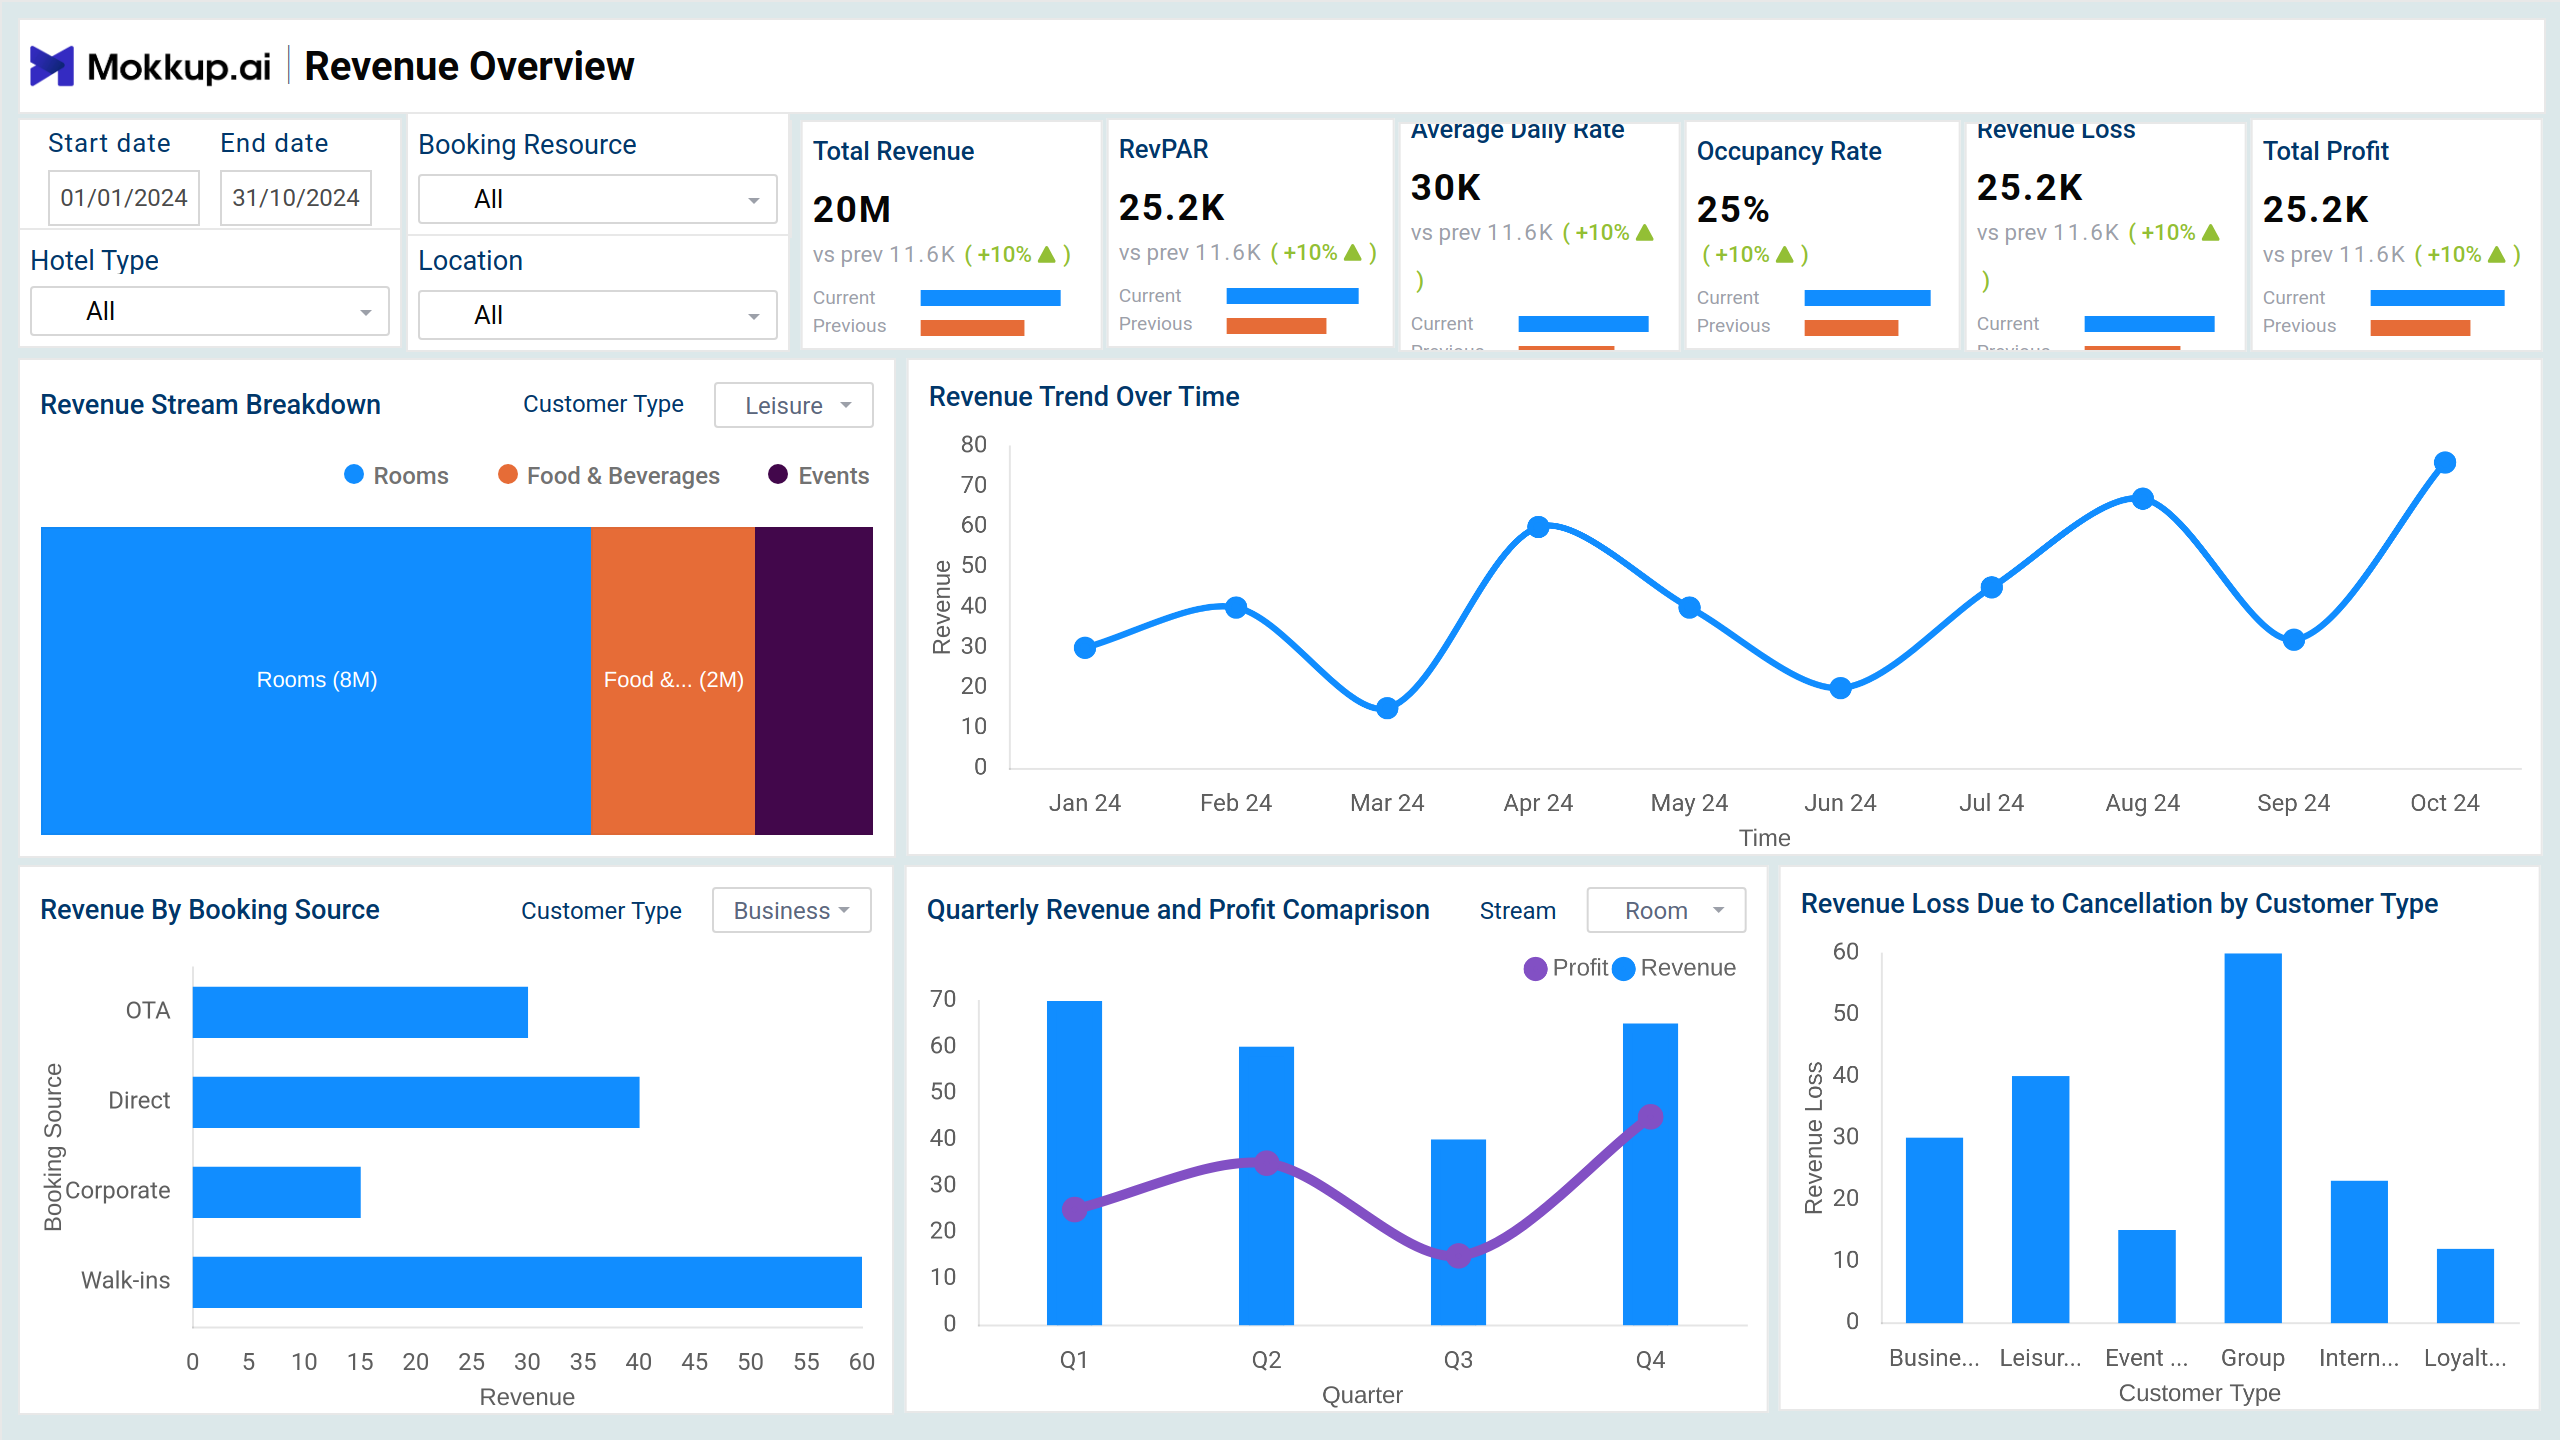
The Hospitality Performance Dashboard template gives hotel managers a clear view of daily operations and revenue trends. It displays key metrics like occupancy rate, average daily rate (ADR), revenue per available room (RevPAR), and guest satisfaction in one centralized layout. Designed for front-office teams and executives, this dashboard wireframe helps monitor booking performance, understand customer preferences, and make quick decisions to boost occupancy and profitability.
How to Analyze Data in Hospitality Dashboards
Use this dashboard template to monitor revenue, guest behavior, and key KPIs. It helps hotel teams make data-driven decisions to boost profit and occupancy.
- Track total revenue, RevPAR, ADR, and occupancy trends. Use filters like hotel type and location to identify high-performing segments and spot revenue leaks through visual breakdowns.
- Analyze customer types, room categories, and lead times. Filters help segment data by hotel or region. Visuals highlight guest spend, cancellation rates, and top-performing room types for better targeting.
How to Create a Hospitality Performance Dashboard
You don’t need to build your report from scratch—just start with a ready-to-use sample Hospitality Performance Dashboard template from Mokkup. Add in your data and export it however you like. Here’s how to do it:
1. Create or Log in to Your Mokkup Account
Start by signing up on Mokkup.ai using your email. Already have an account? Just log in, and you’re good to go.
2. Choose and Customize Your Dashboard Template
Find the Hospitality Performance Dashboard in the Templates section. Use the drag-and-drop editor to adjust KPIs, edit filters, or add elements based on your data.
3. Export to Your BI Tool
Once your dashboard wireframe is ready, use the BI Tool Export feature to send it directly to Power BI or Tableau for further analysis and enhancements. You can also download the dashboard as a PDF, PNG, or JPEG, embed it on a platform, or invite your team to collaborate.
Note: This is a Pro template. To use and customize this dashboard wireframe, you’ll need a Pro subscription on Mokkup. Upgrade anytime to unlock full access.
Benefits of Hospitality Performance Dashboards
Hospitality Performance Dashboards offer a streamlined way to monitor and improve hotel operations. Here are some key benefits:
- Real-Time Visibility: Track real-time occupancy, revenue, and guest trends to respond quickly to changing conditions.
- Data-Driven Decisions: Use visual insights to adjust pricing, marketing, and staffing based on performance metrics.
- Improved Guest Experience: Identify service gaps through satisfaction scores and reviews to enhance customer service.
- Revenue Optimization: Monitor RevPAR, ADR, and booking trends to maximize profitability across seasons and room types.
- Operational Efficiency: Keep tabs on cancellations, overbookings, and housekeeping schedules to streamline daily operations.
These dashboards help hotel teams stay ahead of market demands while ensuring high guest satisfaction and sustained revenue growth.
KPIs to Track in Hospitality Dashboards
Tracking the right KPIs is essential for understanding hotel performance and optimizing operations. These metrics help evaluate revenue, guest behavior, and booking trends.
- Total Revenue: Represents the overall income generated by the hotel during a selected period, giving a snapshot of financial performance.
- RevPAR (Revenue Per Available Room): Measures how much revenue is earned per available room, helping assess room performance and occupancy efficiency.
- Average Daily Rate (ADR): Tracks the average income per room sold, which helps evaluate pricing strategies and market competitiveness.
- Occupancy Rate: Indicates the percentage of rooms occupied, showing how well the hotel converts availability into sales.
- ADR Per Room: Provides a more detailed view of average rates by room type, aiding in pricing and room-level profitability analysis.
- Average Lead Time: Shows how far in advance guests book rooms, offering insights into booking behavior and early reservation trends.
- Cancellation Rate: Tracks the percentage of bookings canceled, helping assess the effectiveness of booking policies and guest retention efforts.
Frequently Asked Questions
Q1. What is a Hospitality Performance Dashboard used for?
It helps track revenue, occupancy, and guest behavior to optimize hotel operations and boost profitability.
Q2. Which KPIs should I focus on?
To assess performance and efficiency, focus on Total Revenue, RevPAR, ADR, Occupancy Rate, and Cancellation Rate.
Q3. How can this dashboard improve business decisions?
It highlights revenue trends, guest segments, and booking behavior, supporting smarter pricing, marketing, and operational strategies.