What is a Christmas E-Commerce Digital Performance Dashboard?
A Christmas E-Commerce Digital Performance Dashboard is a specialized analytics tool designed to track and optimize the holiday shopping journey, from the first click to the final purchase. It consolidates key metrics, such as website sessions, conversion rates, revenue, and customer behavior, into a single visual platform. By integrating holiday shopping funnel analysis, festive season conversion rate tracking, and Christmas product performance insights, the dashboard helps e-commerce managers identify drop-off points, capitalize on top-selling items, and maximize seasonal revenue. The dashboard serves as a central command center for monitoring traffic trends, analyzing device usage, and evaluating the effectiveness of marketing channels during the critical festive period.
How to Create a Christmas E-Commerce Digital Performance Dashboard
You don’t need to build your report from scratch—just start with a ready-to-use dashboard template from Mokkup. Add in your data and export it however you like. Here’s how to do it:
1. Create or Log in to Your Mokkup Account
Start by signing up on Mokkup.ai using your email. If you already have an account, just log in, and you’ll be good to go.
2. Choose and Customize Your Dashboard Template
Find the Christmas E-Commerce Digital Performance Dashboard template in the Templates section. Use the drag-and-drop editor to adjust KPIs, edit filters, or add elements based on your data.
3. Export to Your BI Tool
Once your dashboard wireframe is ready, use the BI Tool Export feature to send it directly to Power BI or Tableau for further analysis and enhancements. You can also download the dashboard as a PDF, PNG, or JPEG, embed it on a platform, or invite your team to collaborate.
Note: This is a Pro template. You’ll need a Pro subscription on Mokkup to use and customize this dashboard wireframe. Upgrade anytime to unlock full access.
Christmas E-Commerce Digital Performance Dashboard Example
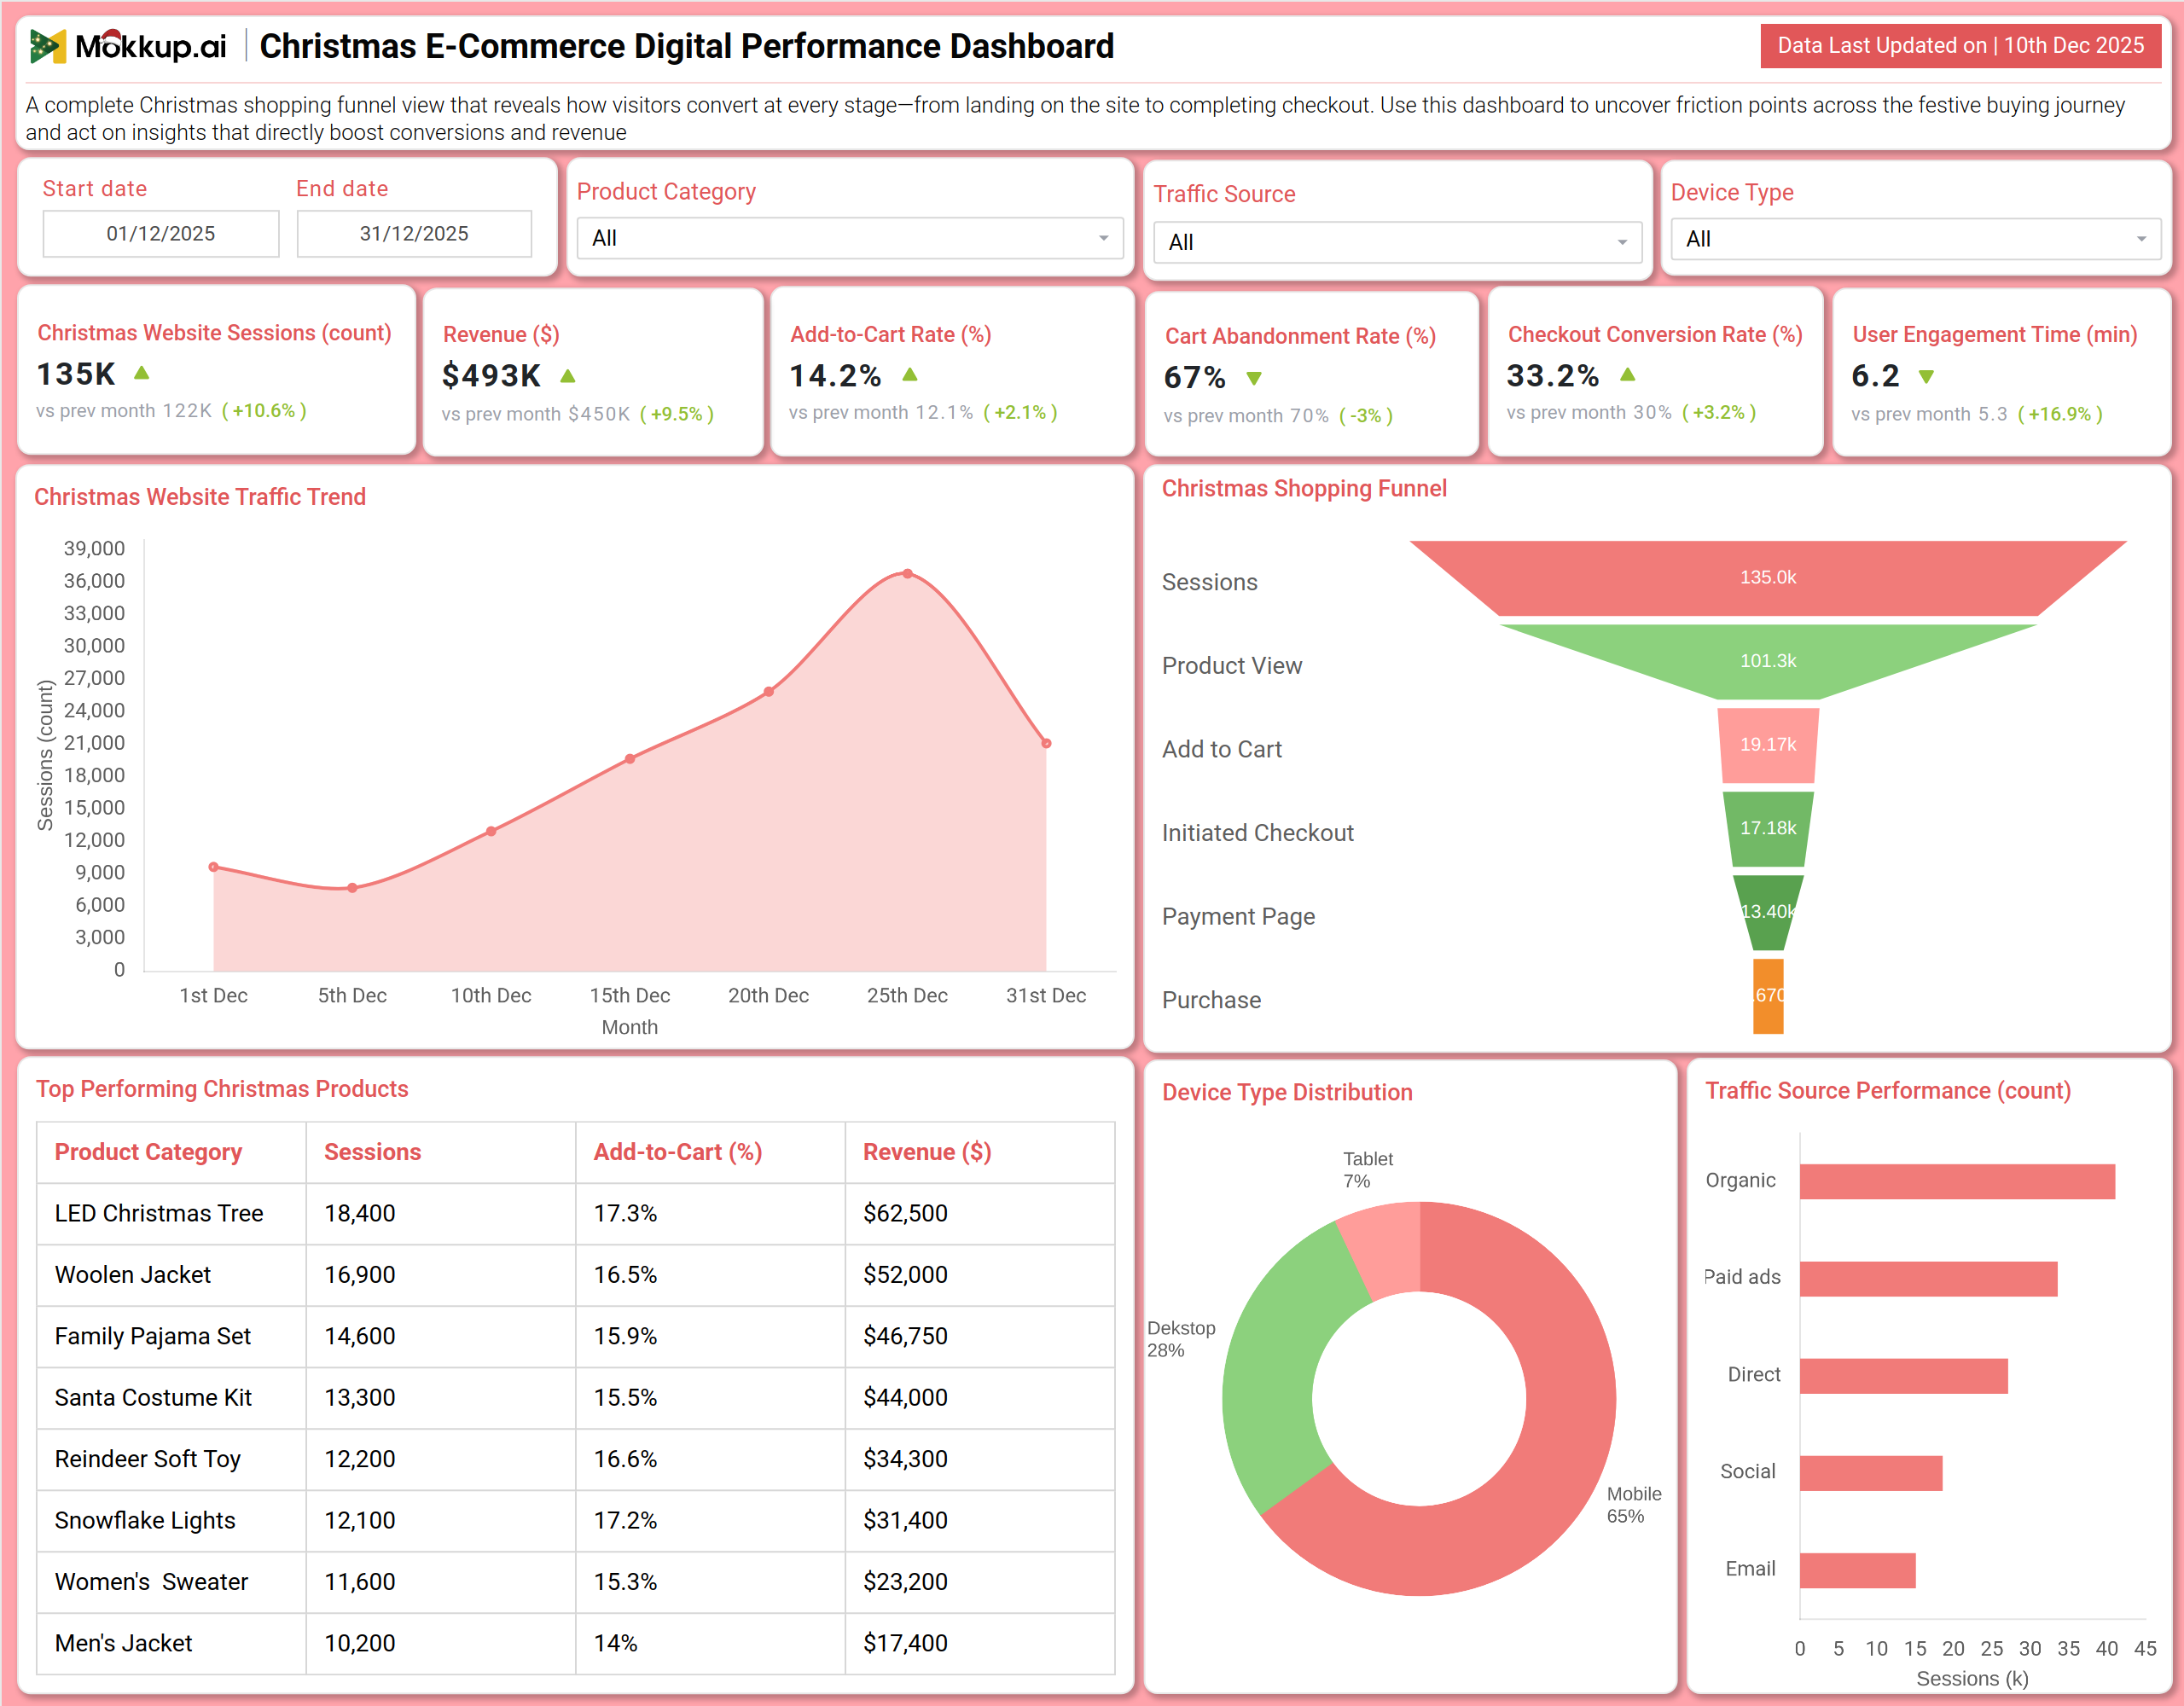
You can create a Christmas E-Commerce Digital Performance Dashboard that brings together funnel performance, product analytics, and traffic analysis into a unified view. A typical dashboard includes an Overview section, where users can track Christmas Website Sessions, Revenue, and Add-to-Cart Rate. Visual charts, such as the Christmas Shopping Funnel, reveal visitor drop-off between key stages, like 'Add to Cart' and 'Purchase'. The Product & Traffic Analysis section builds on this by displaying a detailed table of Top-Performing Christmas Products, along with their session and revenue data, as well as pie charts for Device Type Distribution and Traffic Source Performance. Together, these modules deliver crucial e-commerce holiday campaign analytics that help teams understand buyer behavior, optimize product placements, and allocate marketing spend effectively to boost festive sales.
How to Analyze Data in the Christmas E-Commerce Digital Performance Dashboard
Here is how you can analyze data from this dashboard:
- Christmas Website Sessions: Monitor total website visits to understand overall traffic volume and campaign reach during the festive season. This helps gauge awareness and interest generated by Christmas marketing efforts.
- Revenue Performance: Track total revenue to measure the direct financial impact of your holiday sales initiatives and evaluate overall Christmas season profitability.
- Add-to-Cart Rate: Analyze how often users add products to their cart to assess product appeal, pricing effectiveness, and the performance of product detail pages.
- Cart Abandonment Rate: Review the percentage of users who leave their carts after adding items to identify friction points, such as unexpected costs, slow load times, or confusing navigation.
- Checkout Conversion Rate: Measure how efficiently your checkout process converts buying intent into completed purchases, highlighting opportunities to optimize forms, payment options, and page speed.
- User Engagement Time: Observe how long visitors interact with your site to understand content relevance, product discovery behavior, and overall shopping interest.
- Christmas Shopping Funnel Analysis: Examine the entire shopping funnel, from landing pages to purchase completion, to identify where users drop off and which stages require optimization.
- Top-Performing Christmas Products: Analyze best-selling products and high-revenue categories to identify customer preferences and optimize inventory, promotions, and cross-selling strategies.
- Device Type Distribution: Evaluate traffic and conversions across mobile, desktop, and tablet devices to ensure a seamless and optimized shopping experience on every platform.
- Traffic Source Performance: Evaluate the impact of various channels, including organic search, paid ads, social media, and email, on sessions, conversions, and revenue during Christmas campaigns.
Benefits of Christmas E-Commerce Digital Performance Dashboard
The following are the benefits of using this dashboard:
- End-to-End Holiday Journey Visibility: Offers a centralized view of the entire customer journey, from initial visit to final purchase, during the holiday shopping season.
- Faster Funnel Optimization: Supports detailed holiday shopping funnel analysis to quickly identify conversion bottlenecks and improve performance in real time.
- Data-Driven Decision Making: Enables smarter decisions with clear insights into festive season conversion rates, user behavior, and product performance.
- Accurate Campaign ROI Measurement: Enhances Christmas campaign performance tracking, helping teams calculate return on ad spend and marketing effectiveness accurately.
- Revenue Growth Opportunities: Drives higher revenue through data-backed optimizations of product mix, promotions, pricing strategies, and user experience.
- Stronger Holiday Campaign Analytics: Unifies traffic, engagement, and sales data into a single dashboard for more effective e-commerce holiday analytics.
- Reduced Manual Reporting Effort: Minimizes reporting workload during peak periods with automated, visual, and consolidated performance views.
- Peak Season Readiness: Ensures preparedness for high-traffic shopping days by tracking daily session trends, conversion rates, and sales velocity in real time.
KPIs to Track in Christmas E-Commerce Digital Performance Dashboard
The following key KPIs can be tracked by using this dashboard:
- Christmas Website Sessions (count): The total number of visits to the website during the festive period.
- Revenue ($): The total sales income generated from holiday-specific campaigns and traffic.
- Add-to-Cart Rate (%): The percentage of sessions where a visitor adds at least one item to their shopping cart.
- Cart Abandonment Rate (%): The percentage of carts created that do not result in a completed purchase.
- Checkout Conversion Rate (%): The percentage of sessions that initiate checkout which culminate in a successful purchase.
- User Engagement Time (min): The average time a visitor spends actively interacting with the site per session.
- Traffic by Source (count/percentage): The breakdown of website visits attributed to different marketing channels.
- Product Performance Metrics: Session count, Add-to-Cart rate, and Revenue generated for individual products or categories.
Frequently Asked Questions
1. What is the purpose of a Christmas e-commerce dashboard?
It helps online retailers monitor, analyze, and optimize their sales performance and customer journey, specifically during the competitive holiday season.
2. Can the dashboard identify the reasons behind the drop in sales?
Yes. By analyzing the shopping funnel and cart abandonment rate it can highlight specific stages where customers are leaving.
3. How does the dashboard help with marketing decisions?
It shows which traffic sources (e.g., Paid Ads, Email) are driving the most sessions and revenue, allowing for thoughtful budget allocation.
4. Does it track which Christmas products are most popular?
Yes. A dedicated product performance table ranks items by sessions, add-to-cart rate, and revenue generated.
5. Who uses this dashboard?
E-commerce managers, digital marketers, product managers, and CRO specialists are managing seasonal online stores.