What is a Travel Reservations Report Dashboard?
The Travel Reservations Report Dashboard wireframe offers a complete view of how well tours are performing, how satisfied customers are, and how efficiently operations are running. It brings together essential KPIs such as bookings, revenue, cancellations, and feedback to help travel agencies and tour operators make smarter, data-backed decisions. With the Travel booking report dashboard, you can quickly access these key metrics in one place.
Travel Reservations Dashboard Example
Build your own travel reservations report dashboard with a layout that organizes key booking data and customer preferences in one place. The Mokkup Travel Reservations Dashboard offers a clear structure for comparing travel packages, destinations, and booking channels. With flexible filters for dates, demographics, and booking statuses, you can customize the view to suit your reporting needs. Once your data is added, the wireframe can be exported to Power BI or Tableau for in-depth analysis and reporting. This provides a solid foundation for teams looking to improve booking strategies and customer engagement. Using the Travel dashboard template, you can get started quickly and customize your report to your exact specifications.
How to Analyze Data in Travel Reservations Dashboards
Using Travel reservation analytics dashboards, businesses can quickly visualize their data through structured layouts tailored to industry needs. If you're looking for examples of travel reservations report dashboards, this template stands out with its well-organized screens and relevant metrics. It’s a great starting point for those exploring travel reservation report dashboard examples for the tourism sector.
The dashboard template is divided into three core sections:
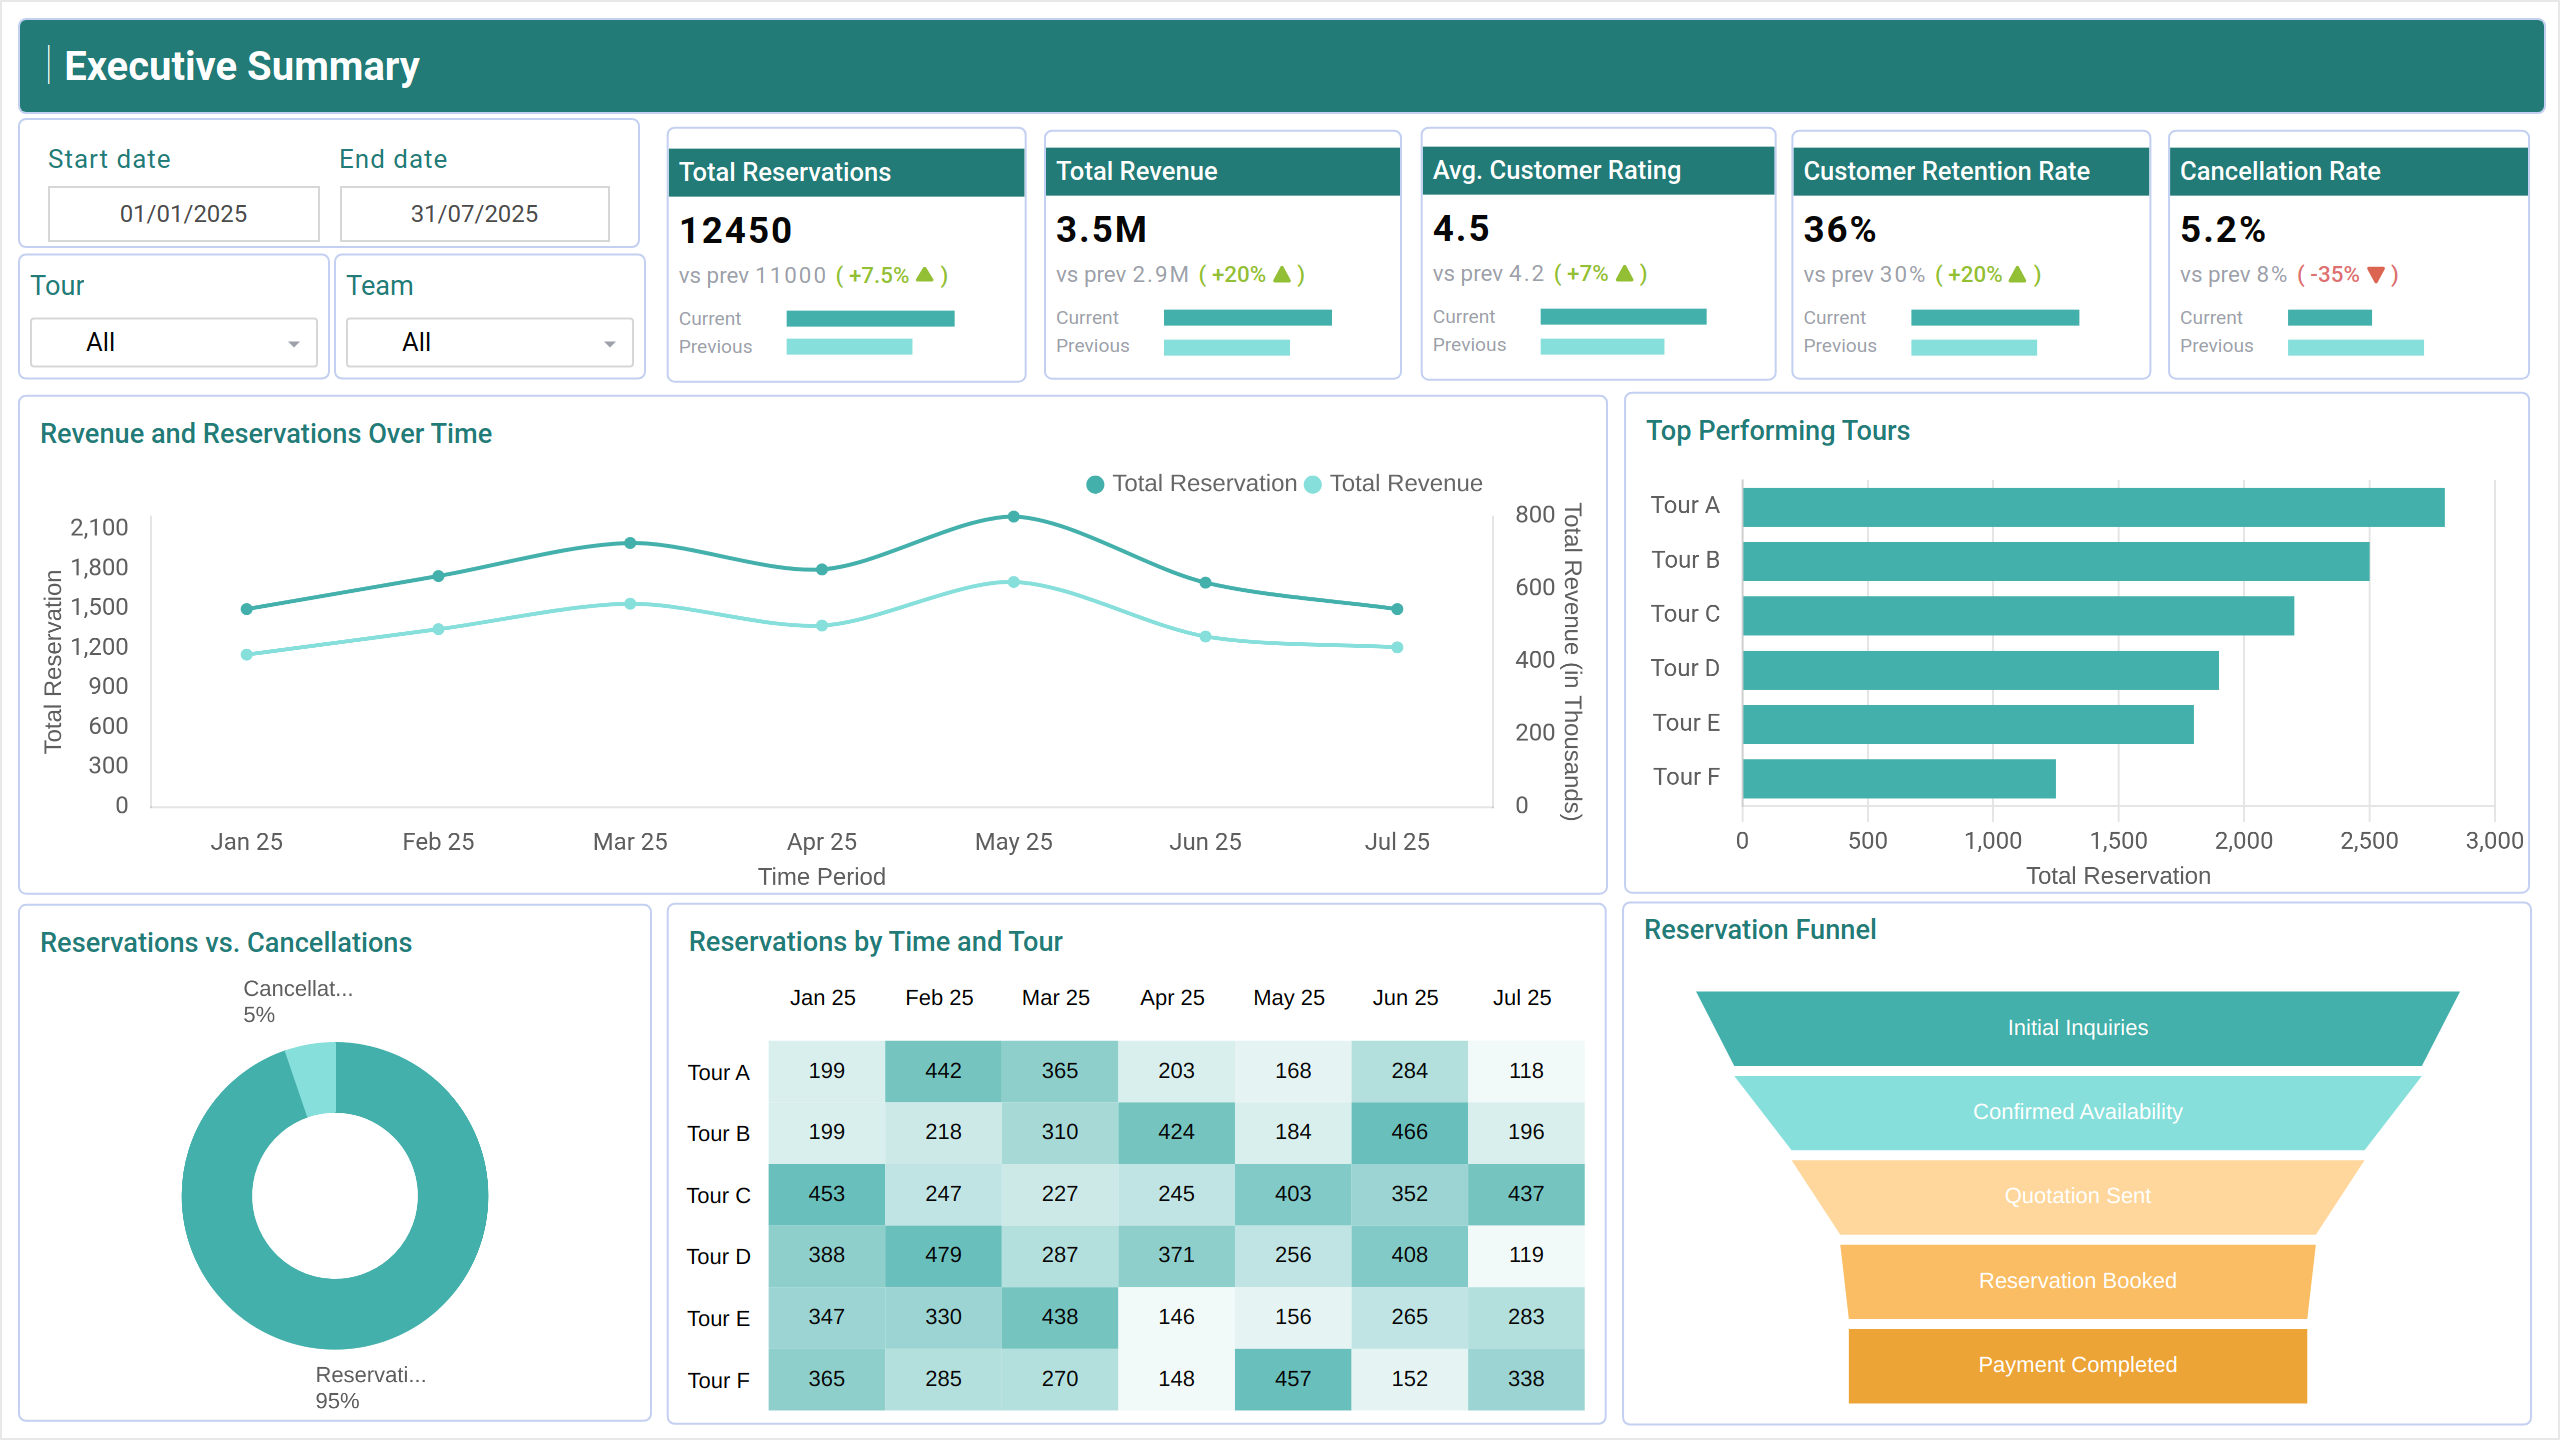
- The Executive Summary gives a snapshot of total bookings, revenue, customer retention, and cancellations—perfect for high-level overviews.
- The Tour Insights and Customer Analysis section explores customer preferences, demographics, and feedback to help fine-tune services.
- The Tour Reservation screen measures the effectiveness of teams and tour guides based on satisfaction ratings, tour count, and complaints.
Together, these templates help travel businesses improve experiences, streamline operations, and make more profitable decisions.
How to Create a Travel Reservations Dashboard
You don’t need to build your sample travel reservations dashboard from scratch. Use Mokkup’s Travel dashboard template to speed up your setup. Add your data and export it in your preferred format. Here's how to get started:
1. Create or Log in to Your Mokkup Account
To access the dashboard templates, sign up on Mokkup.ai using your email. If you already have an account, just log in and jump right in.
2. Choose and Customize Your Travel Reservations Dashboard
Head to the Templates section and select the Travel Reservations Dashboard. Use the drag-and-drop editor to modify booking metrics, apply demographic filters, or add elements to adjust filters for better reporting.
3. Export to Your BI Tool
Once your dashboard is set, use the BI Tool Export feature to move it to Power BI or Tableau for deeper insights. You can also download it as a PDF, PNG, or JPEG, embed it where needed, or share it with your team for easy collaboration.
This dashboard is a time-saving tool that helps your team visualize booking trends, share insights faster, and make data-driven decisions with confidence.
Note: This is a Pro template. To use and customize this travel report dashboard example, you’ll need a Pro subscription on Mokkup. Upgrade anytime to unlock full access.
Benefits of Travel Reservations Dashboards
A Travel reservations report dashboard offers several valuable advantages for travel agencies and hospitality teams. It provides a centralized view of booking data, customer preferences, and trends, enabling quick and informed decision-making. With Mokkup’s customizable dashboard templates, you can:
- Streamline Booking Analysis: Easily compare booking data across destinations, packages, and channels for quick insights.
- Enhance Decision-Making: Use visual indicators to understand which travel offerings are performing best across different demographics.
- Flexible Layouts: Adjust the dashboard to suit your reporting needs, whether you're focusing on booking volume, customer engagement, or destination trends.
Overall, a Travel Reservations Dashboard helps teams visualize booking performance and customer behaviors, making it the best travel dashboard for reservations and a valuable tool for boosting operational efficiency and optimizing travel offerings.
KPIs to Track in Travel Reservations Dashboards
This Travel reservations report dashboard brings together the most important metrics for evaluating travel bookings and customer behavior. By comparing these numbers across destinations, packages, and booking channels, you can quickly identify trends and optimize your travel offerings.
Key KPIs to Track:
- Total Reservations – Total number of bookings made, reflecting business volume.
- Avg. Customer Rating – Average customer feedback score indicating service quality.
- Customer Retention Rate – Percentage of repeat customers showing brand loyalty.
- Revenue and Reservations Over Time – Tracks trends to spot seasonal changes.
- Top Performing Tour – Highlights the tours with the highest bookings and revenue.
Frequently Asked Questions
1. Can I customize the KPIs and filters in the dashboard?
Yes, the template is fully customizable. You can edit KPIs, adjust filters, rename labels, and drag and drop elements to match your data and business needs.
2. Is it possible to export the dashboard to use in other tools?
Absolutely. You can export your dashboard to your preferred BI tool or download it in PDF, JPEG, or PNG formats. You can also embed it or invite others to collaborate.