What is an Audience Engagement Analysis Dashboard?
An Audience Engagement Analysis Dashboard helps marketing and content teams understand how audiences interact with their digital platforms. It combines key performance indicators like views, likes, shares, average session duration, bounce rates, and more to present a comprehensive picture of engagement levels. With a centralized dashboard view, teams can assess what's resonating with audiences and where improvements are needed—all in one place.
Audience Engagement Dashboard Example
Create your own audience engagement analysis dashboard with a layout that neatly organizes metrics like click-through rates, time on page, and social media interactions. The Mokkup Audience Engagement Dashboard template offers a structured format to visualize engagement by channel, campaign, or content type. With built-in filters for date ranges, this dashboard can be customized to match your campaign goals and reporting preferences. After adding your data, you can export the dashboard directly to Power BI or Tableau for deeper visualization and reporting. Whether you're tracking engagement for blog content or social media posts, this wireframe gives you a clear and effective foundation to start with.
How to Analyze Data in Audience Engagement Dashboards
Using audience engagement analytics dashboards, teams can quickly visualize performance metrics through structured layouts designed for marketing and content strategy needs. If you're searching for audience engagement dashboard examples, this drag and drop engagement dashboard template stands out with its clean design and actionable insights. It’s a great starting point for those building audience analysis dashboards across content platforms.
The dashboard template is divided into two core screens:
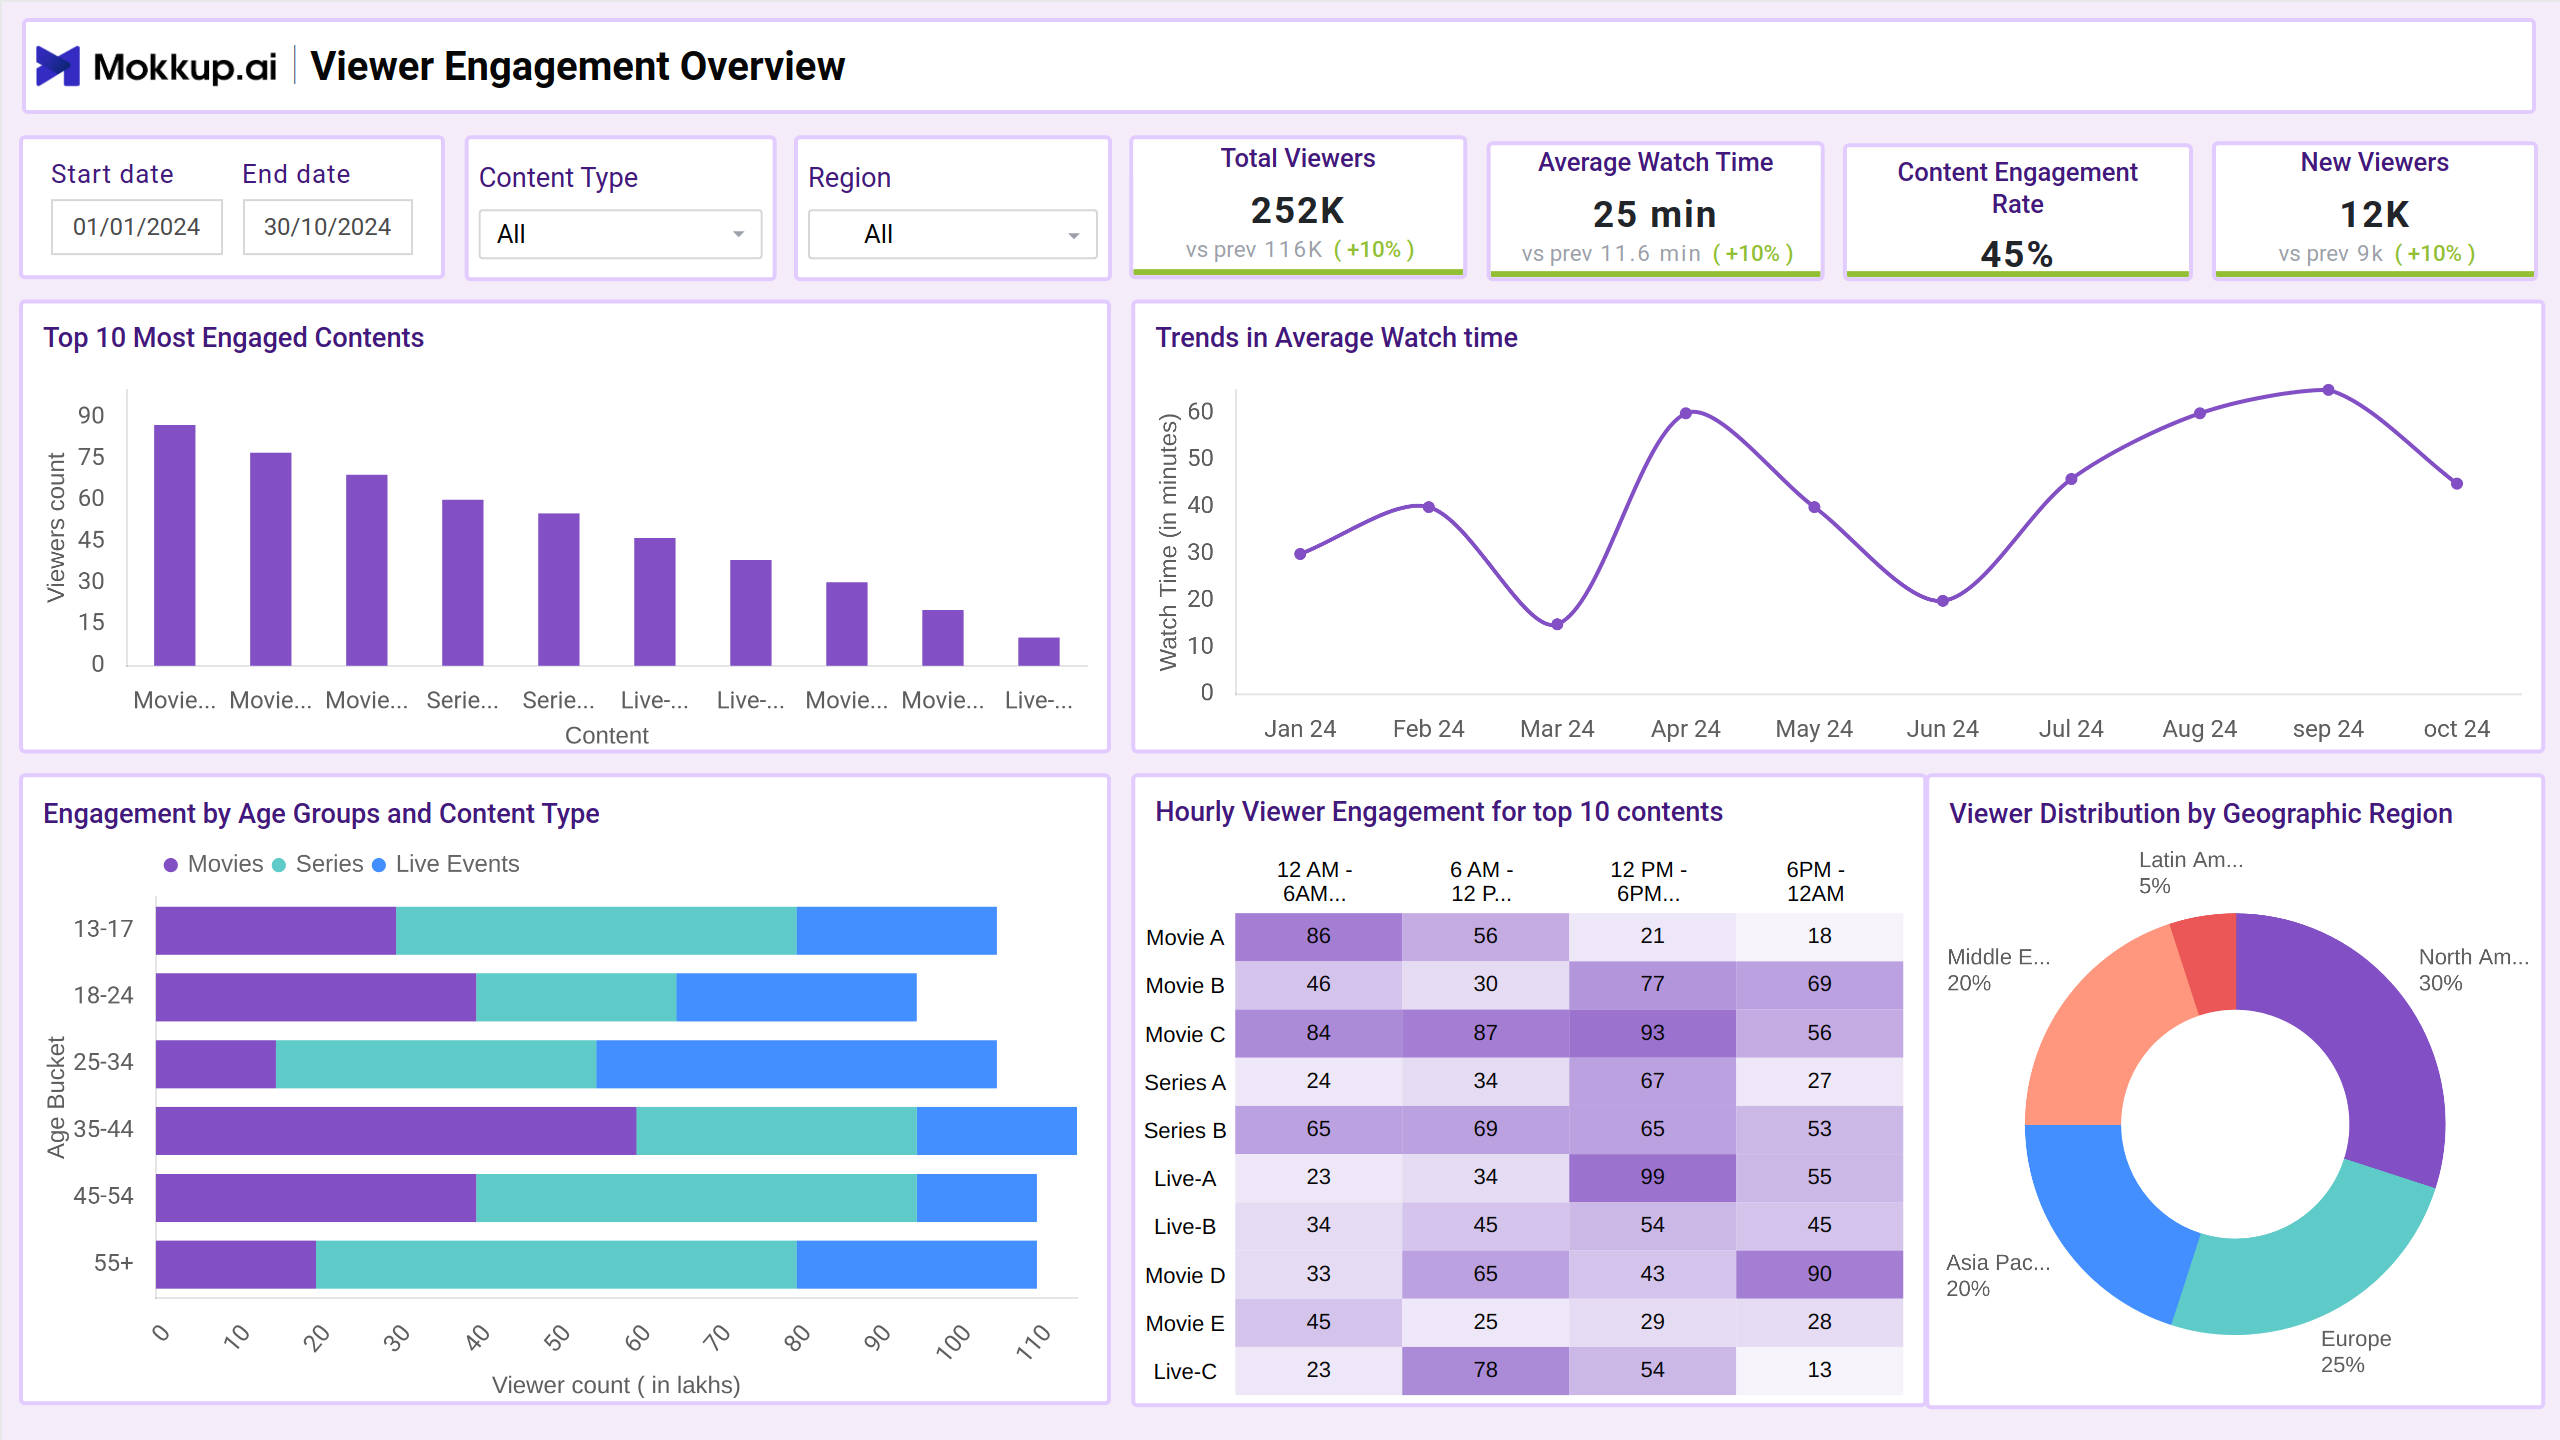
- The Viewer Engagement Overview screen provides a snapshot of how users are interacting with your content. It highlights total views, likes, shares, session duration, and engagement rates—ideal for understanding high-level trends and content performance at a glance.
- The Churn Analysis screen helps identify drop-off points and disengagement patterns. It captures bounce rates, exit pages, time to churn, and returning vs. one-time visitors to guide retention strategies and content improvements.
Together, these screens help teams refine visual engagement data, reduce bounce, and build more engaging audience experiences.
How to Create an Audience Engagement Analysis Dashboard
You don’t need to build your audience engagement analysis dashboard from scratch. Use Mokkup.ai's engagement dashboard to speed up your setup. Add your data and export it in your preferred format. Here's how to get started:
1. Create or Log in to Your Mokkup Account
To access the dashboard templates, sign up on Mokkup.ai using your email. If you already have an account, just log in and jump right in.
2. Choose and Customize Your Travel Reservations Dashboard
Head to the Templates section and select the Audience engagement analysis dashboard. Use the drag-and-drop editor to modify booking metrics, apply demographic filters, or add elements to adjust filters for better reporting.
3. Export to Your BI Tool
Once your dashboard is set, use the BI Tool Export feature to move it to Power BI or Tableau for deeper insights. You can also download it as a PDF, PNG, or JPEG, embed it where needed, or share it with your team for easy collaboration.
Note: This is a Pro template. To use and customize this travel report dashboard example, you’ll need a Pro subscription on Mokkup. Upgrade anytime to unlock full access.
Benefits of Audience Engagement Dashboards
Audience Engagement Dashboards help platforms understand how viewers interact with content—what holds their attention, when they drop off, and what brings them back. These dashboards make it easier to analyze behavior patterns and respond with data-informed decisions. With Mokkup’s pre-built engagement analytics templates, teams can:
- Boost Viewer Retention: Identify content that performs best among key audience groups to guide future programming with the help of content engagement tracking.
- Improve Engagement Strategies: Identify the moments when viewers are most likely to drop off or re-engage, helping shape content length, format, or placement. Leverage real-time engagement metrics to act quickly on these moments.
- Segment and Target: Use an AI audience engagement dashboard to break down engagement metrics by age group, region, or time of day for personalized marketing or recommendations.
Using these insights, teams can keep audiences engaged, reduce churn, and refine content strategies more effectively.
KPIs to Track in Audience Engagement Dashboards
Audience Engagement Dashboards bring together the metrics that matter when evaluating viewer interest and content performance. These KPIs help teams understand which content connects with audiences and where engagement efforts can improve.
Key KPIs to Track:
- Total Viewers – Tracks unique viewers across content to understand reach.
- Engagement Rate – Measures how many viewers interact with content (likes, shares, comments).
- Churn Rate – Identifies how many viewers drop off over time.
- Drop-Off Points – Pinpoints exact moments viewers exit content.
- Demographic Breakdown – Shows engagement patterns by age, region, and device.
Frequently Asked Questions
1. Can I edit the layout or KPIs in the dashboard?
Yes, the dashboard is fully customizable. You can edit the layout, add new metrics, or rearrange visual elements to suit your goals.
2. Can I export the dashboard to share with my team?
Absolutely. Export your dashboard to Power BI, Tableau, or download it as PDF, JPEG, or PNG. You can also embed it on your site or invite team members for easy collaboration.