A Cardiac Care Financial Dashboard is a business intelligence solution designed for hospitals and heart care centers to monitor revenue, costs, and profitability across cardiac services. It provides hospital administrators, finance managers, and executives with insights into revenue and profitability tracking for cardiac procedures and overall financial trends.
By consolidating all financial and operational data in a single view, the dashboard wireframe helps optimize resource allocation, enhance billing processes, improve insurance claim tracking, and support strategic decision-making for better outcomes. It acts as a hospital cardiac services financial performance dashboard that enables informed decisions across departments.
How to Create a Cardiac Care Financial Dashboard
You don’t need to build your report from scratch—just start with a ready-to-use Cardiac Care Financial Dashboard template from Mokkup. Add in your data and export it however you like. Here’s how to do it:
1. Create or Log in to Your Mokkup Account
Start by signing up on Mokkup.ai using your email. If you already have an account, simply log in, and you’ll be all set.
2. Choose and Customize Your Dashboard Template
Find the Cardiac Care Financial Dashboard template in the Templates section. Use the drag-and-drop editor to adjust KPIs, edit filters, or add elements based on your data.
3. Export to Your BI Tool
Once your dashboard wireframe is ready, use the BI Tool Export feature to send it directly to Power BI or Tableau for further analysis and enhancements. You can also download the dashboard as a PDF, PNG, or JPEG, embed it on a platform, or invite your team to collaborate.
Note: This is a Pro template. You’ll need a Pro subscription on Mokkup to use and customize this dashboard wireframe. Upgrade anytime to unlock full access.
Cardiac Care Dashboard Example
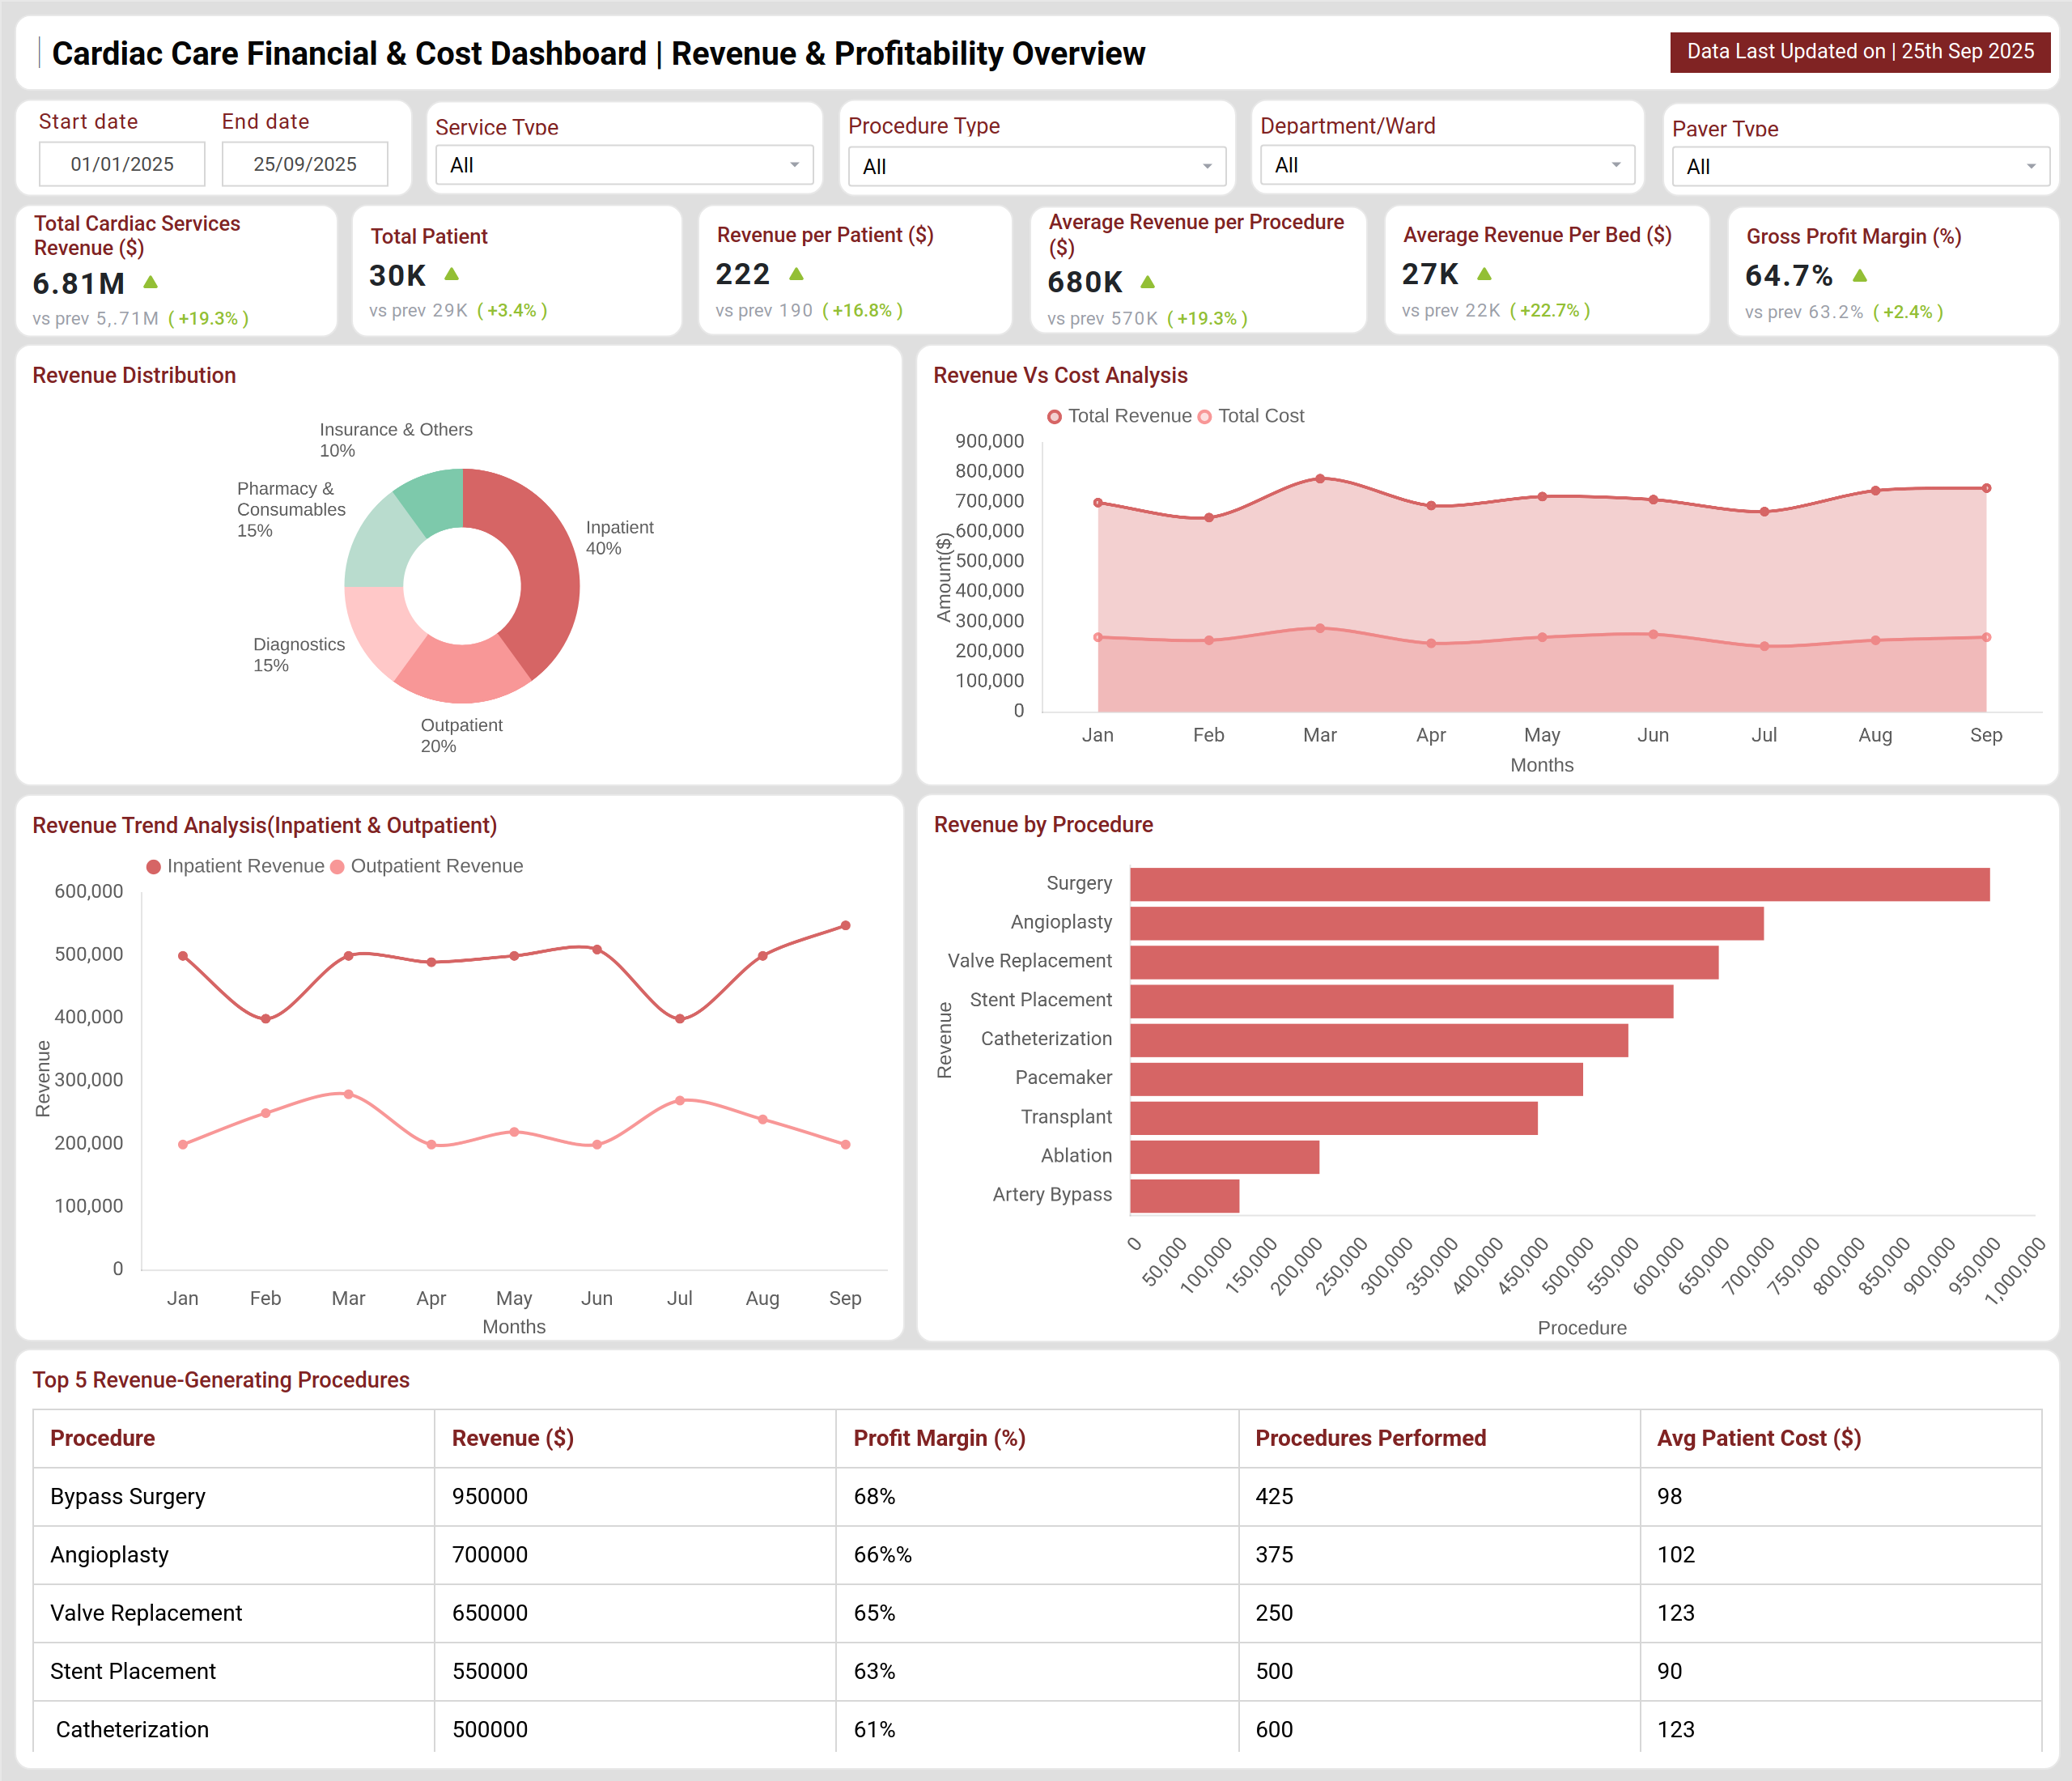
The Cardiac Care Dashboard provides hospital executives and finance managers with a comprehensive view of both financial performance and operational efficiency. It offers an overview of revenue, cost, and profitability trends across inpatient and outpatient cardiac services, enabling leaders to track service line performance and make data-driven financial decisions for sustainable profitability.
In addition, it highlights procedure costs, staff and consumable expenses, and insurance claim efficiency, allowing managers to evaluate cost per procedure, analyze revenue from heart care, monitor accounts receivable, and optimize resource allocation. Together, these insights support improved financial efficiency, strategic planning, and long-term growth in cardiac care services.
How to Analyze Data in a Cardiac Care Financial Dashboard
A Cardiac Care Financial Dashboard combines real-time data, historical trends, and predictive insights to help hospitals improve financial performance. To analyze data effectively:
- Start with KPIs by monitoring total revenue, profit margins, and cost efficiency to understand overall performance.
- Assess Service Performance by reviewing revenue and profitability per procedure to identify high-value and underperforming service lines.
- Spot Financial Hotspots using filters by service type, procedure, and department to locate cost-intensive or low-performing areas.
- Track Insurance Efficiency by visualizing claim approval and denial patterns and monitoring average reimbursement times.
- Review Operational Efficiency by benchmarking staff and consumable costs across procedures to identify areas for optimization.
- Identify Trends using line, bar, and area charts to monitor revenue growth, profitability, and cost reductions over time.
This approach ensures that revenue and profitability tracking for cardiac procedures is fully actionable and aligned with hospital financial goals.
Benefits of a Cardiac Care Financial Dashboard
The key benefits of implementing this dashboard wireframe include:
- Real-time visibility into revenue, costs, and profitability across cardiac services.
- Enhanced decision-making through detailed insights into high-value procedures and cost-intensive areas.
- Improved financial planning and resource allocation for better operational efficiency.
- Increased transparency in insurance claim handling, reducing delays and improving cash flow.
- Data-driven prioritization of interventions to optimize procedure profitability and reduce unnecessary expenses.
- Strengthened trust among executives, clinicians, and patients through clear reporting and accountability.
KPIs to Track in Cardiac Care Financial Dashboards
The key KPIs to monitor include:
- Total Revenue from Cardiac Services: Measures all revenue from inpatient, outpatient, and diagnostic services.
- Revenue Per Patient: Compares average revenue for inpatient versus outpatient cases.
- Profit Margin Per Procedure / Service Line (%): Evaluates profitability across procedures.
- Average Revenue Per Procedure: Monitors revenue generated by each procedure.
- Average Billing Per Patient: Assesses revenue collected per patient.
- Gross Profit Margin (%): Indicates overall profitability after costs.
- Cost Per Procedure: Monitors procedural costs, including staff, consumables, and equipment.
These KPIs together form a complete hospital cardiac services financial performance dashboard for executives to track efficiency and profitability.
Frequently Asked Questions
Q1. How does a Cardiac Care Financial Dashboard improve hospital profitability?
By monitoring revenue, costs, and profit per procedure, the dashboard highlights high-value and underperforming areas. It enables hospitals to optimize resource allocation, reduce costs, and improve financial outcomes across cardiac services.
Q2. Can the dashboard be customized for different hospital needs?
Yes. BI tools like Power BI or Tableau allow full customization. Users can select KPIs, adjust filters, and add visuals to reflect specific priorities such as revenue and profitability tracking for cardiac procedures or departmental costs.
Q3. How does it help with insurance and reimbursement efficiency?
By tracking claim denial rates, reimbursement times, and workflow bottlenecks, the dashboard helps finance teams take corrective actions and streamline cash flow management.