
What is a Stormwater Utility Capital Infrastructure Expansion Dashboard?
The Stormwater Utility Capital Infrastructure Expansion Dashboard is a structured reporting tool for municipal stormwater agencies and utility managers overseeing capital programs. It consolidates project delivery metrics, budget execution data, permit compliance rates, and physical construction progress into a single view. Whether a utility team is managing gray pipe infrastructure, green infrastructure installations, or hybrid projects, this stormwater utility capital infrastructure tracking dashboard provides the visibility needed to monitor program health and flag risks before they compound. Teams can filter across fiscal year, project type, region or district, and project phase, making it straightforward to isolate what matters for any given review or stakeholder conversation. The MS4 permit compliance monitoring tool functionality embedded in this dashboard ensures that regulatory obligations remain visible alongside operational metrics throughout the delivery lifecycle.
How to Create a Stormwater Utility Capital Infrastructure Expansion Dashboard
You don't need to build your report from scratch, just start with a ready-to-use dashboard template from Mokkup. Add in your data and export it however you like. Here's how to do it:
1. Create or Log in to Your Mokkup Account
Start by signing up on Mokkup.ai using your email. If you already have an account, just log in, and you'll be good to go.
2. Choose and Customize Your Dashboard Template
Find the Stormwater Utility Capital Infrastructure Expansion Dashboard template in the Templates section. Use the drag-and-drop editor to adjust KPIs, edit filters, or add elements based on your data.
3. Export to Your BI Tool
Once your dashboard wireframe is ready, use the BI Tool Export feature to send it directly to Power BI or Tableau for further analysis and enhancements. You can also download the dashboard as a PDF, PNG, or JPEG, embed it on a platform, or invite your team to collaborate.
Note: This is a Pro template. You'll need a Pro subscription on Mokkup to use and customize this dashboard wireframe. Upgrade anytime to unlock full access.
Stormwater Utility Capital Infrastructure Expansion Dashboard Example
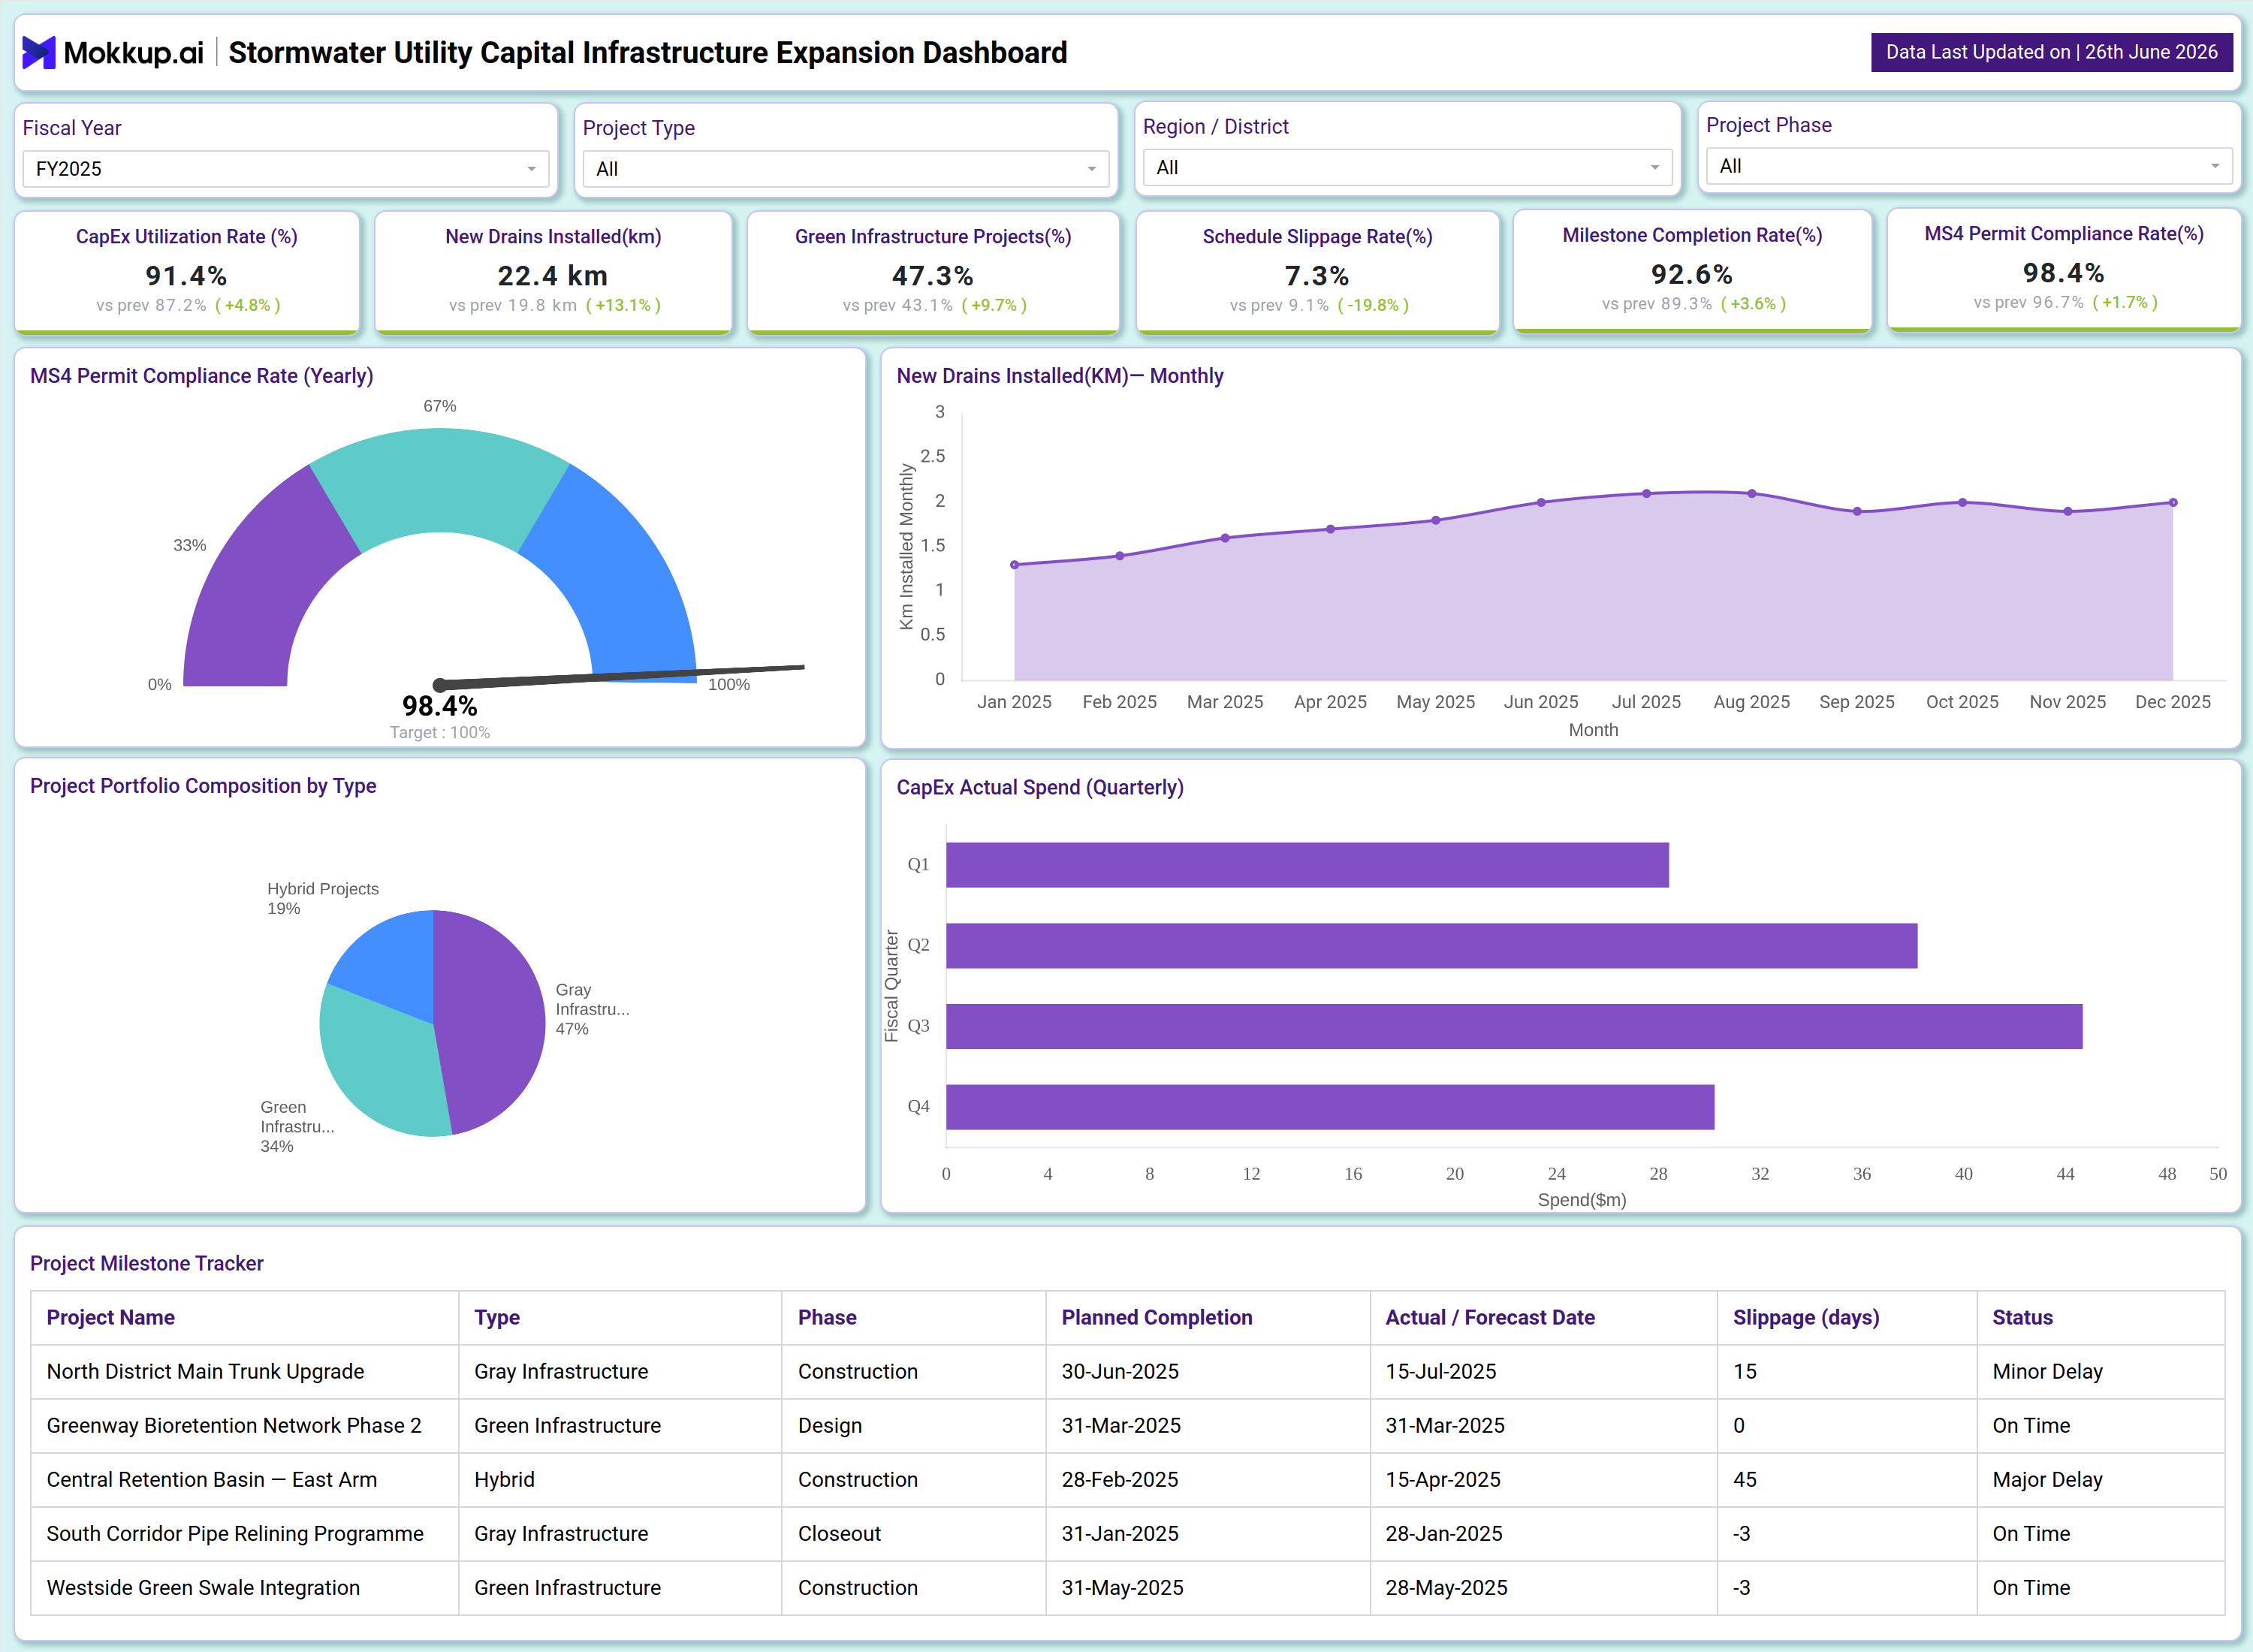
A capital program manager at a mid-sized municipal utility opens this dashboard at the start of a quarterly review cycle to answer a single question: Is the expansion program staying on track against budget and schedule? The top KPI row delivers an immediate read across all critical dimensions, covering capital spend efficiency, new drainage network installed, portfolio composition, schedule slippage, milestone delivery rate, and MS4 permit compliance. Within seconds, the manager knows which areas need attention and which are holding steady. The MS4 Permit Compliance Rate gauge reinforces the regulatory picture annually and is essential for any team running a stormwater utility capital infrastructure tracking dashboard alongside active construction. The monthly line chart tied to the stormwater drain installation progress tracker helps planners assess whether the physical installation pace is accelerating or plateauing against program commitments, a leading signal for whether year-end targets are achievable without a recovery push.
The Project Portfolio Composition chart enables leadership to assess the distribution of programs across gray infrastructure, green infrastructure, and hybrid project types. The green infrastructure project portfolio dashboard view informs regulatory reporting, where utilities must demonstrate environmental commitment. The quarterly CapEx Actual Spend bar chart sits alongside to validate whether spending aligns with portfolio composition, supporting the CapEx utilization rate for stormwater projects review that finance teams conduct each quarter. At the base of the dashboard, the Project Milestone Tracker brings the program to the individual project level. Delivery managers identify which projects are on time and which carry slippage, then use that data to build the municipal stormwater capital expansion reporting required by oversight bodies and regulatory agencies.
How to Analyze Data in a Stormwater Utility Capital Infrastructure Expansion Dashboard
Here is how you can analyze data from this dashboard:
- Use the Fiscal Year, Project Type, Region/District, and Project Phase filters to isolate specific program segments before analyzing metrics
- Review the CapEx Utilization Rate first — a rate significantly below target signals underspending that warrants budget reallocation before fiscal year-end
- Cross-reference the MS4 Permit Compliance Rate gauge against active project phases to confirm regulatory adherence during peak construction periods
- Monitor the New Drains Installed monthly line chart for pace consistency — sudden dips indicate crew, material, or permitting disruptions
- Use the Project Portfolio Composition chart to verify the program balance across gray infrastructure, green infrastructure, and hybrid project types
- Sort the Project Milestone Tracker by Slippage (days) to immediately identify projects that require escalation or recovery planning
- Compare Planned Completion against Actual/Forecast Date across active projects to assess whether schedule slippage is isolated or systemic
Benefits of a Stormwater Utility Capital Infrastructure Expansion Dashboard
The following are the benefits of using this dashboard:
- Provides capital program managers with a single source of truth for budget, schedule, and compliance data across all active stormwater projects
- Reduces time spent compiling quarterly status reports by surfacing key metrics in a pre-structured, filter-driven view
- Supports MS4 permit compliance monitoring tool requirements by tracking regulatory performance alongside operational project data
- Enables faster decision-making by making schedule slippage and CapEx underspending visible at a glance
- Improves stakeholder communication with a data-backed program narrative for city councils, regulators, and oversight bodies
- Scales across programs of varying complexity, from single-district utilities to multi-region capital expansion programs
- Accelerates audit preparation by centralizing milestone, compliance, and spend data in one exportable view
KPIs to Track in a Stormwater Utility Capital Infrastructure Expansion Dashboard
The following key KPIs can be tracked by using this dashboard:
- KPIs (Key Performance Indicators) are measurable values that signal whether a capital program is meeting its targets. For stormwater infrastructure programs, the right KPIs span financial execution, physical progress, schedule discipline, and regulatory compliance.
- CapEx Utilization Rate (%) — measures the proportion of approved capital budget actively spent, indicating whether the program is executing against its funded plan
- New Drains Installed (km) — tracks cumulative physical progress of drainage network installation, validating that construction is delivering planned infrastructure expansion
- Green Infrastructure Projects (%) — reports the share of the portfolio classified as green infrastructure, confirming alignment with environmental and sustainability commitments
- Schedule Slippage Rate (%) — calculates the percentage of projects running behind planned completion dates, flagging delivery risk across the program
- Milestone Completion Rate (%) — measures the share of planned project milestones completed on schedule, reflecting overall program delivery discipline
- MS4 Permit Compliance Rate (%) — tracks adherence to Municipal Separate Storm Sewer System (MS4) permit requirements, a critical regulatory obligation for stormwater utilities
Frequently Asked Questions
1. Who should use the Stormwater Utility Capital Infrastructure Expansion Dashboard?
This dashboard is built for stormwater utility managers, capital program directors, finance analysts, and municipal compliance officers who need a unified view of infrastructure project delivery, budget execution, and permit compliance. It is equally useful for city administrators preparing for council or regulatory reporting.
2. Can this dashboard support MS4 permit compliance monitoring for regulatory audits?
Yes. The dashboard tracks the MS4 Permit Compliance Rate annually and displays it as both a KPI tile and a gauge chart. This gives utilities a clear, auditable record of compliance performance that can be referenced during permit reviews or regulatory inspections.
3. How does the Project Milestone Tracker help manage project delays?
The tracker displays each project's planned versus actual completion date and calculates slippage in days. Teams can quickly identify which projects carry a major delay status and prioritize schedule recovery conversations or resource reallocation before the delay compounds further.