
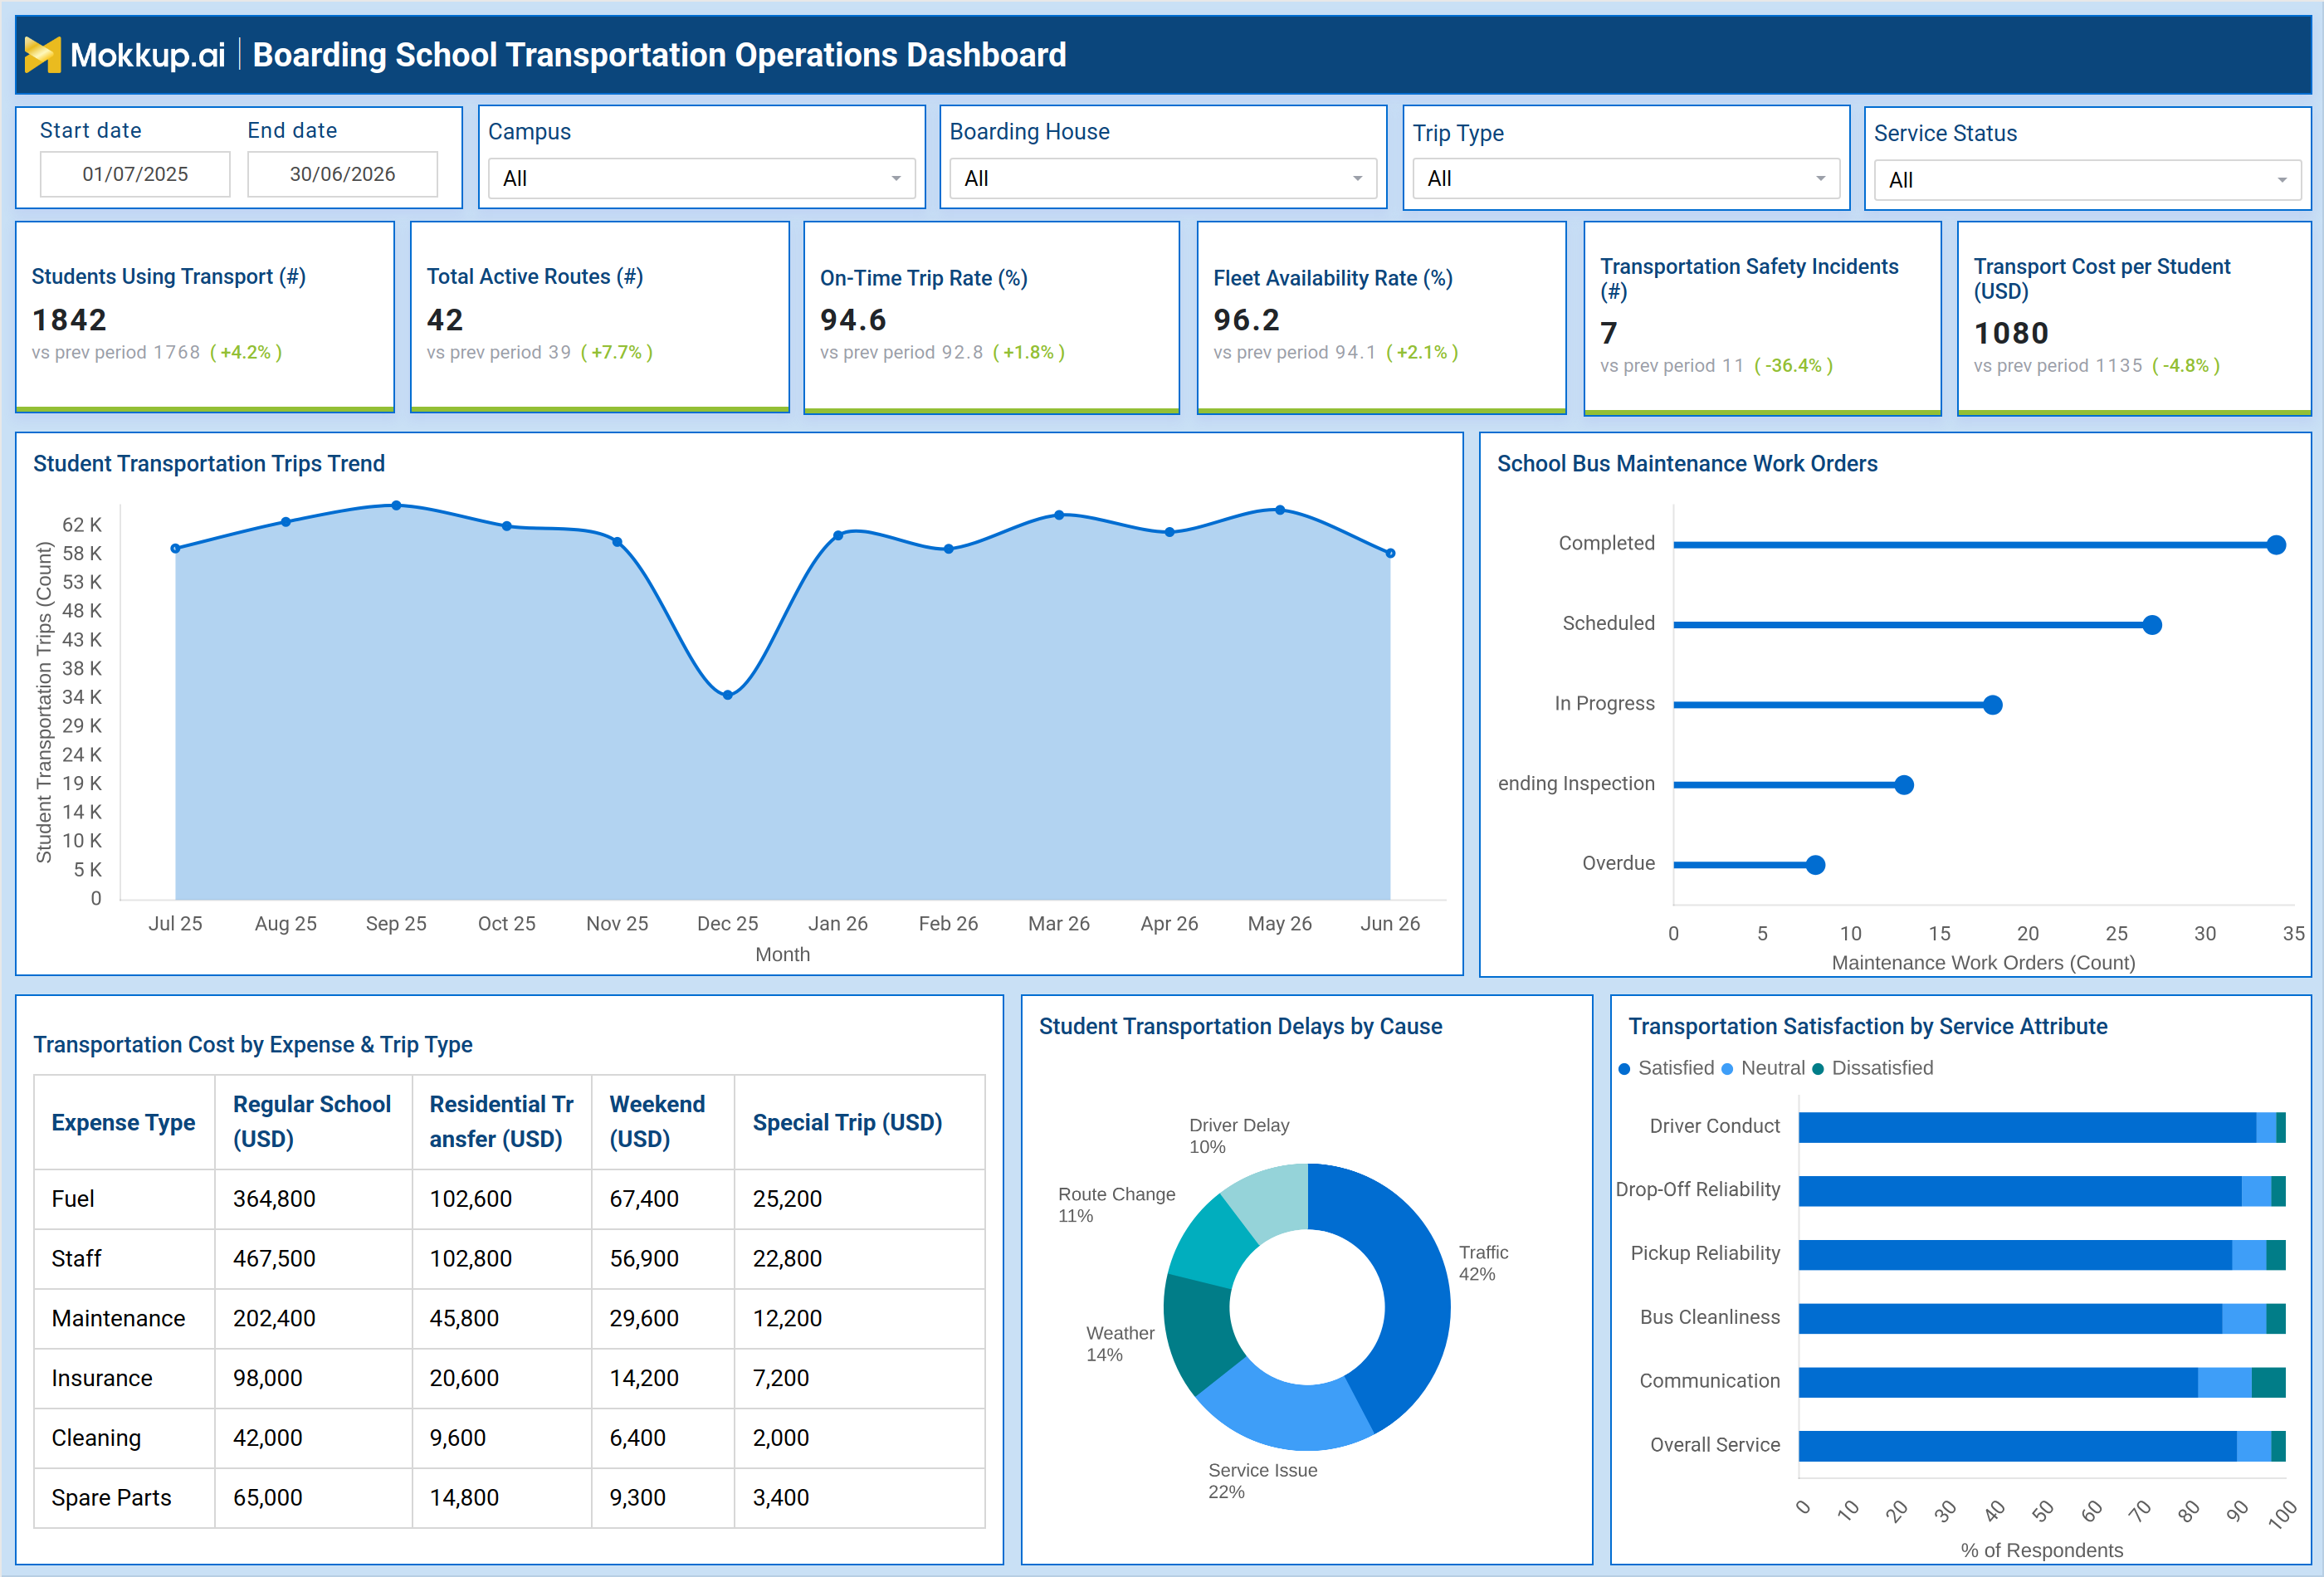
What is a Boarding School Transportation Operations Dashboard?
The Boarding School Transportation Operations Dashboard is a dashboard template built for transportation coordinators and boarding school administrators who manage student travel across residential campuses. It brings together route performance, fleet reliability, maintenance status, and family satisfaction data in a single view, replacing scattered spreadsheets and vendor reports. This boarding school transportation operations dashboard consolidates data from campus locations, boarding houses, and trip categories, letting administrators filter by date range, campus, boarding house, trip type, and service status to focus on the segment that matters most. Because boarding schools carry direct responsibility for student safety during transit, a student transport safety incident tracking view alongside cost and satisfaction metrics helps teams balance safety, budget, and service quality without switching between disconnected systems.
How to Create a Boarding School Transportation Operations Dashboard
You don’t need to start from scratch—just begin with a ready-to-use Dashboard Template from Mokkup. Here’s how:
1. Create or Log in to Your Mokkup Account
Start by signing up on Mokkup.ai using your email. If you already have an account, just log in, and you'll be good to go.
2. Choose and Customize Your Dashboard Template
Find the Boarding School Transportation Operations Dashboard template in the Templates section. Use the drag-and-drop editor to adjust KPIs, edit filters, or add elements based on your data.
3. Export to Your BI Tool
Once your dashboard wireframe is ready, use the BI Tool Export feature to send it directly to Power BI or Tableau for further analysis and enhancements. You can also download the dashboard as a PDF, PNG, or JPEG, embed it on a platform, or invite your team to collaborate.
Note: This is a Pro template. You'll need a Pro subscription on Mokkup to use and customize this dashboard wireframe. Upgrade anytime to unlock full access.
Boarding School Transportation Operations Dashboard Example
A transportation coordinator at a boarding school typically opens this dashboard at the start of each week to check whether student transport operations are running as expected across all campuses and boarding houses. Before reviewing anything else, they narrow the view by date range, campus, or trip type to focus on the segment relevant to that week's planning, whether that is regular school runs, residential transfers, or weekend outings. The first question is usually simple: are buses running on time, is the fleet available, and has anything gone wrong that needs immediate attention? From the top-level view, the coordinator can gauge whether on-time performance and fleet availability are holding steady against prior periods, and whether ridership across campuses is growing or shrinking in a way that affects route planning.
If safety incidents are trending in the wrong direction, they can flag it early and coordinate with campus safety teams before it becomes a pattern. Looking at the trip volume trend across the academic year, planners can identify seasonal dips and adjust staffing and route frequency accordingly rather than running a fixed schedule year-round. Maintenance leads use the same dashboard to prioritize which buses need attention first, comparing completed work orders against those overdue or pending inspection, so technicians are directed to the right vehicle before it becomes unsafe or unavailable. Finance and operations leadership compare cost distribution across expense categories and trip types to identify which trip type is consuming a disproportionate share of the transportation budget. By pairing student transportation delay cause analysis with family satisfaction scores across service attributes like driver conduct, pickup reliability, and communication, school leadership can pinpoint whether operational issues are translating into parent dissatisfaction. Ultimately, this dashboard helps boarding school transportation teams move from reactive firefighting to proactive planning, keeping every student's commute safe, on schedule, and within budget.
How to Analyze Data in a Boarding School Transportation Operations Dashboard
Here is how you can analyze data from this dashboard:
- Filter by campus and boarding house to isolate transportation performance for a specific residential group
- Compare on-time trip rate and fleet availability rate against the prior period to spot service degradation early
- Review the student transportation trips trend to identify seasonal ridership shifts across the academic calendar
- Use school bus maintenance work order tracking to see how many vehicles are completed, scheduled, or overdue for service
- Break down transportation cost by expense type and trip type to locate the biggest spend categories
- Apply student transportation delay cause analysis to determine whether traffic, weather, or service issues drive most disruptions
- Track transportation satisfaction by service attribute to see which touchpoints need the most improvement
- Combine trip type and service status filters to audit performance for weekend or special trips specifically
Benefits of a Boarding School Transportation Operations Dashboard
The following are the benefits of using this dashboard:
- Centralizes route, fleet, and cost data into one campus transportation cost analysis tool for faster decisions
- Reduces manual reporting effort by replacing spreadsheet-based tracking with a single dashboard view
- Strengthens student transport safety incident tracking so issues are flagged and addressed before they escalate
- Helps operations teams prioritize maintenance work orders and avoid unexpected fleet downtime
- Supports budget planning by breaking down cost by expense type and trip type
- Strengthens parent and student trust by monitoring satisfaction across every service attribute
- Enables data-driven route and staffing adjustments based on ridership trends
- Gives leadership a shareable, presentation-ready view for board and parent communication
KPIs to Track in a Boarding School Transportation Operations Dashboard
The following key KPIs can be tracked by using this dashboard:
- Students Using Transport - measures how many students rely on school transportation, indicating service reach and demand
- Total Active Routes - tracks how many routes are currently operating, reflecting network coverage and complexity
- On-Time Trip Rate - shows the share of trips completed within scheduled time, a core measure of service reliability
- Fleet Availability Rate - a core metric for any school fleet availability monitoring dashboard, showing how much of the bus fleet is operational and ready for assignment
- Transportation Safety Incidents - supports student transport safety incident tracking by counting safety-related events during transit
- Transport Cost per Student - reflects the average cost of moving each student, useful for budget benchmarking
Frequently Asked Questions
1. What is the Boarding School Transportation Operations Dashboard used for?
It monitors student transport safety, on-time performance, fleet health, and cost across campuses and boarding houses. It combines route, maintenance, cost, and satisfaction data into one campus transportation cost analysis tool for leadership reviews.
2. Does this dashboard support school bus maintenance work order tracking?
Yes, the dashboard includes a dedicated view for school bus maintenance work order tracking, showing how many orders are completed, scheduled, in progress, pending inspection, or overdue. This helps fleet managers prioritize repairs before vehicles become unavailable.
3. Can I customize this dashboard for my own campus data?
Yes, this is a Pro template on Mokkup that can be customized with your own KPIs, filters, and branding using the drag-and-drop editor. Once configured, it also works as a school fleet availability monitoring dashboard tailored to your specific routes and boarding houses.