
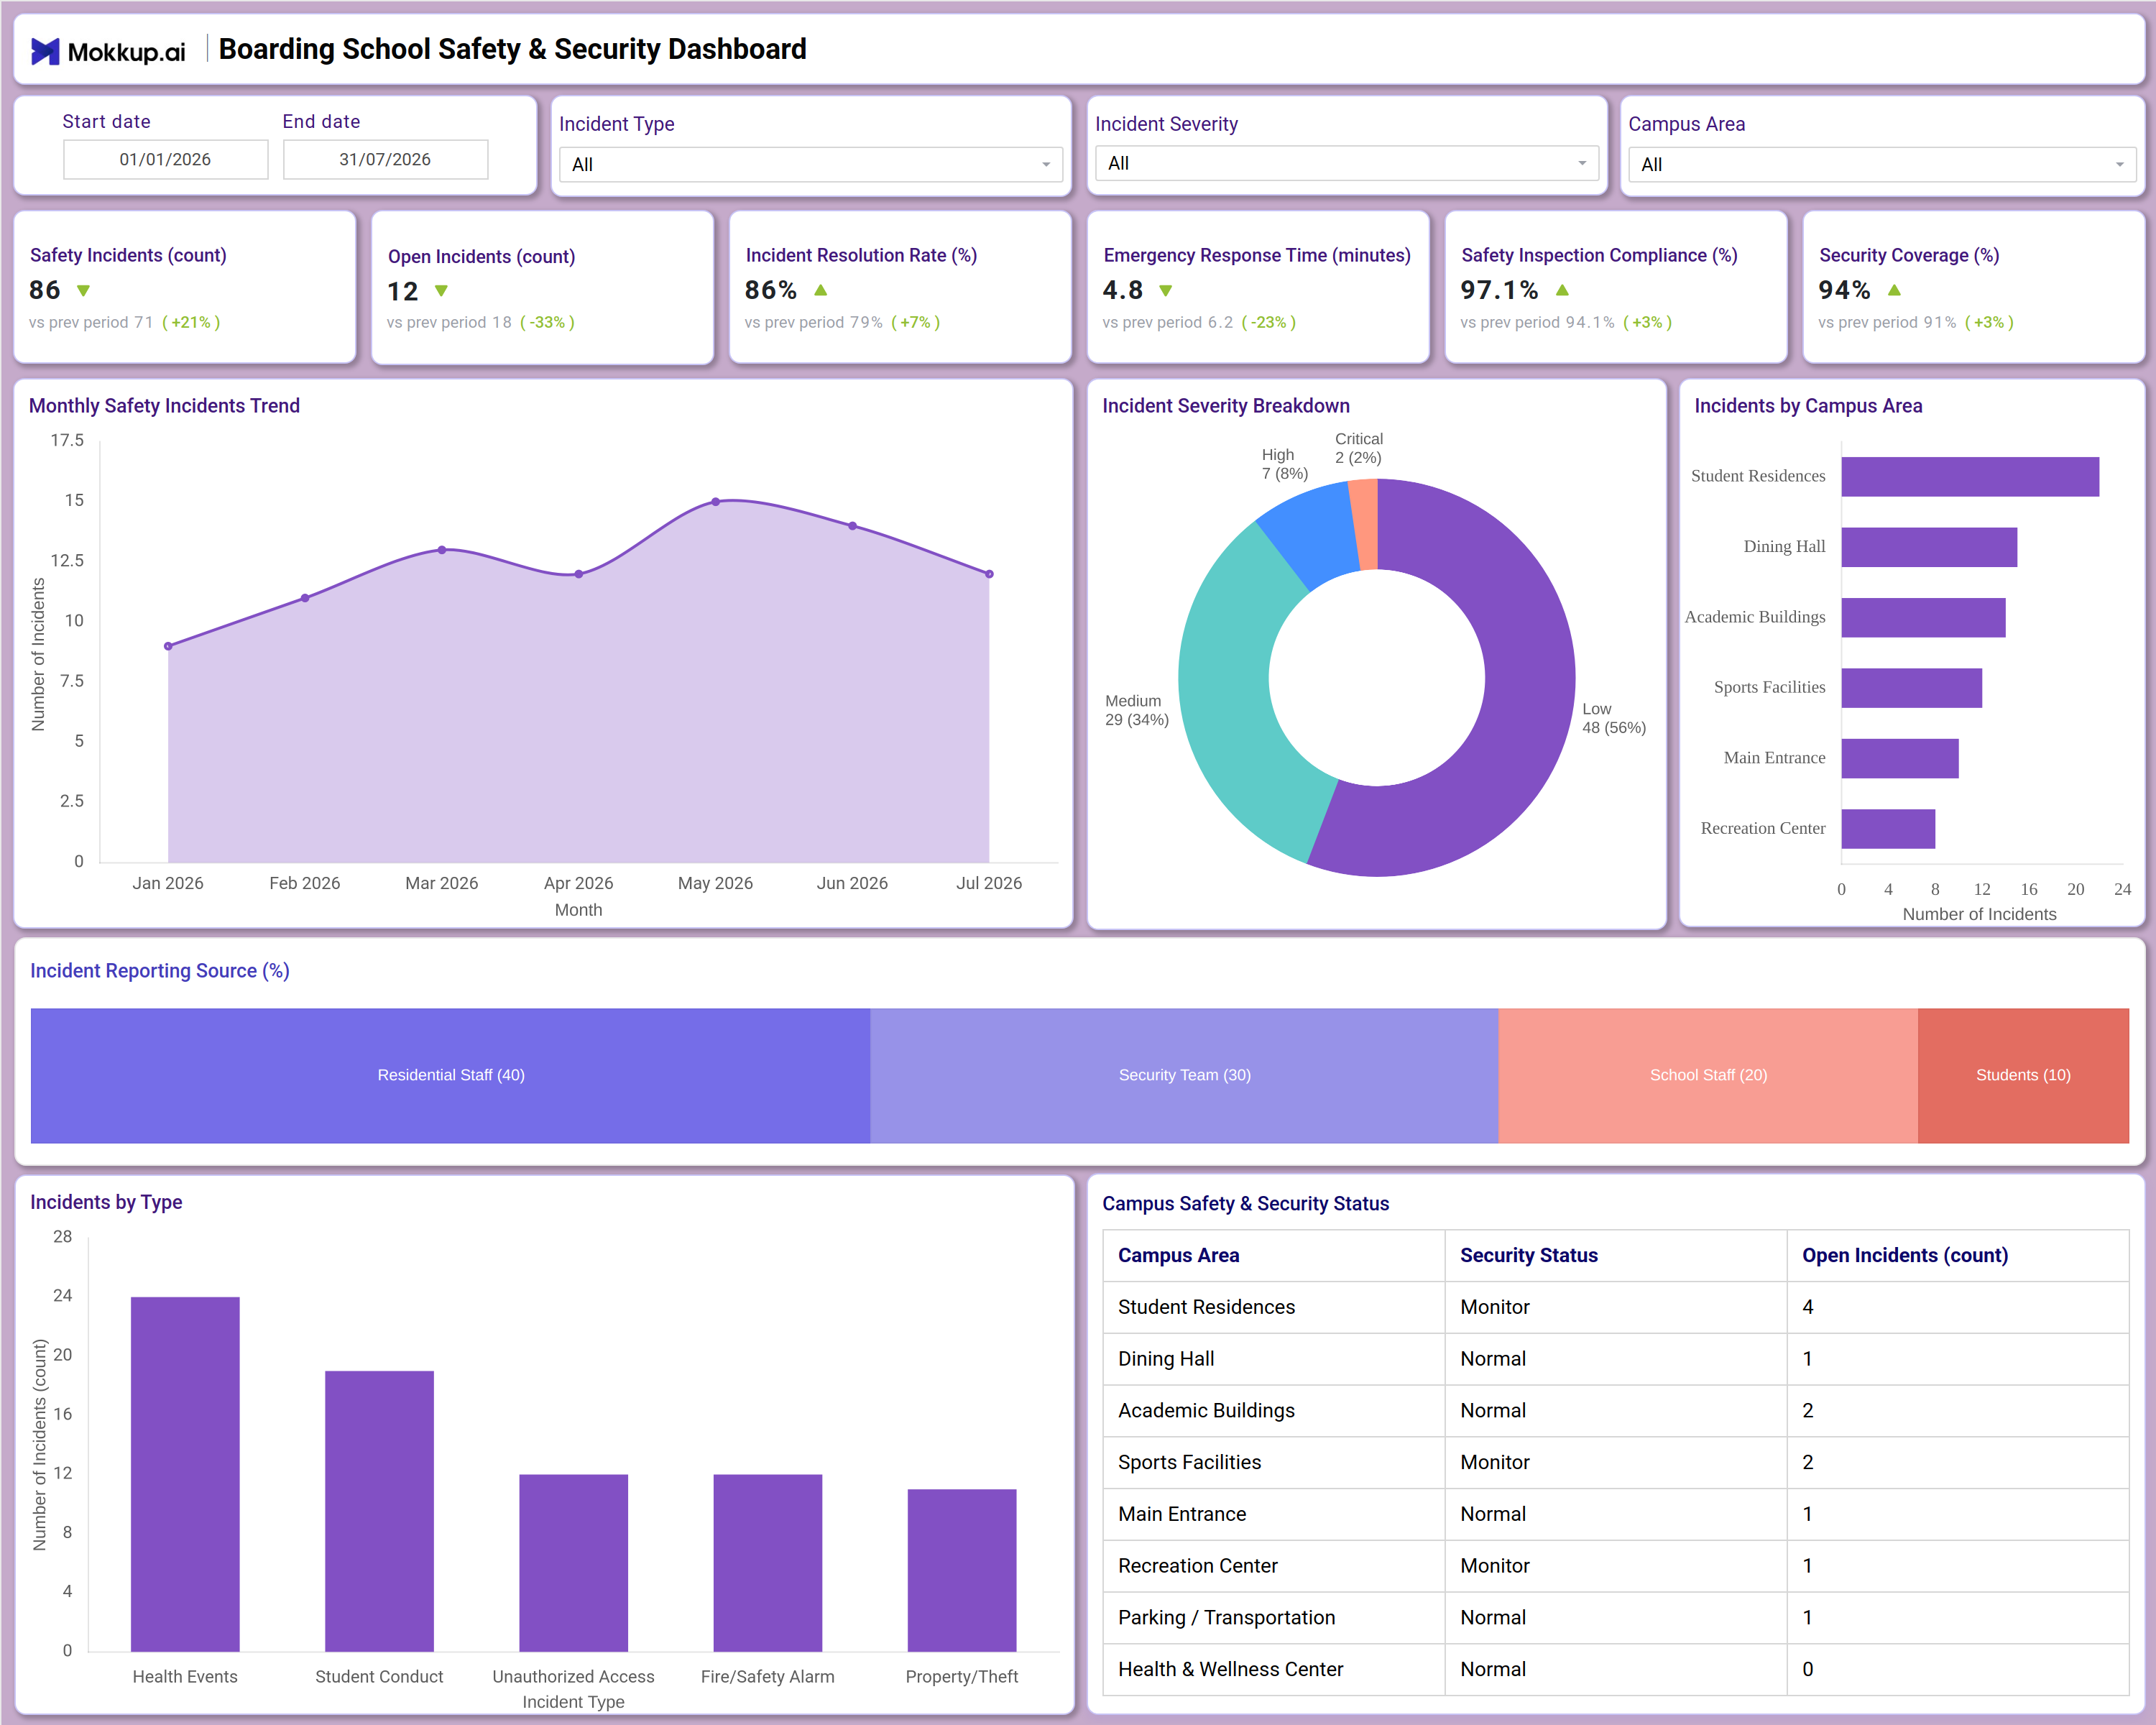
What is a Boarding School Safety & Security Dashboard?
A boarding school safety security dashboard gives residential life administrators, campus security teams, and school leadership a single view of how safe and secure their campus is at any point in the term. This campus incident tracking dashboard consolidates incident volume, severity, response speed, and compliance data that would otherwise sit scattered across security logs, inspection checklists, and incident report forms. Safety officers can filter by incident type, severity, and campus area to see exactly where risk is concentrated across residences, dining halls, academic buildings, and recreational spaces. As a campus safety KPI dashboard template, it supports faster decisions and consistent oversight across every building and shift for a school where students live on site around the clock.
How to Create a Boarding School Safety & Security Dashboard
You don’t need to start from scratch—just begin with a ready-to-use Dashboard Template from Mokkup. Here’s how:
1. Create or Log in to Your Mokkup Account
Start by signing up on Mokkup.ai using your email. If you already have an account, just log in, and you'll be good to go.
2. Choose and Customize Your Dashboard Template
Find the Boarding School Safety & Security Dashboard template in the Templates section. Use the drag-and-drop editor to adjust KPIs, edit filters, or add elements based on your data.
3. Export to Your BI Tool
Once your dashboard wireframe is ready, use the BI Tool Export feature to send it directly to Power BI or Tableau for further analysis and enhancements. You can also download the dashboard as a PDF, PNG, or JPEG, embed it on a platform, or invite your team to collaborate.
Note: This is a Pro template. You'll need a Pro subscription on Mokkup to use and customize this dashboard wireframe. Upgrade anytime to unlock full access.
Boarding School Safety & Security Dashboard Example
A campus safety director typically opens this boarding school safety security dashboard at the start of a shift or before a leadership meeting, looking to answer a simple question: is campus safety trending in the right direction this term. Filtering by date range, incident type, incident severity, or campus area narrows the view down to exactly the incidents that matter for that conversation, whether it is a spike in a particular building or a specific category of concern. From there, the director can track how incident volume is moving month over month, compare severity mix to see whether more incidents are trending toward high or critical classifications, and identify which campus areas or incident types are contributing most to the overall count.
Emergency response time monitoring becomes part of this same review, since a slowing response trend even amid falling incident counts signals a staffing or process gap that needs attention before it becomes a bigger issue. Reviewing which sources are reporting incidents most often also helps determine whether residential staff, security teams, school staff, or students themselves need better channels or training to flag concerns early.The overall outcome is a campus leadership team that no longer waits for a serious incident to review safety performance. Instead, they can validate that safety inspection compliance tracking and coverage levels are holding steady, catch resolution rates that are slipping before they affect student wellbeing, and walk into board or parent-facing conversations with a clear, current picture of how the school is managing safety and security across every corner of campus.
How to Analyze Data in a Boarding School Safety & Security Dashboard
Here is how you can analyze data from this dashboard:
- Use the Incident Severity filter to isolate Critical and High severity cases and confirm they are resolved first.
- Filter by Campus Area to review safety performance for a single building such as Student Residences or Sports Facilities.
- Monitor the Monthly Safety Incidents Trend chart to catch seasonal spikes before they affect residential life.
- Review the Incident Severity Breakdown donut chart to track what share of incidents fall into Medium, High, or Critical categories.
- Compare bars in Incidents by Campus Area to identify which locations generate the most incident volume.
- Analyze the Incident Reporting Source breakdown to see whether Residential Staff, Security Team, School Staff, or Students flag issues most often.
- Use the Incidents by Type chart to determine whether Health Events, Student Conduct, or Fire/Safety Alarm cases need targeted intervention.
- Track Emergency Response Time against incident volume to confirm emergency response time monitoring keeps improving even as case counts shift.
Benefits of a Boarding School Safety & Security Dashboard
The following are the benefits of using this dashboard:
- Centralizes safety incidents, open cases, and resolution rates in one boarding school safety security dashboard.
- Gives security teams and residential staff a shared campus incident tracking dashboard view of which buildings need closer monitoring.
- Reduces the time spent compiling incident reports for school leadership and parent communications.
- Highlights reporting-source patterns that reveal where safety training or awareness gaps exist.
- Surfaces severity mix at a glance so critical and high-severity cases get attention first.
- Supports safety inspection compliance tracking across every campus area without manual spreadsheet reconciliation.
- Turns Security Coverage into an ongoing security coverage rate dashboard metric that leadership can track term over term.
- Surfaces the Campus Safety & Security Status table so leadership can see open incidents and monitoring status by area at a glance.
KPIs to Track in a Boarding School Safety & Security Dashboard
The following key KPIs can be tracked by using this dashboard:
- Safety Incidents (count): Tracks the total number of safety and security incidents logged across campus during the selected period.
- Open Incidents (count): Measures how many reported incidents remain unresolved and still require action.
- Incident Resolution Rate (%): Shows the share of reported incidents that have been closed out, reflecting how efficiently the safety team responds.
- Emergency Response Time (minutes): Captures how quickly staff respond once an incident is reported, a core input for emergency response time monitoring.
- Safety Inspection Compliance (%): Reflects how consistently scheduled safety inspections are completed across campus facilities, supporting safety inspection compliance tracking.
- Security Coverage (%): Functions as the security coverage rate dashboard metric, indicating what portion of campus areas and shifts are actively monitored by security personnel.
Frequently Asked Questions
1. What industries benefit most from this Boarding School Safety & Security Dashboard?
Boarding schools, residential campuses, and independent schools with on-site housing benefit most, since safety directors, campus security teams, and residential life staff all need shared visibility into incidents and response performance.
2. Can this dashboard track incidents by campus location?
Yes. The Campus Area filter and the Incidents by Campus Area chart make this campus incident tracking dashboard capable of breaking down incident volume by location, from student residences to dining halls and sports facilities.
3. Is this campus safety KPI dashboard template suitable for tracking emergency response performance?
Yes. The Emergency Response Time KPI, combined with the Incident Severity Breakdown, lets teams monitor how quickly the school responds to incidents of varying urgency.