
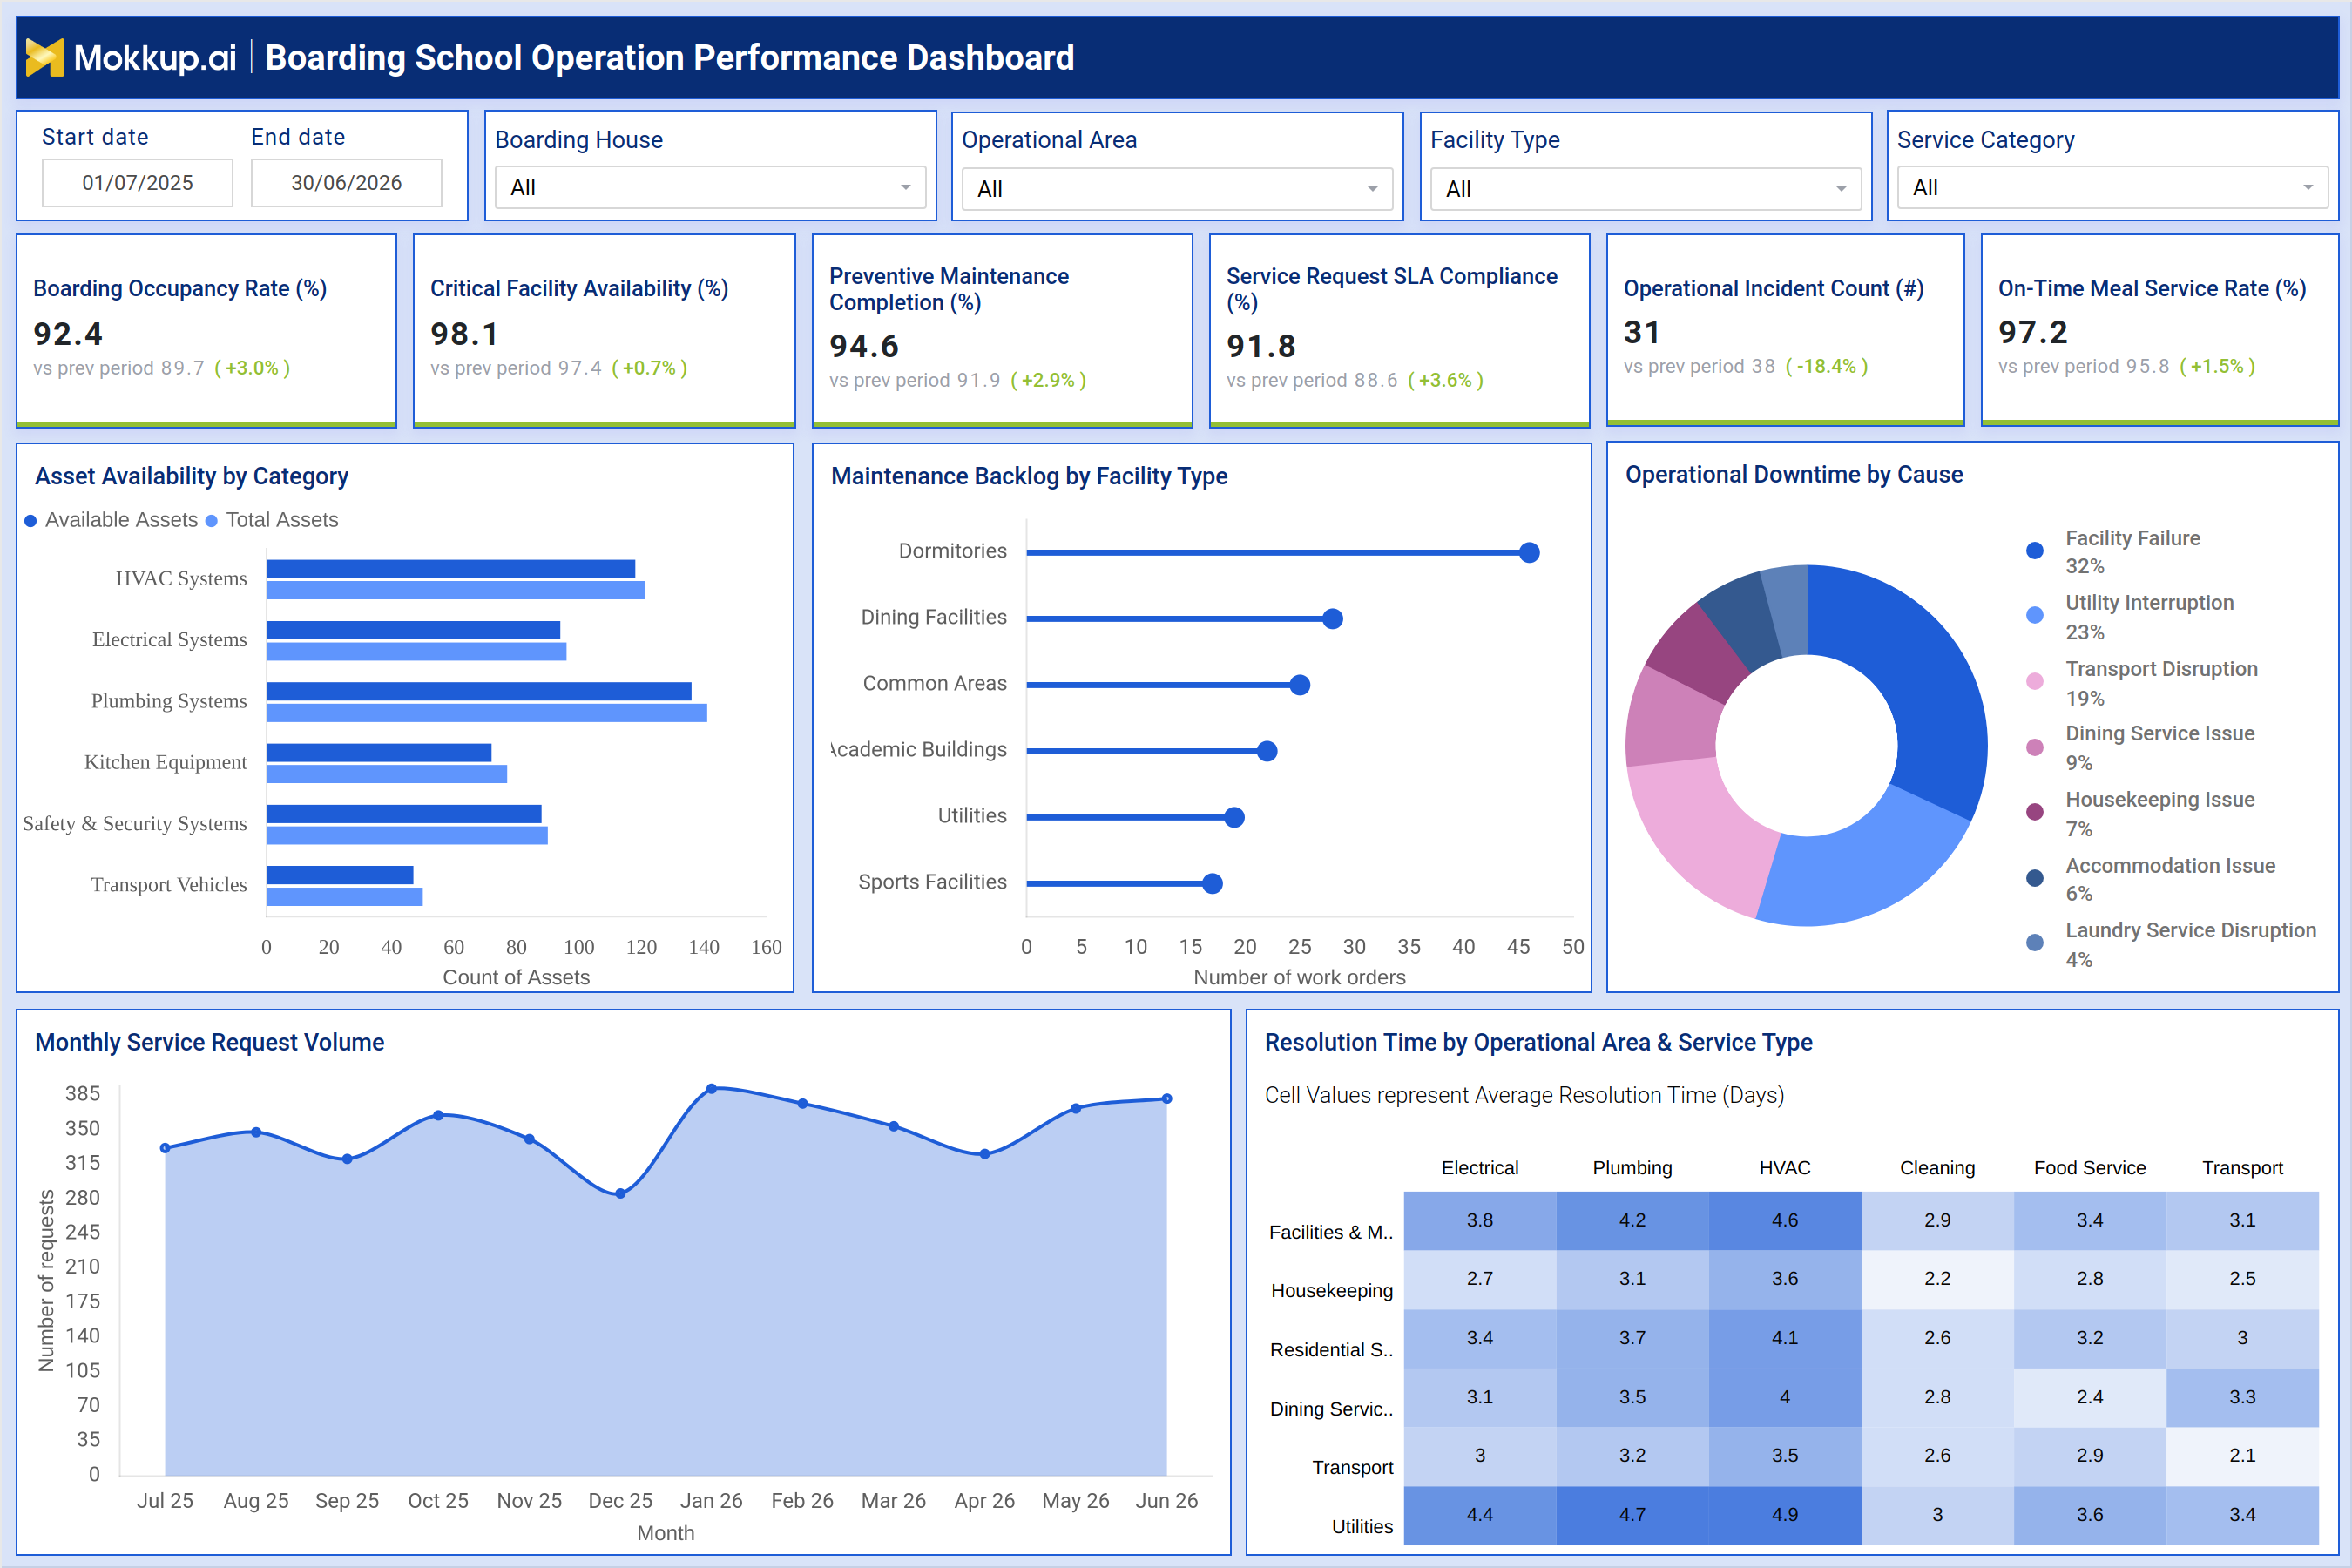
What is a Boarding School Operation Performance Dashboard
The Boarding School Operation Performance Dashboard gives boarding school administrators and facility teams a single screen to review residential operations across campus. Instead of pulling maintenance logs, occupancy records, and service tickets from separate systems, it consolidates occupancy, facility readiness, maintenance activity, and service delivery into one connected view. Filters for boarding house, operational area, facility type, and service category let a director narrow into a single dormitory while comparing it against campus-wide performance. With boarding house occupancy rate monitoring set alongside campus asset availability tracking, leaders see where residential life runs smoothly and where a building needs attention.
How to Create a Boarding School Operation Performance Dashboard
You don't need to build your report from scratch; just start with a ready-to-use dashboard template from Mokkup. Add in your data and export it however you like. Here's how to do it:
1. Create or Log in to Your Mokkup Account
Start by signing up on Mokkup.ai using your email. If you already have an account, just log in, and you'll be good to go.
2. Choose and Customize Your Dashboard Template
Find the Boarding School Operation Performance Dashboard template in the Templates section. Use the drag-and-drop editor to adjust KPIs, edit filters, or add elements based on your data.
3. Export to Your BI Tool
Once your dashboard wireframe is ready, use the BI Tool Export feature to send it directly to Power BI or Tableau for further analysis and enhancements. You can also download the dashboard as a PDF, PNG, or JPEG, embed it on a platform, or invite your team to collaborate.
Note: This is a Pro template. You'll need a Pro subscription on Mokkup to use and customize this dashboard wireframe. Upgrade anytime to unlock full access.
Boarding School Operation Performance Dashboard Example
A head of boarding operations opens this dashboard at the start of a term to gauge whether residential life across every boarding house is meeting expectations. The guiding question: are dormitories, dining halls, and shared facilities keeping pace with student needs, or is one part of campus falling behind? The director scans occupancy, facility readiness, and service compliance together to decide where to look first. From there, the dashboard guides specific decisions. When facility readiness dips, the team compares available against total assets across HVAC, electrical, plumbing, kitchen, safety, and transport categories and reviews downtime by cause to spot recurring failures.
Maintenance planners use the backlog view by facility type to prioritize the heaviest load, applying campus facility maintenance backlog tracking across the campus. Tracking monthly service request volume helps leaders plan staffing ahead of seasonal spikes, while resolution time by area and service type shows whether requests close as fast as electrical or HVAC repairs. This is where school service request SLA compliance becomes a shared standard, and boarding school operational incident tracking flags disruptions clustering in one part of campus. Altogether, the dashboard keeps residential operations predictable and shows parents and boards that campus operations are managed with discipline.
How to Analyze Data in a Boarding School Operation Performance Dashboard
Here is how you can analyze data from this dashboard:
- Compare Boarding Occupancy vs. Facility Availability: Identify residences where high occupancy is putting pressure on critical facilities.
- Filter by Boarding House / Area / Facility Type: Focus on a specific residence, location, or type of facility.
- Track Campus Asset Availability: Monitor the availability of HVAC, electrical, plumbing, kitchen, safety, and transport assets.
- Review Maintenance Backlog: Identify facility types with the highest backlog and prioritize maintenance accordingly.
- Analyze Operational Downtime: Break down downtime by cause to distinguish recurring failures from isolated disruptions.
- Monitor Monthly Service Requests: Track request volumes to plan staffing and vendor coverage effectively.
- Compare Resolution Time vs. SLA: Assess service response and resolution times by area against school SLA targets.
Benefits of a Boarding School Operation Performance Dashboard
The following are the benefits of using this dashboard:
- Centralizes Facility Operations Data: Brings occupancy, facility readiness, and service delivery into one dashboard.
- Tracks Maintenance Backlog: Highlights backlog and downtime causes early to support maintenance prioritization.
- Monitors SLA Compliance: Provides clear visibility into school service request SLA performance and accountability.
- Tracks Operational Incidents: Creates a structured view of boarding school operational incidents to improve response consistency.
- Monitors Preventive Maintenance: Tracks preventive maintenance completion rates to support scheduled upkeep.
- Provides a Unified Leadership View: Gives leadership one place to review campus facility performance without switching between systems.
KPIs to Track in a Boarding School Operation Performance Dashboard
The following key KPIs can be tracked by using this dashboard:
- Boarding Occupancy Rate (%): share of boarding house capacity filled by students, central to boarding house occupancy rate monitoring.
- Critical Facility Availability (%): share of dormitories, dining halls, and other facilities operational and ready for use.
- Preventive Maintenance Completion (%): share of scheduled maintenance completed on time, basis for the preventive maintenance completion rate for schools.
- Service Request SLA Compliance (%): percentage of requests resolved within agreed timeframes.
- Operational Incident Count (#): number of operational disruptions logged across campus.
- On-Time Meal Service Rate (%): consistency of dining service delivery on schedule.
Frequently Asked Questions
1. What is a Boarding School Operation Performance Dashboard?
A single-screen reporting view, built as a dashboard template, tracking occupancy, facility readiness, maintenance, and service delivery in place of separate systems.
2. How does the dashboard support boarding house occupancy rate monitoring?
It pairs Boarding Occupancy Rate with Critical Facility Availability, showing whether a residence is near capacity while facilities stay ready. Boarding house filters make it easy to compare occupancy trends across the year.
3. Does the dashboard help reduce maintenance backlog and support preventive upkeep?
Yes. Maintenance Backlog by Facility Type and Operational Downtime by Cause show where issues accumulate, while Preventive Maintenance Completion tracks scheduled work, supporting the preventive maintenance completion rate for schools.