
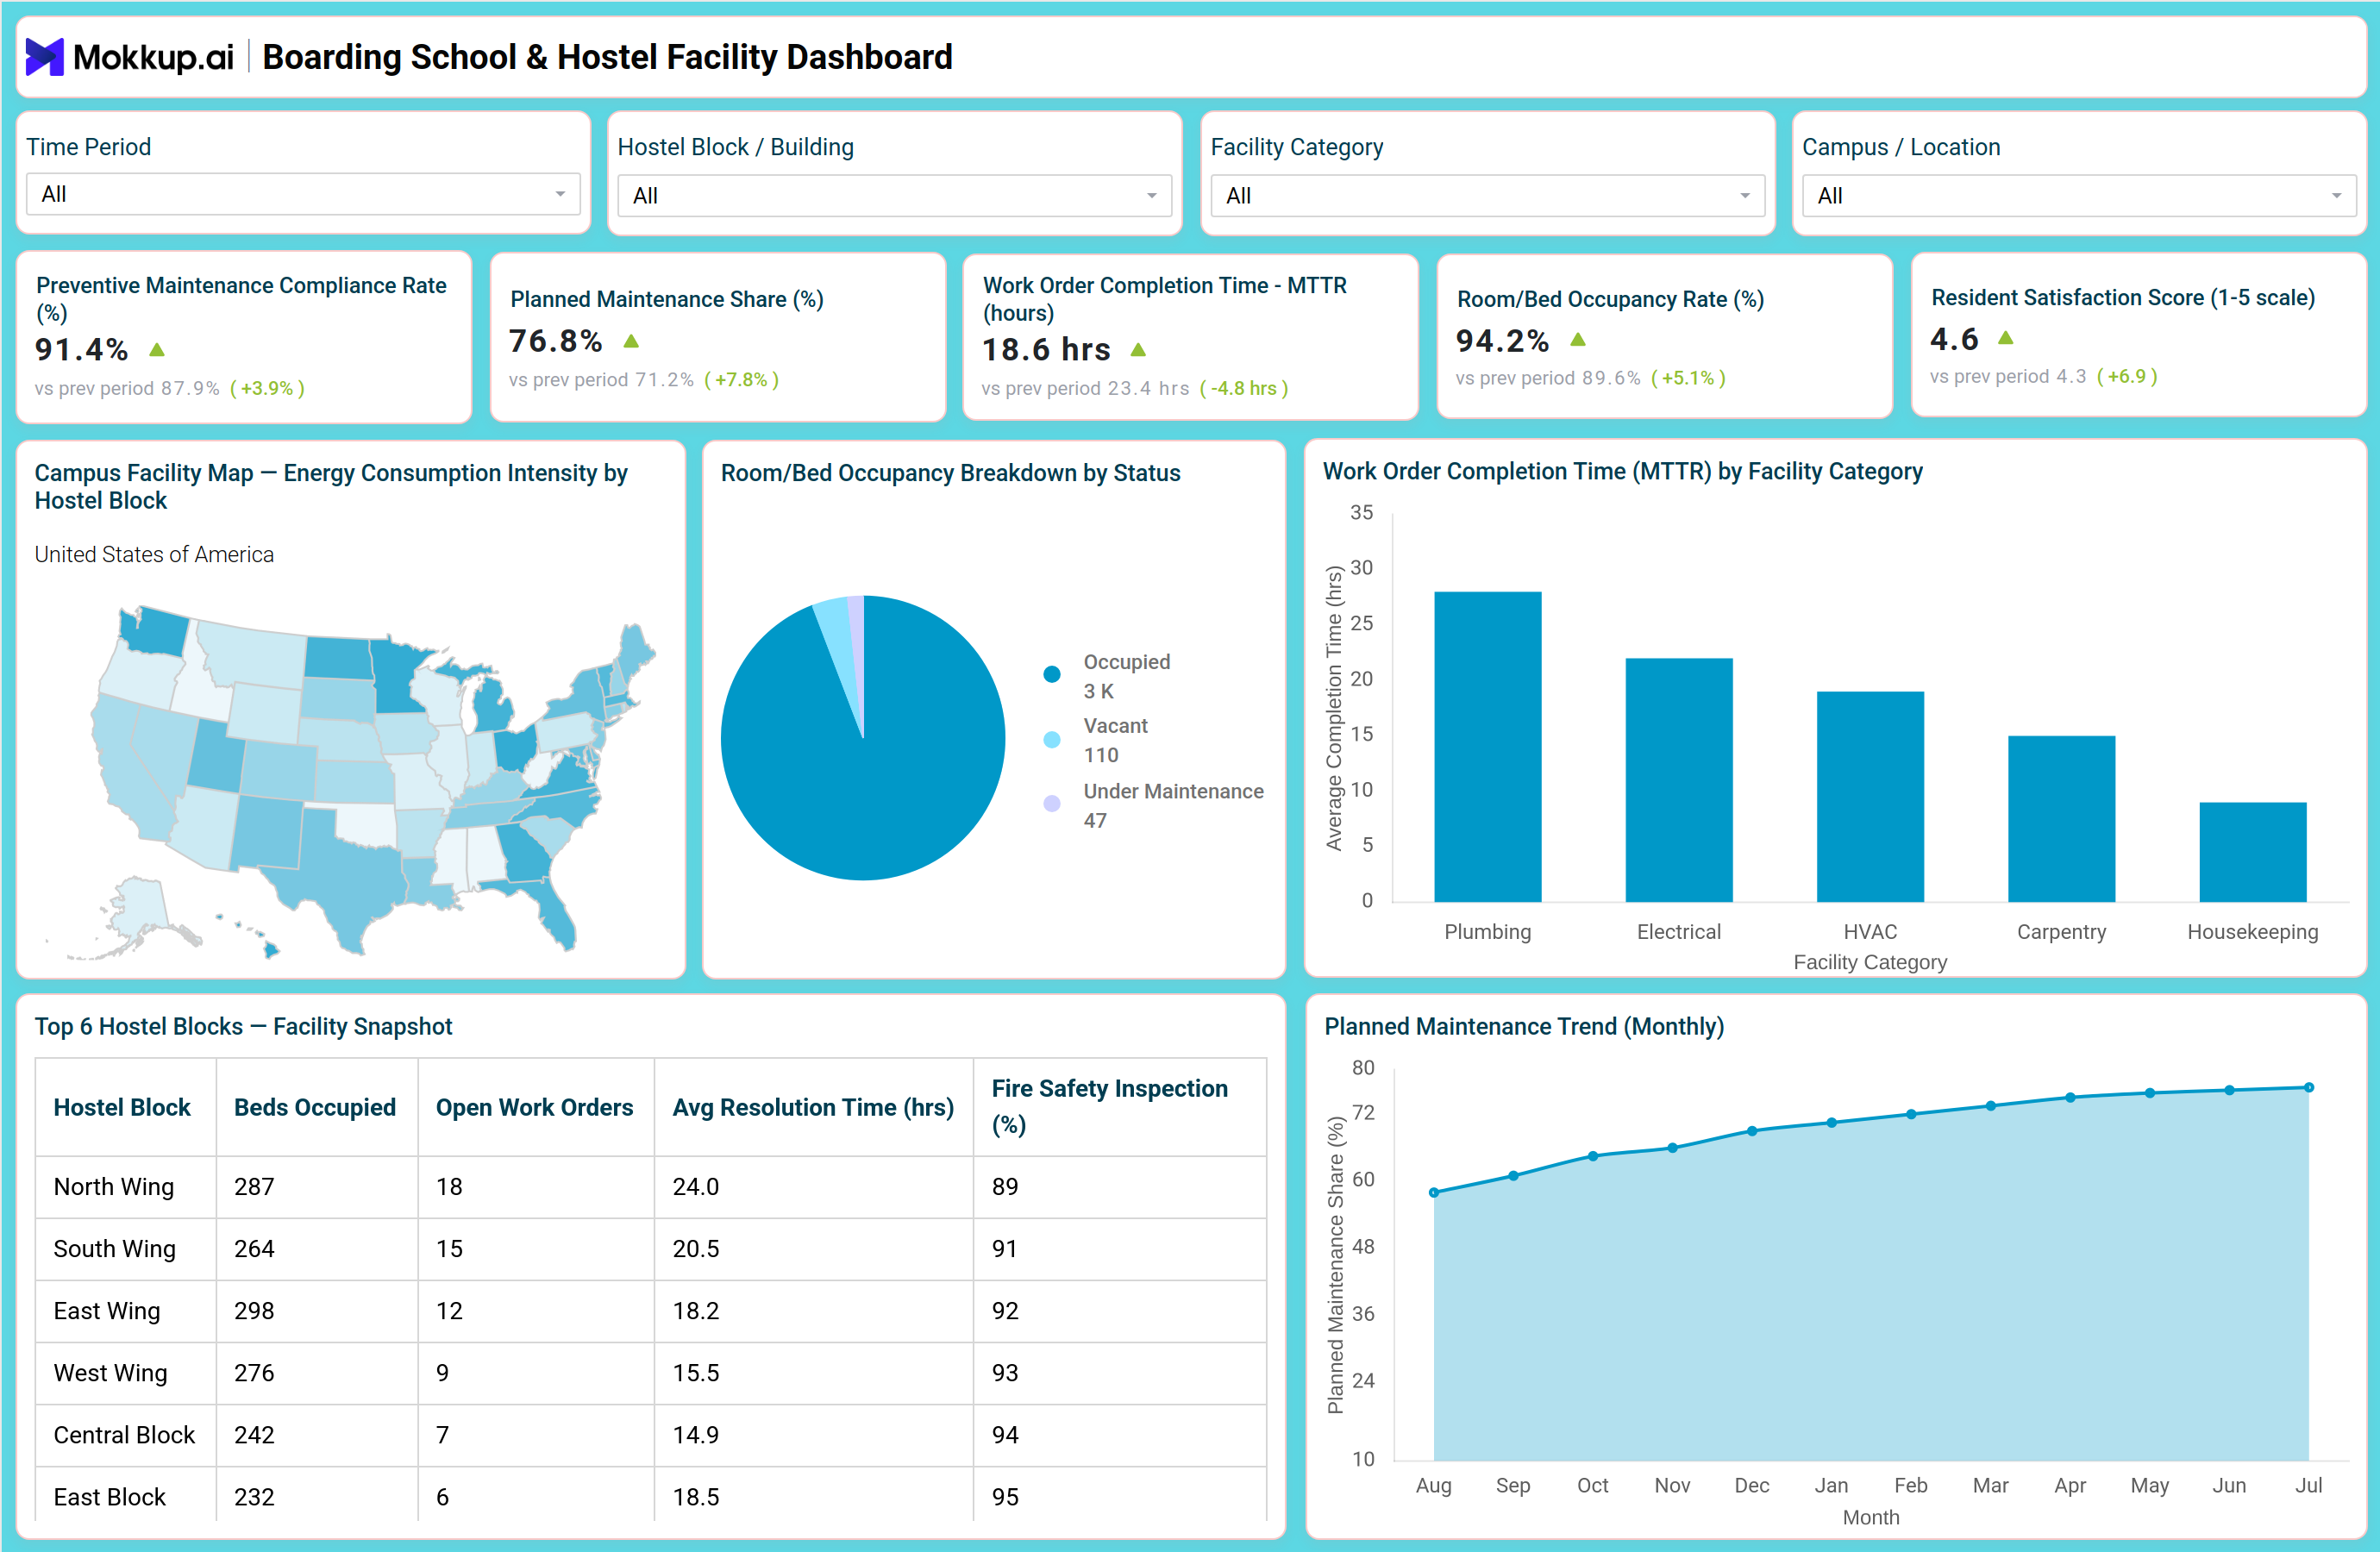
What is a Boarding School & Hostel Facility Dashboard?
A Boarding School & Hostel Facility Dashboard is a single-screen reporting tool that gives facility managers, wardens, and campus operations teams a consolidated view of how hostel infrastructure is performing across blocks, buildings, and campus locations. Rather than pulling maintenance logs, occupancy sheets, and safety inspection records from separate systems, this boarding school hostel facility management dashboard brings preventive maintenance activity, room and bed occupancy, work order resolution, and resident satisfaction into one place. Facility teams can filter by time period, hostel block or building, facility category, and campus location to narrow the view down to the exact segment they need to review. Because boarding schools operate residential facilities around the clock, the dashboard is built to surface issues quickly, whether that means an aging work order backlog in a specific wing or a facility category where completion times are slipping. For administrators who are ultimately accountable to parents and regulators for student welfare, a resident satisfaction score dashboard for hostels like this one turns scattered operational data into a single reference point that supports faster, better-informed facility decisions.
How to Create a Boarding School & Hostel Facility Dashboard
You don't need to build your report from scratch; just start with a ready-to-use dashboard template from Mokkup. Add in your data and export it however you like. Here's how to do it:
1. Create or Log in to Your Mokkup Account
Start by signing up on Mokkup.ai using your email. If you already have an account, just log in, and you'll be good to go.
2. Choose and Customize Your Dashboard Template
Find the Boarding School & Hostel Facility Dashboard template in the Templates section. Use the drag-and-drop editor to adjust KPIs, edit filters, or add elements based on your data.
3. Export to Your BI Tool
Once your dashboard wireframe is ready, use the BI Tool Export feature to send it directly to Power BI or Tableau for further analysis and enhancements. You can also download the dashboard as a PDF, PNG, or JPEG, embed it on a platform, or invite your team to collaborate.
Note: This is a Pro template. You'll need a Pro subscription on Mokkup to use and customize this dashboard wireframe. Upgrade anytime to unlock full access.
Boarding School & Hostel Facility Dashboard Example
A hostel facility manager typically opens this dashboard at the start of the week to understand how well maintenance operations are keeping pace with resident needs across every wing and block on campus. Before reviewing individual work orders, they want to know whether preventive maintenance is on track, whether rooms are turning over quickly, and whether any building is falling behind on safety standards. From the overview, the facility manager can use a preventive maintenance compliance rate tracking tool built into the dashboard to gauge whether planned maintenance is being prioritized over reactive repairs, and whether completion times are improving or slipping against the prior period.
By comparing work order resolution across facility categories, teams can identify which trade- plumbing, electrical, HVAC, carpentry, or housekeeping- is taking the longest to close tickets and needs additional staffing or vendor support. Reviewing occupancy alongside vacant and under-maintenance room counts helps planners decide whether upcoming intake can be accommodated or whether turnover needs to be accelerated. Looking at the hostel block breakdown, managers can compare beds occupied, open work orders, and average resolution time side by side to prioritize which wing needs attention first, while also checking fire safety scores to confirm every block meets compliance thresholds. Tracking the monthly trend in planned maintenance share lets leadership confirm that the shift toward proactive upkeep is holding steady rather than reverting to reactive firefighting during busy terms. Altogether, the dashboard helps facility and hostel administration teams stay ahead of maintenance backlogs, keep occupancy running efficiently, and demonstrate to school leadership that resident safety and comfort are being actively managed rather than addressed only after complaints arise.
How to Analyze Data in a Boarding School & Hostel Facility Dashboard
Here is how you can analyze data from this dashboard:
- Filter by Hostel Block or Building to isolate performance issues specific to one residence before escalating campus-wide.
- Compare Work Order Completion Time (MTTR) across facility categories as part of a routine work order resolution time analysis for boarding schools.
- Use this hostel room occupancy rate monitoring dashboard view to plan intake, transfers, and room turnovers ahead of term changes.
- Cross-reference Preventive Maintenance Compliance Rate against Planned Maintenance Share to confirm proactive upkeep is replacing reactive repairs.
- Review the Campus Facility Map to spot hostel blocks with disproportionately high energy consumption intensity.
- Check the Top 6 Hostel Blocks table, using it as a quick fire safety inspection compliance tracking tool, to prioritize wings with low safety scores.
- Track the Planned Maintenance Trend month over month to confirm improvements are sustained rather than seasonal.
- Filter by Campus/Location to benchmark facility performance when managing multiple boarding school sites.
Benefits of a Boarding School & Hostel Facility Dashboard
The following are the benefits of using this dashboard:
- Centralizes maintenance, occupancy, and safety data into one boarding school hostel facility management dashboard instead of scattered spreadsheets.
- Speeds up identification of underperforming trades through work order resolution time analysis for boarding schools.
- Improves accountability by giving wardens and facility teams a shared, consistent view of block-level performance.
- Supports better staffing and vendor decisions by highlighting which trades consistently take longer to resolve.
- Helps administration demonstrate compliance readiness to parents, auditors, and school boards using a fire safety inspection compliance tracking tool for every review cycle.
- Reduces reactive maintenance costs by tracking the shift toward planned, preventive upkeep.
- Makes room assignment and intake planning easier with clear occupancy and vacancy visibility.
KPIs to Track in a Boarding School & Hostel Facility Dashboard
The following key KPIs can be tracked by using this dashboard:
- Preventive Maintenance Compliance Rate (%)- central to any preventive maintenance compliance rate tracking tool, shows the share of scheduled maintenance completed on time.
- Planned Maintenance Share (%)- measures how much of total maintenance activity is proactive and scheduled rather than reactive repair work.
- Work Order Completion Time / MTTR (hours)- tracks the average time taken to resolve a maintenance ticket from request to close.
- Room/Bed Occupancy Rate (%)- the central metric in any hostel room occupancy rate monitoring dashboard, shows what portion of total beds are currently occupied.
- Resident Satisfaction Score (1-5 scale)- captures how residents rate their overall living experience and facility responsiveness.
Frequently Asked Questions
1. What does the Boarding School & Hostel Facility Dashboard track?
It tracks preventive maintenance compliance, planned maintenance share, work order completion time, room and bed occupancy, and resident satisfaction across every hostel block and campus location.
2. Who should use this dashboard?
Hostel wardens, facility managers, campus operations teams, and school administrators responsible for maintenance, safety, and residential living standards.
3.Can this work as a resident satisfaction score dashboard for hostels with multiple campuses?
Yes. The Campus/Location filter lets teams compare resident satisfaction, occupancy, and maintenance performance across multiple boarding school campuses from a single view.