
What is a Blood Bank Request & Issue Management Dashboard?
A Blood Bank Request & Issue Management Dashboard is a digital tool designed to help hospitals and healthcare institutions manage blood requests, track issue fulfillment, and monitor inventory in real time. It provides visibility into demand patterns, issue turnaround times, stock levels, cross-match success rates, and wastage metrics. With this dashboard, blood banks can reduce shortages, improve emergency response, and optimize donor supply management while ensuring compliance and patient safety.
How to Create a Blood Bank Request & Issue Management Dashboard
You don’t need to build your report from scratch—just start with a ready-to-use dashboard template from Mokkup. Add in your data and export it however you like. Here’s how to do it:
1. Create or Log in to Your Mokkup Account
Start by signing up on Mokkup.ai using your email. If you already have an account, just log in, and you’ll be good to go.
2. Choose and Customize Your Dashboard Template
Find the Blood Bank Request & Issue Management Dashboard template in the Templates section. Use the drag-and-drop editor to adjust KPIs, edit filters, or add elements based on your data.
3. Export to Your BI Tool
Once your dashboard wireframe is ready, use the BI Tool Export feature to send it directly to Power BI or Tableau for further analysis and enhancements. You can also download the dashboard as a PDF, PNG, or JPEG, embed it on a platform, or invite your team to collaborate.
Note: This is a Pro template. You’ll need a Pro subscription on Mokkup to use and customize this dashboard wireframe. Upgrade anytime to unlock full access.
Blood Bank Request & Issue Management Dashboard Example
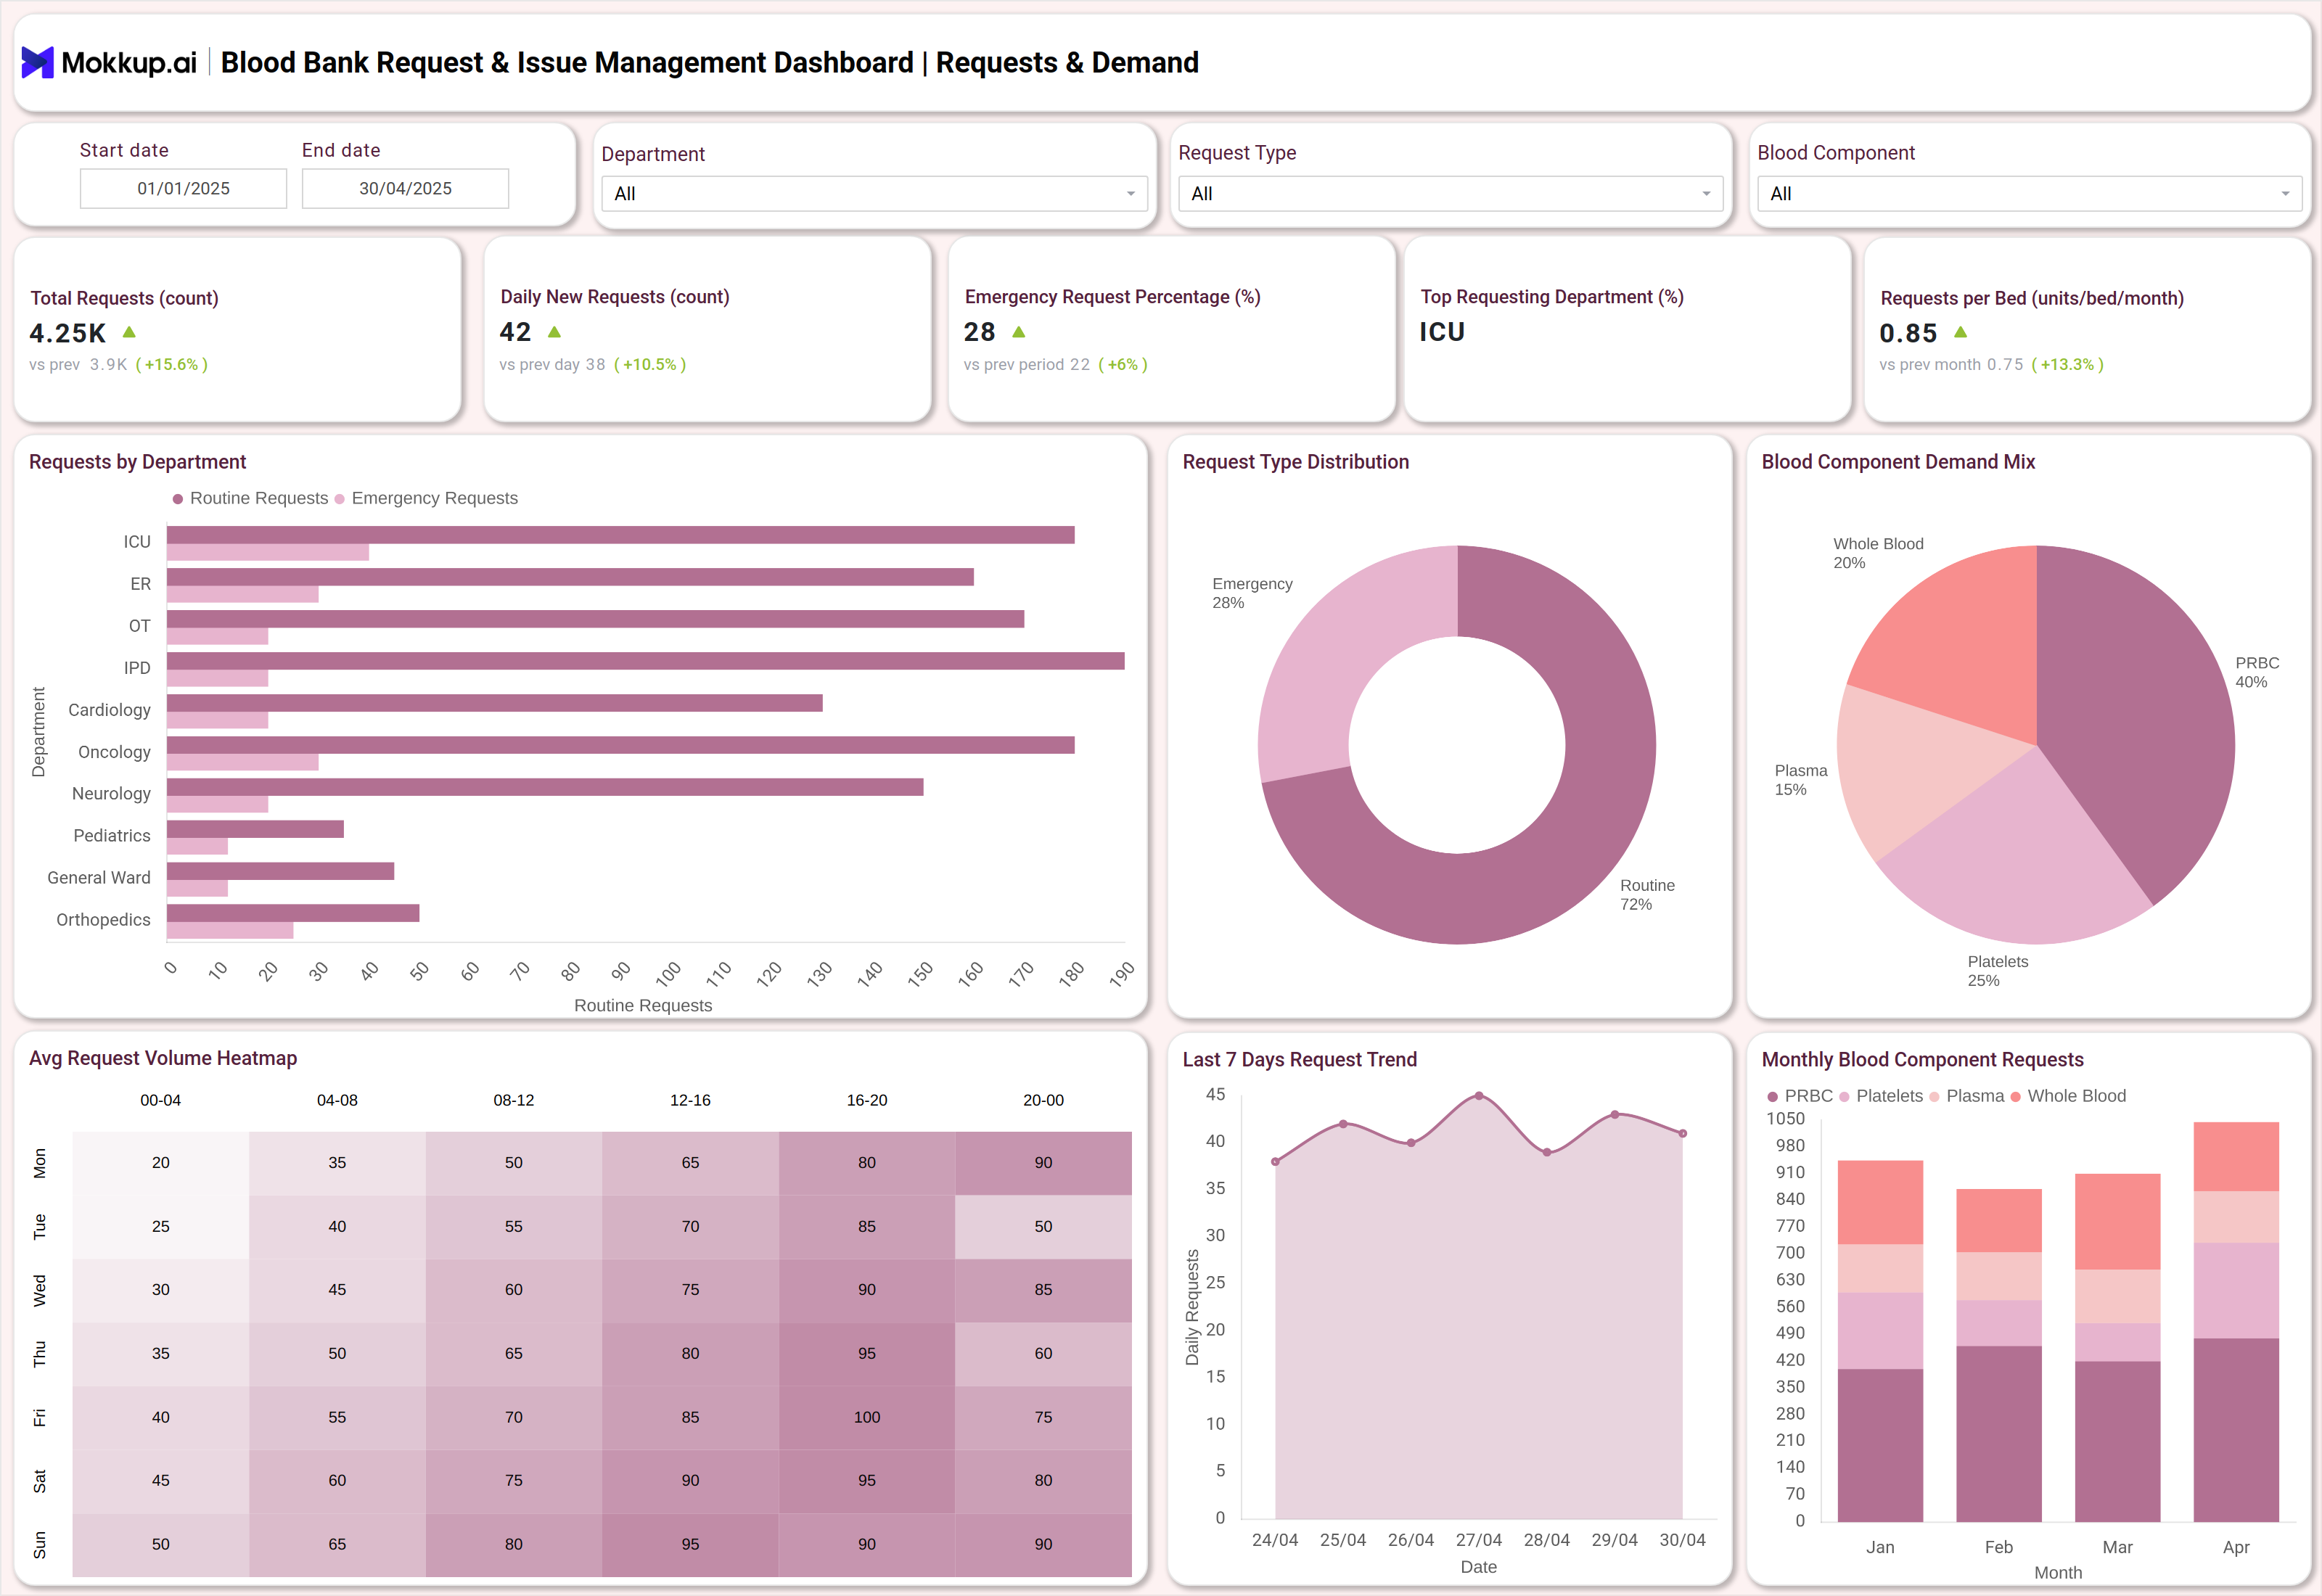
You can create a Blood Bank Request & Issue Management Dashboard that consolidates data across requests, fulfillment, and inventory. For example, the request module tracks daily and emergency blood demands by department, while the issue module shows fulfillment rates and turnaround times. The inventory screen monitors available stock, expiry risks, and the availability of rare blood groups. Combined, these insights provide hospital administrators and blood bank managers with a comprehensive overview of performance, enabling them to manage demand fluctuations and prevent critical shortages.
How to Analyze Data in Blood Bank Request & Issue Management Dashboard
- Track Request Volume → Monitor daily, weekly, and monthly requests by department (ICU, OT, ER).
- Identify Emergency Trends → Measure emergency request percentage and fulfillment rates.
- Monitor Issue Fulfillment → Compare requested vs. issued units and review unfulfilled cases.
- Review Turnaround Times → Analyze average and emergency issue times to improve efficiency.
- Optimize Inventory Levels → Track total stock, near-expiry units, and rare blood group availability.
- Reduce Wastage → Use wastage distribution metrics (expired, damaged, discarded) to improve storage and handling.
- Evaluate Donor Supply → Monitor voluntary vs. replacement donor contributions.
- Cross-Match Success → Assess success rate by component (PRBC, Platelets, Plasma).
Benefits of Blood Bank Request & Issue Management Dashboard
- Real-time request tracking for both routine and emergency demands.
- Improved fulfillment rates by identifying gaps between requested and issued units.
- Optimized inventory control with visibility into stock trends and expiry risks.
- Reduced wastage by monitoring discarded and expired units.
- Faster emergency response with insights into issue turnaround times.
KPIs to Track in Blood Bank Request & Issue Management Dashboard
- Total Requests Received → Measures monthly and daily requests.
- Emergency Request % → Proportion of urgent requests requiring immediate attention.
- Total Units Issued → Volume of blood components issued.
- Fulfillment Rate (%) → Percentage of fully completed requests.
- Emergency Fulfillment Rate (%) → Speed and success of urgent requests.
- Stock Availability (units) → Units of PRBC, Platelets, Plasma, and Whole Blood.
Frequently Asked Questions
Q1. Why do hospitals need a Blood Bank Request & Issue Dashboard?
Hospitals need it to streamline requests, ensure emergency preparedness, reduce wastage, and maintain compliance.
Q2. Can this dashboard track rare blood group availability?
Yes, it highlights inventory levels of rare blood groups like O- and AB-.
Q3. How does it help reduce wastage?
Tracking expiry risks, near-expiry units, and wastage distribution helps prioritize usage.