
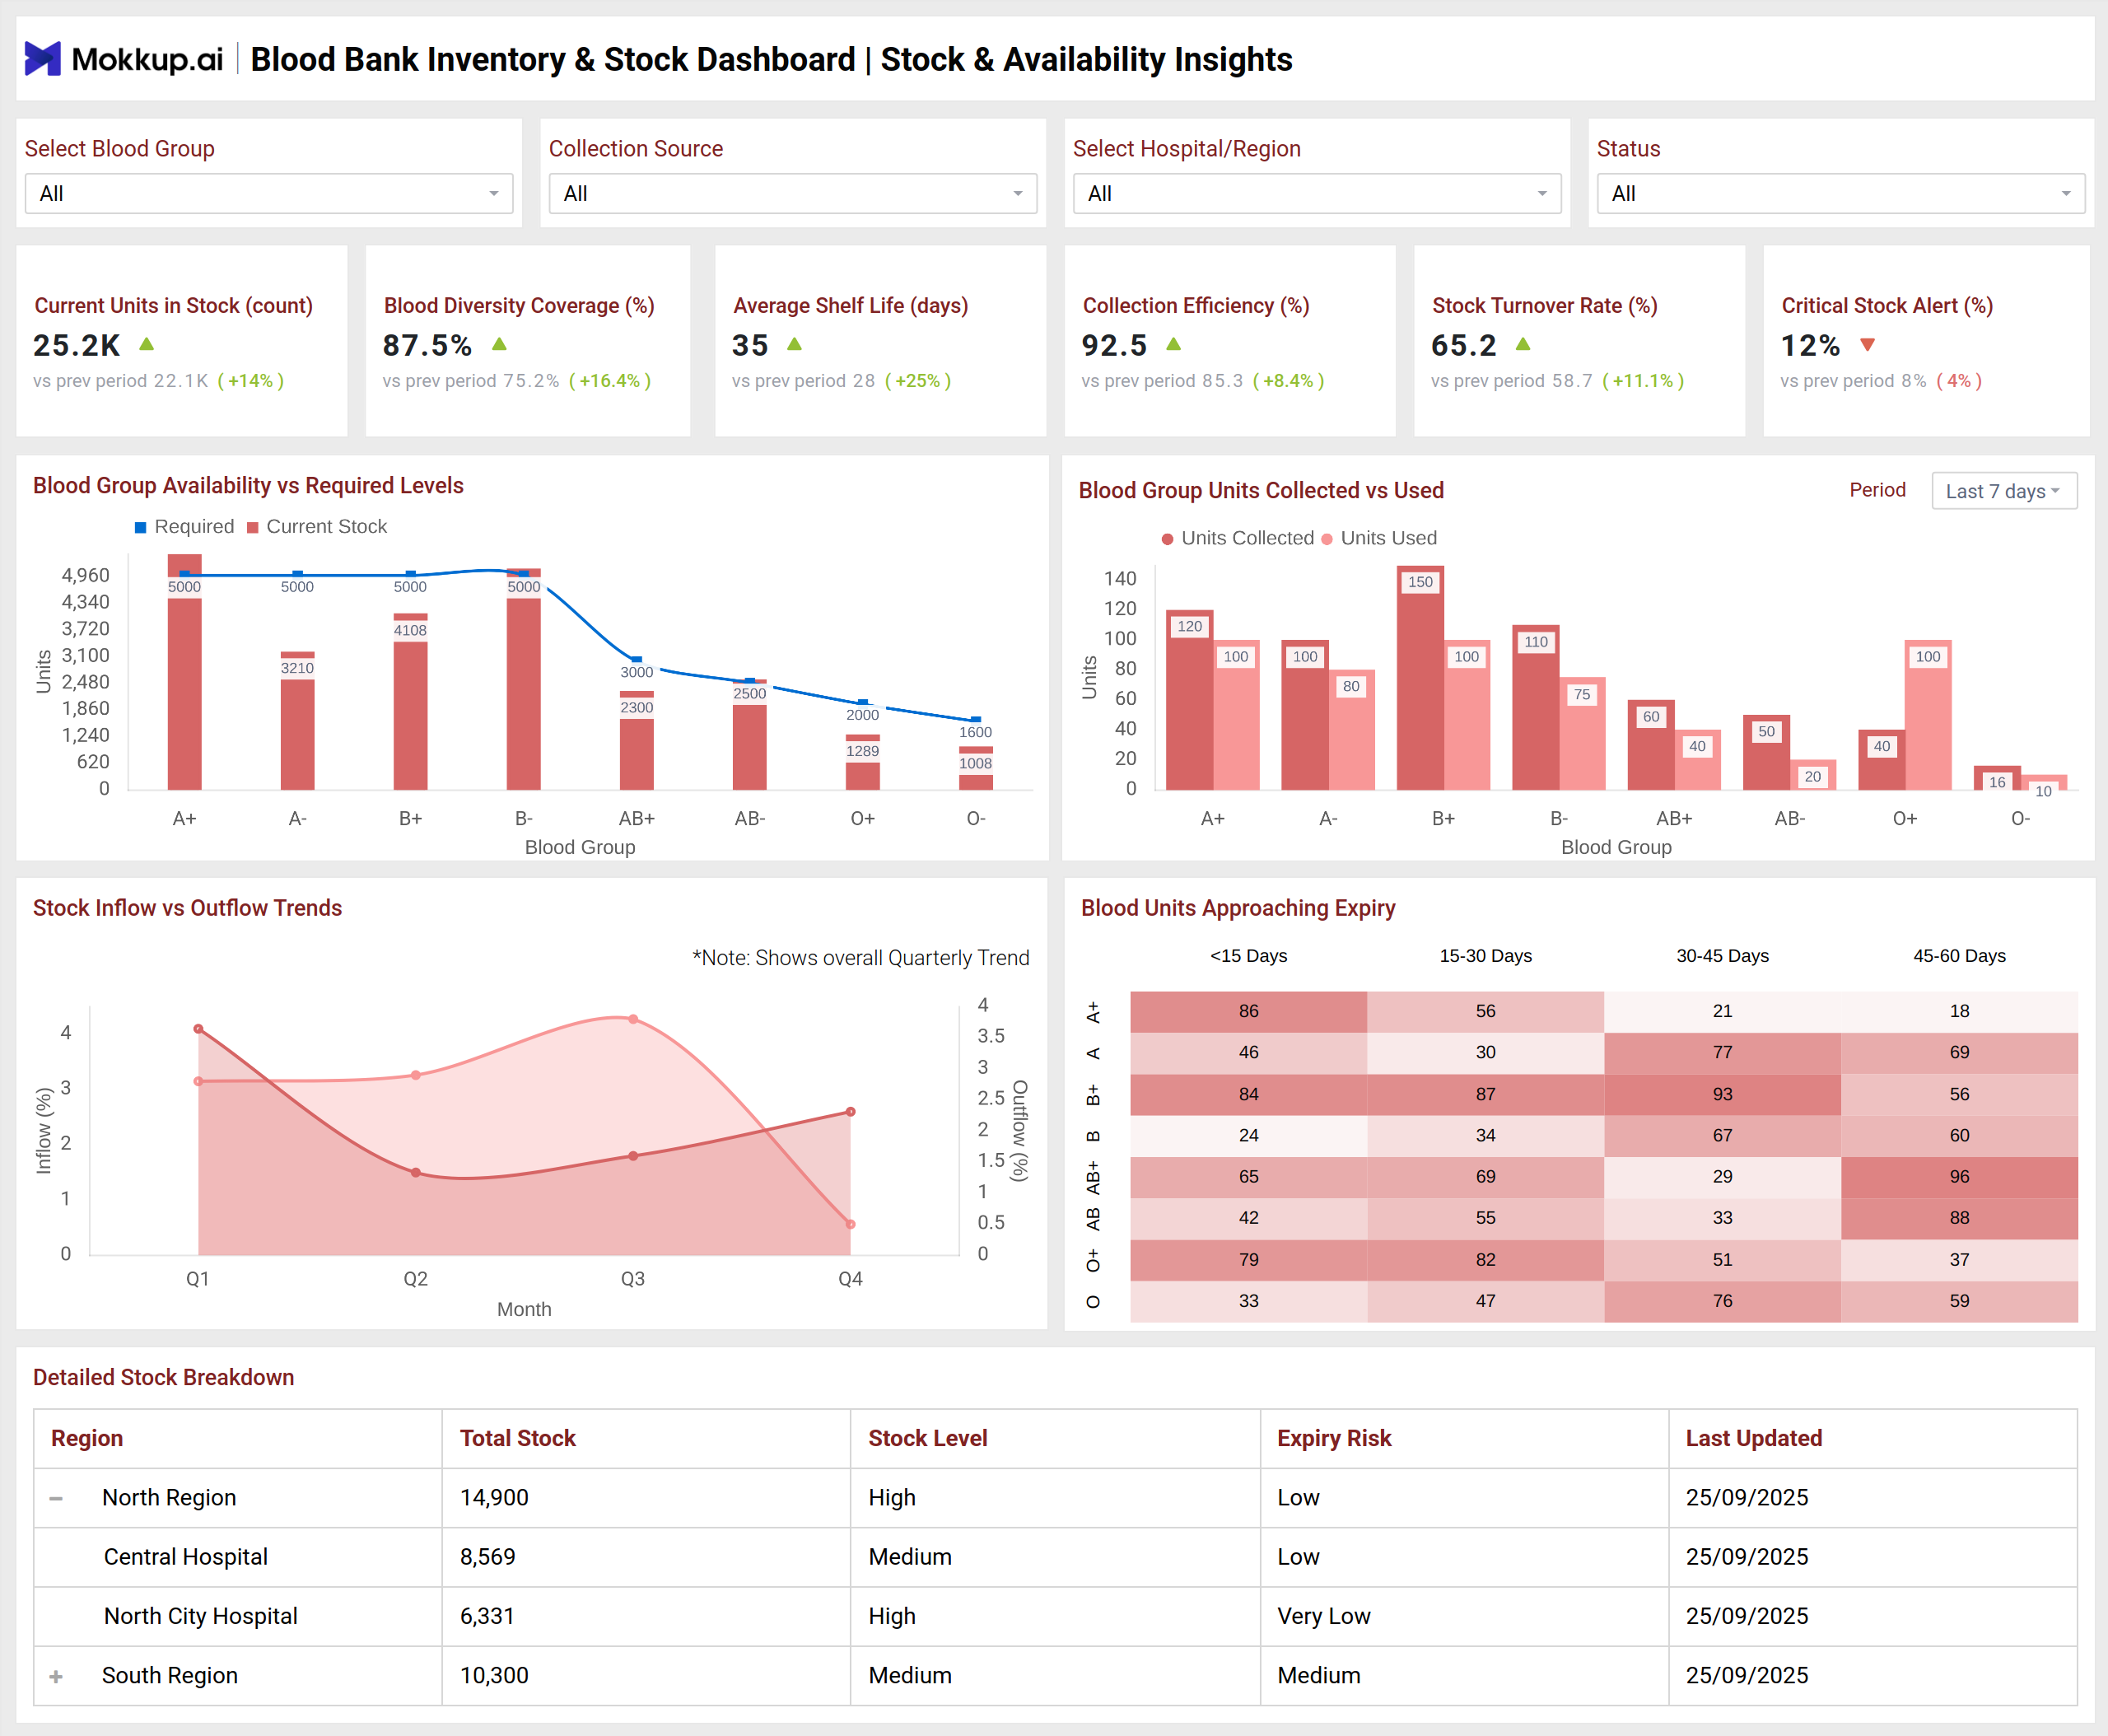
What is a Blood Bank Inventory & Stock Dashboard?
A Blood Bank Inventory & Stock Dashboard is a healthcare analytics template designed to provide real-time insights into blood stock levels, utilization, wastage, and operational performance across hospitals or regions. By centralizing these key metrics, the dashboard wireframe helps blood bank managers, supply chain officers, quality teams, and public health administrators monitor stock availability, identify expiry risks, optimize inventory turnover, and ensure critical blood units are available when needed.
How to Create a Blood Bank Inventory & Stock Dashboard
You don’t need to build your report from scratch—just start with a ready-to-use Blood Bank Inventory & Stock Dashboard template from Mokkup. Add in your data and export it however you like. Here’s how to do it:
1. Create or Log in to Your Mokkup Account
Start by signing up on Mokkup.ai using your email. If you already have an account, just log in, and you’ll be good to go.
2. Choose and Customize Your Dashboard Template
Find the Blood Bank Inventory & Stock Dashboard template in the Templates section. Use the drag-and-drop editor to adjust KPIs, edit filters, or add elements based on your data.
3. Export to Your BI Tool
Once your dashboard wireframe is ready, use the BI Tool Export feature to send it directly to Power BI or Tableau for further analysis and enhancements. You can also download the dashboard as a PDF, PNG, or JPEG, embed it on a platform, or invite your team to collaborate.
Note: This is a Pro template. You’ll need a Pro subscription on Mokkup to use and customize this dashboard wireframe. Upgrade anytime to unlock full access.
Blood Bank Inventory & Stock Dashboard Example
A Blood Bank Inventory & Stock Dashboard provides a comprehensive view of blood supply management through two primary perspectives: Stock & Availability Insights and Wastage & Operational Insights. It offers real-time visibility into blood availability, utilization, wastage, and overall operational efficiency. The dashboard wireframe tracks stock health across different blood groups, hospitals, and regions to prevent shortages, while highlighting expiry risks and identifying causes of wastage to improve shelf life. It also monitors efficiency metrics such as turnover rate, issuance accuracy, and time in storage, ensuring emergency readiness by confirming the availability of critical blood units
How to Analyze Data in Blood Bank & Stock Dashboards
Analyzing a Blood Bank Dashboard helps healthcare teams maintain optimal inventory levels, reduce wastage, and ensure emergency readiness.
- Monitor Stock Levels: Track total units and blood group diversity coverage to ensure minimum thresholds are maintained.
- Evaluate Operational Efficiency: Assess stock turnover, storage time, and issuance accuracy for process improvements.
- Identify Wastage Causes: Analyze expired or mishandled units by reason, region, or hospital to reduce losses.
- Optimize Emergency Readiness: Ensure critical blood units are available for urgent cases.
- Compare Regional Performance: Drill down by hospital, region, or collection source to identify best practices or bottlenecks.
Benefits of Blood Bank Inventory & Stock Dashboards
The dashboard template provides actionable insights that improve blood bank operations and support strategic decision-making:
- Improved Inventory Management: Monitor stock levels and blood group diversity in real time.
- Reduced Wastage: Identify and address reasons for expired or lost units.
- Operational Efficiency: Optimize storage, issuance, and stock turnover.
- Data-Driven Decisions: Enable administrators to allocate resources effectively.
- Stakeholder Confidence: Transparent reporting for hospital management and public health authorities.
KPIs to Track in Blood Bank & Stock Dashboards
Focusing on the right KPIs ensures hospitals and blood banks can maintain supply, reduce losses, and improve patient care:
- Current Units in Stock: Total number of blood units available across all blood groups.
- Blood Diversity Coverage (%): Percentage of blood groups above the defined minimum stock threshold.
- Average Shelf Life (days): Average number of days remaining before stored units expire.
- Stock Turnover Rate (%): Percentage of blood units issued compared to total available stock.
- Critical Stock Alert (%): Proportion of blood groups below safe minimum levels.
- Expiry Wastage (%): Percentage of blood units lost due to expiration.
- Stock-out Incidents (%): Frequency of times blood groups were unavailable when requested.
- Average Time in Storage: Average number of days a unit stays in storage before use or discard.
- Issuance Accuracy (%): Percentage of correctly issued units vs total requests.
- Emergency Readiness Index: Availability of critical and rare blood groups for urgent cases.
Frequently Asked Questions
Q1. Why is a Blood Bank Inventory & Stock Dashboard important?
It provides real-time visibility into stock levels, utilization, and wastage, enabling better decision-making and ensuring critical blood availability.
Q2. Which types of hospitals benefit most from this dashboard?
Blood banks, hospitals with multiple locations, regional blood centers, and institutions focusing on supply chain efficiency.
Q3. Can the dashboard help in reducing blood unit wastage?
Yes, by tracking expiry risks, identifying mishandling causes, and monitoring storage times, the dashboard helps reduce wastage and extend the shelf life of blood units.